MUBI/USDT Analysis by ICT price action Hello dear friends, according to ict concepts we can see very clear points for this coin, fvg area and gaps and for alt season starting this coin can move toward for touch this areas.
Wait for correction of gold and btc and moving of ETH. Then we can watch inject money to small coins like this.
Be patient and give good money from this market.
Wedge

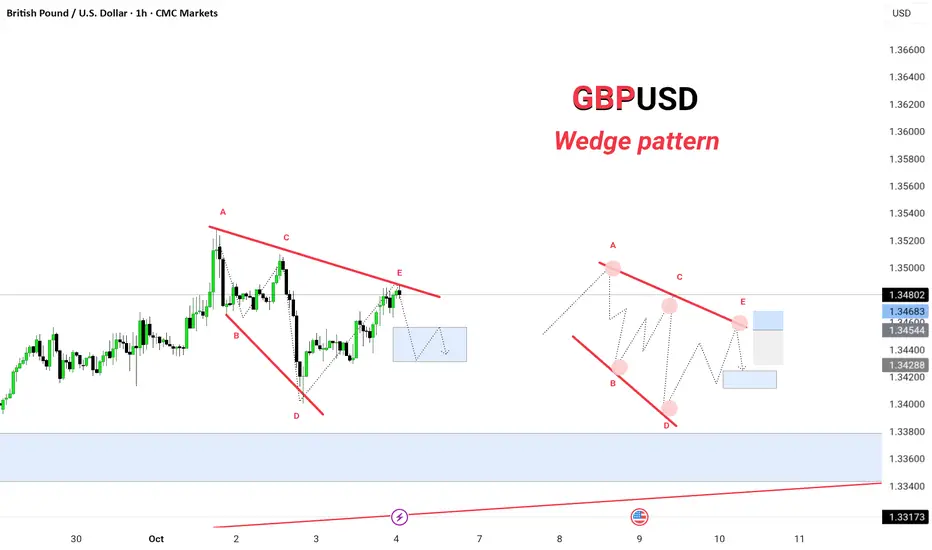
GBP/USD – Wedge Pattern Analysis | GreenfireForex
📊 Structure Breakdown:
A–C–E → Lower highs (trendline resistance)
B–D → Higher lows (trendline support)
Possible continuation: ABCDE → Breakout
Blue zones mark potential liquidity areas and entry/exit zones.
⚡ Trading Outlook:
Watch for confirmation candles near the E point before positioning. A clean breakout with volume will confirm the next major move.
🧠 Pattern type: Falling wedge (potential bullish reversal)
🕓 Timeframe: 1H
💰 Instrument: GBP/USD
EURUSD Short: Continuation Within the Downward WedgeHello, traders! The prior market structure for EURUSD was a bullish ascending channel, which failed and led to a breakdown. This reversal has established the current bearish market phase, which has taken the form of a downward wedge. This pattern has been guiding the price auction lower through a series of lower highs and lower lows, confirming that seller initiative is dominant.
Currently, the price action is consolidating within this wedge. Following a minor bounce, the market is showing signs of weakness and appears ready to continue the established downtrend, respecting the wedge's boundaries.
My scenario for the development of events is a direct continuation of the decline within this wedge. I expect the price to complete another leg down from the current levels. The take-profit is therefore set directly at the 1.1615 level, targeting the demand zone which aligns with the lower support line of the pattern. Manage your risk!

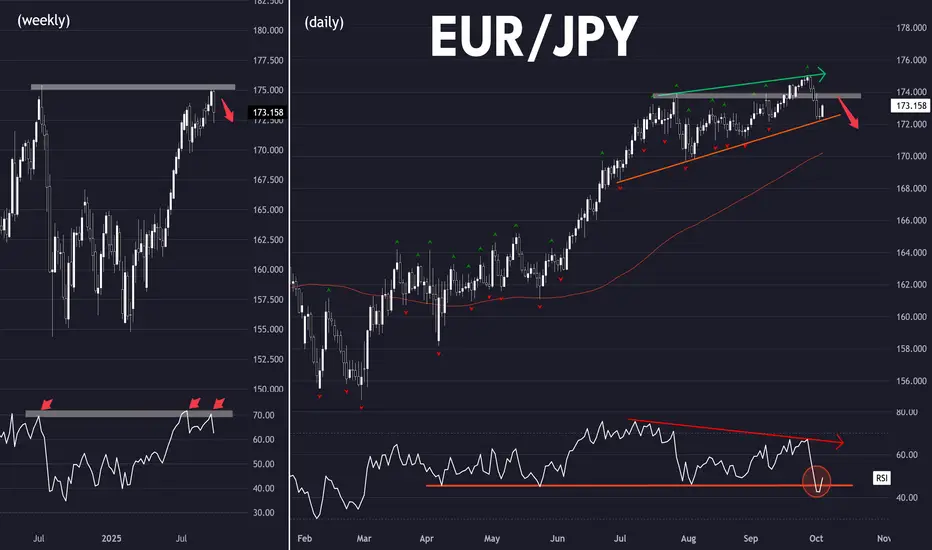
Getting in early on a trend reversal (EUR/JPY)Setup
Bearish: Potential long term top.
Bearish engulfing candlestick from multi-year highs
RSI has dropped from 70 overbought
Signal
Fakeout: Looking for rebound to stall near the former resistance at 174.
RSI bearish divergence, taken out support
Caution: uptrend line has held so far. A break would confirm trend reversal.
Too early to trade the reversal?
Would you weait for a breakdown first ?
Let's discuss
Ta, Jasper
ZEC wedgie ideaA wedgie is the act of forcibly pulling someone's crypto up their buttocks. It can be a form of bullying a victim or a prank among friends. There are various types of wedgies, such as an "atomic wedgie," where the crypto is pulled over the victim's head, or a "hanging wedgie," where the person is suspended by their crypto coin.

S&P 500: Rising Wedge signals movement before NFP📈 BLUEBERRY:SP500 | Rising Wedge + Non-Farm Payrolls: Which breakout scenario is more likely?
A Rising Wedge pattern is forming on the 30-minute chart of US SPX 500, with price approaching the convergence point of two trendlines. This pattern typically signals weakening bullish momentum but doesn’t rule out a breakout to the upside 🚀.
🔍 Technical Analysis:
• Price is consolidating within a narrowing channel, forming a Rising Wedge 🔺.
• Key support lies between 6717 - 6734 (lower blue zone) 🛡️.
• Target zone on a breakout to the upside is 6767 - 6775 (upper blue zone) 🎯.
• The pattern signals an imminent breakout, but confirmation with a candle close beyond the wedge is needed 🕒.
📊 Non-Farm Payrolls Impact:
• If NFP comes in below expectations, the market may react positively (break up) on hopes of Fed easing monetary policy 💵👍.
• Conversely, a higher-than-expected NFP could increase downside pressure (break down from the wedge) 📉⚠️.
💡 Trade Setup:
• Enter a BUY position once price breaks above 6733 with confirming high volume 🔥.
• Place stop loss below support at 6716 to manage risk 🚧.
• Target area between 6770 - 6775 🎯.
📝 Summary:
The Rising Wedge on SPX 500 points to a breakout soon, with the NFP report acting as a key catalyst. Wait for confirmation and manage your risk carefully ✅.
Please like and comment below to support our traders. Your reactions will motivate us to do more analysis in the future 🙏✨
Harry Andrew @ ZuperView

EURCAD: wedge at the top with bearish divergenceThe EUR/CAD pair has been trading within an ascending channel, but the 4H chart shows a rising wedge pattern, typically a reversal setup. Attempts to sustain above 1.64 have failed so far, while the CCI indicator shows a series of bearish divergences, highlighting weakening bullish momentum.
Technically, the likelihood of a decline after the wedge breakout is high. Initial targets lie at 1.6260, followed by 1.6080, and deeper at 1.5780. A retest of the broken level (re-entry) is possible before the downward move accelerates.
From a fundamental perspective, the euro remains pressured by weak macro data and a cautious ECB, while the Canadian dollar is supported by stable oil prices and a firm Bank of Canada stance. This divergence in fundamentals strengthens the bearish case.
It’s a classic situation where the market tempts traders into expecting a reversal, but confirmation is still required. As always, emotions aside — we wait for clear signals before acting.

What’s a Wedge Pattern?What's up traders! 👋
Wedge patterns are a powerful tool in technical analysis that can give you a heads-up about potential price moves. Whether you’re spotting a falling wedge or a rising wedge, these formations can reveal key signals about market direction.
What’s a Wedge Pattern?
A wedge pattern forms when price moves between two converging trendlines, creating a shape resembling a triangle. These patterns usually appear when the market is slowing down or consolidating before making a bigger move. Wedges can slope upwards or downwards, and the key difference lies in whether the trendlines are converging in an uptrend (rising wedge) or a downtrend (falling wedge).
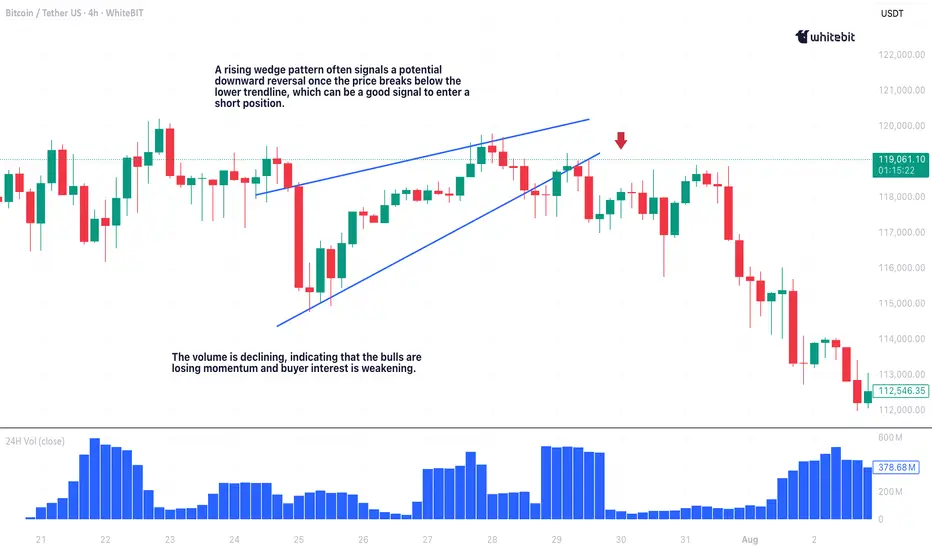
Falling Wedge Pattern: Bullish Reversal 📈
The falling wedge pattern is a bullish reversal signal. This formation occurs when price moves between two downward-sloping trendlines, creating a series of lower highs and lower lows. The downward momentum weakens as the trendlines converge, indicating that sellers are losing strength, which sets up the potential for a bullish breakout.
How to Trade the Falling Wedge
Entry: Wait for the price to break above the upper trendline. This is your signal to enter long.
Target: Measure the height of the wedge at its widest point and project it upwards from the breakout point.
Stop Loss: Place it just below the most recent swing low to protect your position if the breakout doesn’t happen.
The chart illustrates a falling wedge pattern on the Bitcoin / Tether US pair with a 1-hour timeframe. Price action is contained within two converging downward-sloping trendlines, suggesting weakening bearish momentum. The breakout above the upper trendline signals a bullish reversal, and the subsequent uptick in price confirms the shift in momentum.
In rare cases, a breakout failure can lead to a bearish falling wedge pattern, but this scenario is less common. Keep an eye on the price action for signs of continued upward momentum.
Rising Wedge Pattern: Bearish Reversal 📉
The rising wedge pattern is a bearish reversal signal. This formation happens when price moves between two upward-sloping trendlines, creating higher highs and higher lows. The rising wedge indicates weakening buying pressure and a potential reversal to the downside.
How to Trade the Rising Wedge
Entry: Enter a short position once the price breaks below the lower trendline.
Target: Measure the height of the wedge and project it downward from the breakout point.
Stop Loss: Set it just above the most recent swing high to protect your trade.
Wedge Chart Pattern Trading: Key Tips ⚡
Context is everything when trading wedge patterns. If a bullish wedge pattern appears in an uptrend, it’s more likely to break to the upside. If a bearish wedge shows up in a downtrend, expect a breakdown.
Here are a few quick tips to improve your wedge trading pattern game:
Trendlines are key: Ensure your trendlines are drawn accurately. Properly drawn trendlines lead to better trades.
Breakout confirmation: Confirm breakouts with increased volume and, ideally, by checking for confluence with other indicators like RSI or MACD. A breakout without volume is often a false signal.
Risk management: Always use a stop loss to protect your capital.
Use other indicators: Wedge patterns work well with additional tools such as RSI, moving averages, or MACD. The more confluence, the better!
Final Thoughts 🏁
Wedge patterns, whether it’s the falling wedge pattern signaling a bullish reversal or the rising wedge pattern trading indicating bearish pressure, are some of the most reliable chart formations out there. But remember: no setup is perfect, so always use a stop loss and never rely on a single indicator.
With practice, you’ll get better at spotting these setups and timing your entries and exits like a pro. Happy trading, and may the charts be in your favor! 💰📊
BTCUSD: Watching for Exhaustion at the HighsHello everyone, here is my breakdown of the current Bitcoin setup.
Market Analysis
From a broader perspective, the price action for Bitcoin has been extremely volatile, with multiple failed breakdowns and breakouts. After a complex struggle, the most recent significant event was a powerful breakout above the 116800 level, followed by a successful retest, which confirmed the shift in control to buyers.
Currently, following that breakout, the price has entered a high-momentum rally. This upward impulse is strong but is becoming technically extended, which often increases the probability of a sharp corrective pullback as buyers begin to take profits.
My Scenario & Strategy
My scenario is a tactical short, aiming to capture this likely corrective move. After such a strong, impulsive rally, a pullback to test the original breakout level is a very common and healthy market dynamic. I'm anticipating that the price will make one last small push to a new high, where it will likely fail to find new buyers.
Therefore, the strategy is to watch for this exhaustion at the highs. A confirmed reversal would validate the short scenario. The primary target for this corrective move is the 116800 level, which aligns with the key Support zone.
That's the setup I'm tracking. Thank you for your attention, and always manage your risk.

GBPUSD SHORTA. Why a Bearish Trade Setup (Primary Bias)
The sell-side case is stronger right now, and here’s why:
1. Rejection at Higher-Timeframe Resistance (4H)
o Price reached the 1.3520–1.3530 zone, which has acted as a ceiling before.
o Instead of breaking higher, sellers aggressively rejected it, leaving long wicks and bearish momentum.
o When the market rejects a resistance multiple times, it signals that big players (institutions) are unloading longs and building shorts.
2. Rising Channel & Wedge Structure
o On the 4H and 1H, price was moving inside an upward sloping channel (higher highs, higher lows).
o However, the most recent swing failed to extend higher — a loss of bullish momentum.
o The 1H shows a wedge formation breaking down. Wedges usually resolve in the direction of the larger trend (which has been bearish overall).
3. Support Becomes Resistance
o On the 1H and 15M, the zone 1.3475–1.3490 was previously support during the climb.
o Now, after breaking, price is retesting it from below and struggling to get above — a textbook S→R flip.
o This is a high-probability short setup because it shows buyers are losing control.
4. Downside Space Available
o Below current price, the chart is “clean” until 1.3380–1.3320 demand zone.
o This means there’s very little structure to stop sellers, so if momentum builds, price can fall quickly.
✅ Bearish Summary:
The market shows clear rejection at resistance, a broken rising structure, and a confirmed support-to-resistance flip. Sellers are in control, with room for price to drop into the next demand zones. That’s why the sell plan is the primary play.
B. Why a Bullish Scenario Must Be Considered (Invalidation Case)
Even though the bias is bearish, we can’t ignore the bullish possibility. Here’s why:
1. False Breakouts Are Common
o Markets often “fake” a breakout to trap traders.
o If too many sellers pile in after this wedge break, price could reverse upward sharply to liquidate them.
o This is why it’s dangerous to assume one direction only — we must have a plan if sellers get trapped.
2. Key Level at 1.3445
o If price breaks below 1.3445 and holds, bearish continuation is valid.
o But if price dips under 1.3445 and then snaps back above with strong bullish candles, it signals liquidity grab/stop hunt — a bullish reversal signal.
3. Break of 1.3525 Resistance
o The entire bearish case is based on the idea that 1.3525 will hold as resistance.
o If bulls break and close above 1.3525, that invalidates the supply zone and shows buyers taking control again.
o At that point, selling becomes too risky, and flipping bullish becomes the smarter play.
4. Overall Market Context
o On the 4H, GBPUSD is still in a larger corrective uptrend since its last major bottom.
o If dollar weakness kicks in or fundamentals shift, bulls could easily push GBPUSD back toward 1.3560 → 1.3620.
✅ Bullish Summary:
A bullish case would be needed if:
• Sellers fail to break 1.3445 (liquidity grab).
• Or price reclaims and holds above 1.3525 (supply zone invalidated).
This would flip the bias to bullish with upside targets at 1.3560 → 1.3620 → 1.3700.
⚖️ Putting It Together
• Bearish Trade = Primary Plan
o Sell 1.3475–1.3490 zone.
o SL 1.3525.
o TP1: 1.3445 → TP2: 1.3380 → TP3: 1.3320.
• Bullish Trade = Invalidation Plan
o If price holds above 1.3525 → look for buys.
o SL: 1.3490.
o TP1: 1.3560 → TP2: 1.3620 → TP3: 1.3700.
👉 This way, you’re never “married” to one bias. You follow what the market shows:
• If rejection continues → ride the sell plan.
• If buyers reclaim control above 1.3525 → switch to the buy plan.

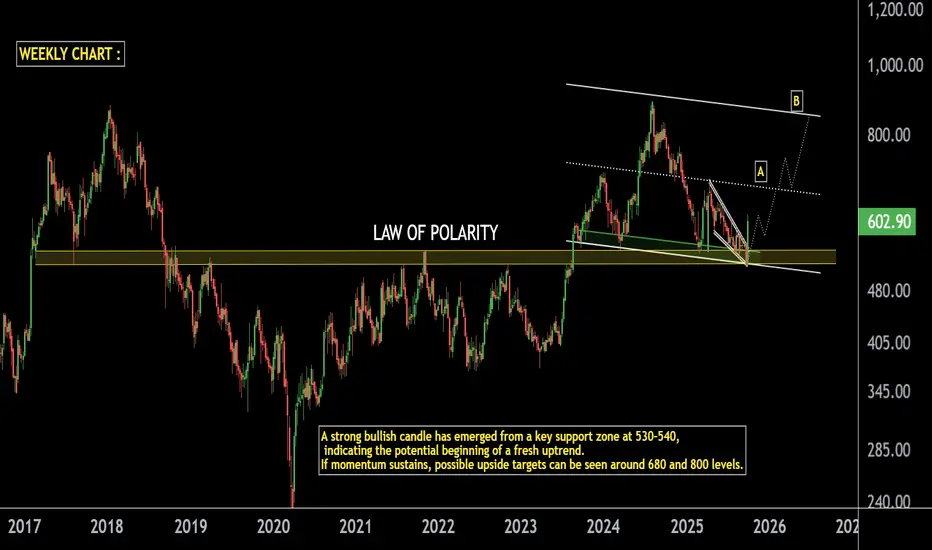
SUN TV on Fire: Explosive Move from Strong Support Zone.SUN TV Weekly Analysis
Support Zone: Stock is respecting the long-term LOP with strong support in the 520–530 range.
Bullish Candle: A powerful bullish candle has formed at this support zone, signaling strength.
Momentum Outlook: If momentum continues, a minor correction could act as a healthy pause before the next rally.
Resistance Levels:
First resistance / rally stop point near 680.
If 680 breaks, next resistance is positioned around 850.
Trend View: As long as the 520–530 support zone sustains, SUN TV may continue its rally in the coming sessions.
Thank You !!
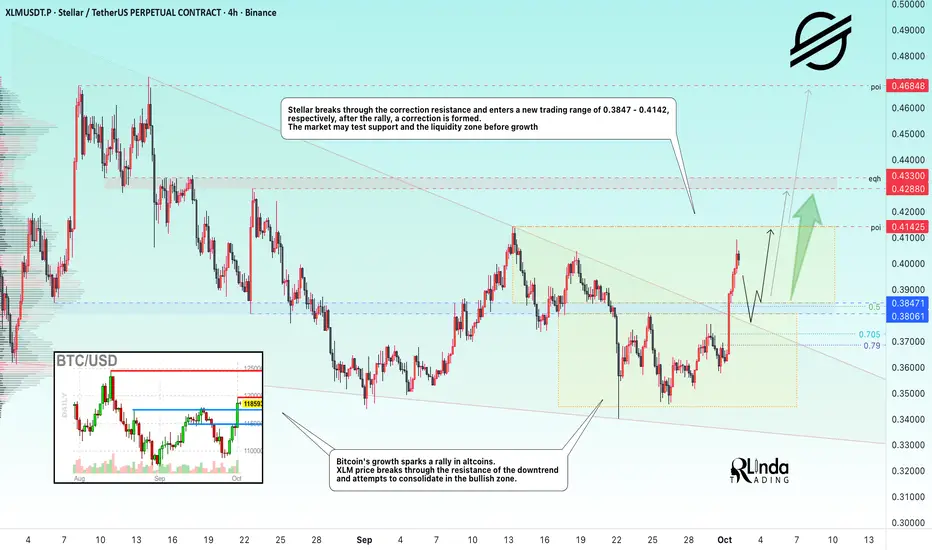
XLMUSDT → End of correction. One step away from a rally BINANCE:XLMUSDT follows the flagship currency in forming a rally and breaking out of the correction. The trend is bullish, but news is ahead. Will the bulls be able to keep the price above the risk zone?
Bitcoin's growth is provoking a rally in altcoins. The price of XLM is breaking through the resistance of the downtrend and trying to consolidate in the bullish zone.
Stellar is breaking through the resistance of the correction and entering a new trading range of 0.3847 - 0.4142, respectively, after the rally, a correction is forming. The market may test support and the liquidity zone before rising.
Resistance levels: 0.4142, 0.4288, 0.433
Support levels: 0.3847, 0.3806
As part of the correction, I expect a retest of the 1/2 zone of the formed impulse or the support zone of 0.385 (previously broken consolidation and descending wedge border).
If the bulls keep the price from falling even after the news, the coin may continue its medium-term bullish run to 0.4685.
Best regards, R. Linda!
JD 1D: Bulls taking the lead?On the daily chart, JD.com broke out of a falling wedge, moving above both MA50 and MA200. That’s a strong technical signal hinting at a potential mid-term trend reversal.
Upside targets are mapped at $39.8 and $46, with Fibonacci levels suggesting a possible extension toward $52 if momentum holds. Support remains around $33–35, and as long as the price stays above it, buyers are in control.
From a fundamental perspective, JD continues to reshape its business, expand online services, and benefit from China’s economic recovery. Competition with Pinduoduo and Alibaba is tough, but technically bulls seem to have the upper hand.
Tactical outlook: watch the MA200 - staying above it keeps the growth scenario intact.

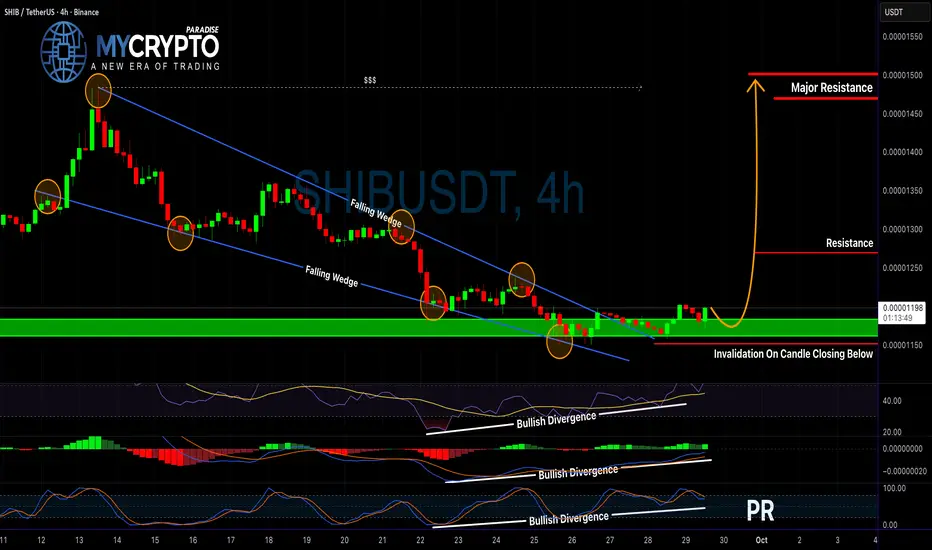
Is SHIB About to Explode or Collapse? Read Before It’s Too LateYello Paradisers! Are you paying attention to SHIB right now? Because this could either be the start of a massive bullish breakout — or the trap that wipes out impatient traders.
💎SHIBUSDT is showing strong potential after breaking out of a falling wedge pattern, which is a classic bullish reversal setup. What makes this move even more convincing is the presence of bullish divergence on the RSI, MACD, and Stochastic RSI — all of which are aligning to support a potential move to the upside.
💎From the current price level, after a proper retest of the support, the setup is still offering a favorable 1:2 risk-to-reward ratio, which is solid for short-term traders.
💎If you’re aiming for even larger risk-to-reward opportunities, you could wait for a more defined retest to enter with tighter risk parameters. However, this comes with the risk of missing the move entirely if the market doesn’t offer that second chance.
💎But here's the key — if the price breaks down and closes below the invalidation level, this entire bullish idea becomes invalid. In that case, it’s much smarter to step back and wait for cleaner price action and a higher-probability setup to form.
💎Discipline always beats impatience.
🎖Strive for consistency, not quick profits. Treat the market as a businessman, not as a gambler. That’s the only way to make it far in your crypto trading journey. Be a PRO.
MyCryptoParadise
iFeel the success🌴
EURCAD Short Trade SetupTrend: Bullish
Divergence: Bearish
Continuation Pattern: None
Reversal Pattern: Falling Wedge
Bias: Bearish
Scenario: Buy Stop at LH and Wedge Break out
Trade Plan
Stop Loss : 1.6396
Entry Level: 1.6321
TP1: 1.6246

EURUSD: Rally to the 1.1805 Zone from Support LineHello everyone, here is my breakdown of the current Euro setup.
Market Analysis
From a broader perspective, the price of EURUSD has been consolidating and building value within a large upward wedge. This pattern is defined by a series of higher lows, forming an ascending support line, which shows that buyers are consistently stepping in at higher prices.
Currently, the price is in a corrective pullback phase. After testing the upper part of the wedge, it is now heading towards the ascending support line for what I see as a critical test of the bullish structure.
My Scenario & Strategy
My scenario is built on the idea that this upward wedge pattern will hold. This pullback to the support line is a classic 'buy the dip' opportunity within the established trend, and a logical place for the correction to end.
I'm looking for the price to complete its correction to the ascending support line. A confirmed bounce from this dynamic support would be the key signal that buyers have absorbed the selling pressure and are ready to initiate the next move higher.
Therefore, the strategy is to watch for this bounce. A successful rebound would validate the long scenario and should lead to a rally that breaks the 1.1780 Resistance. The primary target is the 1.1805 Resistance Zone.
That's the setup I'm tracking. Thank you for your attention, and always manage your risk.

NZDCAD → A false breakthrough will trigger a decline FX:NZDCAD is forming a countertrend correction with the aim of retesting key resistance and the liquidity zone amid a global downtrend.
A reaction to the support zone is forming. The price is recovering, but within the global downtrend. The countertrend movement may end in the resistance zone of 0.811 - 0.8125
The global trend is downward, but we are seeing a rebound within the retest of the channel support. There is a fairly large pool of liquidity ahead, which is capable of stopping the price from rising at a high speed. A false breakout of 0.811 - 0.8125 could trigger a decline.
Resistance levels: 0.811 - 0.8125
Support levels: 0.8056, 0.8030
A false breakout, consolidation below the specified zone, and a price close below the level could trigger a further decline.
Best regards, R. Linda!

AUDCAD: Important Breakout Confirmed 🇦🇺🇨🇦
AUDCAD completed a correctional movement within a bullish flag pattern.
A confirmed violation of its resistance line with a daily candle close above that
suggests a highly probable bullish continuation.
The next strong resistance is 0.925.
It will be the next goal for the buyers.
❤️Please, support my work with like, thank you!❤️
I am part of Trade Nation's Influencer program and receive a monthly fee for using their TradingView charts in my analysis.

NZDJPY → Consolidation amid a downtrend. What next?FX:NZDJPY is ending its correction and returning to the downward trend. The price is consolidating for a possible continuation of the downward movement...
The price breaks the support of the upward channel (countertrend correction). The movement occurs in a “step” format, which generally indicates weak demand. Clear consolidation boundaries are forming on the chart. The global trend is downward, and the local trend has also resumed its downward movement. Focus on two zones: 86.5 - 86.96. Within the framework of trading strategies, a false breakout of resistance or a breakout of support can be considered with the aim of continuing the decline.
Resistance levels: 86.96, 87.16
Support levels: 86.5
As part of consolidation, MM may form a liquidity trap on the resistance side, and a false breakout may trigger a further decline. However, if the bears increase pressure, the formation of a pre-breakdown base relative to the 86.5 support may trigger a breakout and a continuation of the downward movement.
Best regards, R. Linda!

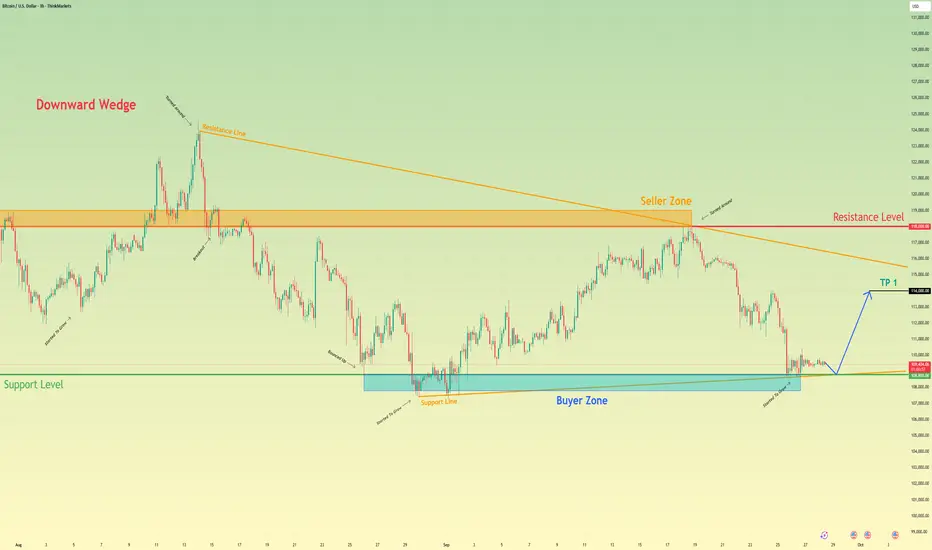
Bitcoin can Bounce from Support and Start to GrowHello traders, I want share with you my opinion about Bitcoin. The price structure has been defined by a complex and volatile consolidation following a prior downtrend. After initially forming a downward wedge, the price action has seen multiple breakouts and reversals, testing both the major 108800 buyer zone and the 118000 seller zone. This prolonged period of indecision has established a solid support base at the 108800 support level. Currently, after a recent sharp drop was absorbed by this support, the price of BTC has started to show signs of a renewed bullish attempt, moving up from the lows. In my mind, this successful test of the major support is the most critical recent event. I expect that the price will first make a final small dip to re-test this 108800 support level to confirm buyer strength. I think a confirmed bounce from this area will lead to a significant rally, as sellers appear to be exhausted. Therefore, I have placed my TP at 114000, targeting a key area of prior price congestion located near the resistance line of the larger wedge structure. Please share this idea with your friends and click Boost 🚀
Disclaimer: As part of ThinkMarkets’ Influencer Program, I am sponsored to share and publish their charts in my analysis.
NZDCHF Long Trade SetupTrend: Bearish
Divergence: Bullish
Continuation Pattern: None
Reversal Pattern: Falling Wedge
Bias: Bullish
Scenario: Buy Stop at LH and Wedge Break out
Trade Plan
Stop Loss:0.4596
Entry Level: 0.4643
TP1: 0.469

nifty50 Analysis | be careful from trapMarket Outlook
Support Zone: 24,550 – 24,400
Resistance Levels: 24,750 – 24,790 and 24,960 – 24,990
A falling wedge pattern is currently forming just above the support zone. The key level to watch is 24,590, as a sweep of this low appears likely. However, before a potential breakdown, price may first retest the immediate resistance area and face rejection, leading back toward the support zone.

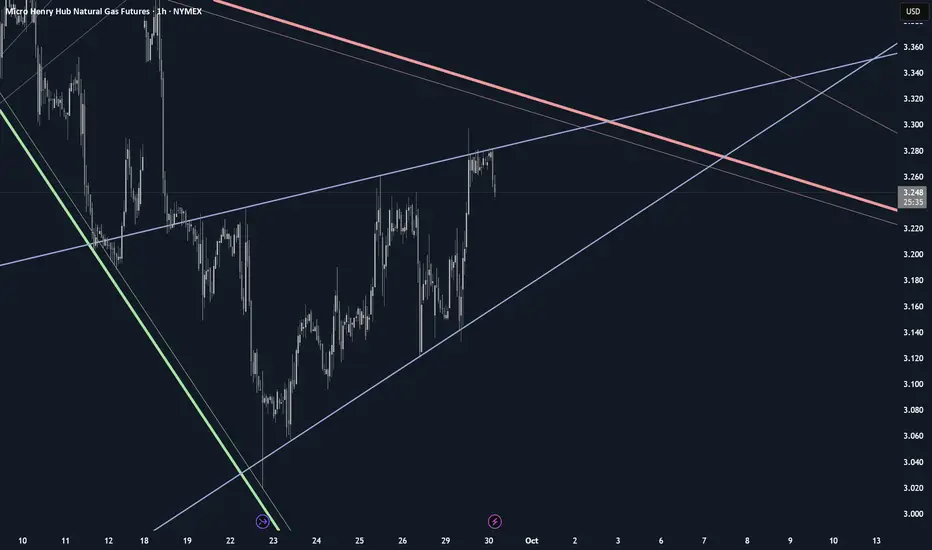
Weakening Natural GasNYMEX:MNG1!
Price is still well within it's high time frame downtrend.
Still within an expanding pattern, Refer to my previous post.
As noted a week ago, the recent rally is reaching exhaustion.
This is made apparent by the recent rising wedge that has formed.
Higher lows are increasing at a faster rate than higher highs.
Measured moved is roughly 5.4% decline from break.