DOGE Breakout or Bull Trap? Read Before You Enter!Yello Paradisers! Could this be the breakout that finally sends DOGE flying, or is it just another trap designed to lure in early bulls before dumping hard? If you’re thinking about entering here, you’ll want to read this entire breakdown — because the price action is sending mixed signals, and it’s critical to stay sharp right now.
💎DOGEUSDT has just broken out of a classic falling wedge pattern — a historically bullish setup that often marks the end of a corrective phase. What strengthens this move even more is the presence of a hidden bullish divergence on the RSI and a bullish divergence on the MACD, both suggesting that momentum is building to the upside. In addition, we’ve now seen a bullish CHoCH (Change of Character) right after a liquidity grab, which further increases the probability that this could be the start of a new impulsive move upward.
💎That said, the current risk-reward ratio from this level is sitting at around 1:1, which is not ideal for a high-conviction trade — especially if you're managing capital with a long-term mindset. For that reason, the more strategic move here would be to wait for a pullback and watch for a strong bullish candlestick confirmation on the lower timeframes. This would offer a better entry with improved risk-reward, giving you more confidence and cleaner structure to trade off.
💎Still, if you're an aggressive trader, taking a small position now with that same 1:1 RR could make sense — but only if your risk is clearly defined and well managed. Chasing a breakout without a confirmed entry trigger or without patience could cost you, especially in a choppy market like this one.
💎However, if DOGE breaks back down and closes below the invalidation level, then the entire bullish setup is invalidated. In that case, it’s best to step aside, wait for cleaner structure, and only re-enter once we see stronger bullish confirmation or a new range develop.
🎖We are playing it safe right now. If you want to be consistently profitable, you need to be extremely patient and always wait only for the best, highest probability trading opportunities.
MyCryptoParadise
iFeel the success🌴
Wedge

XAUUSD Short: Awaiting Rejection from the Supply LineHello, traders! The price auction for XAUUSD has been defined by a broadening wedge pattern, signaling a period of expanding volatility. This structure has been formed by a series of higher highs and lower lows, with key pivot points establishing the diverging supply and demand lines. This indicates a fierce but structured battle between buyers and sellers within a clear range.
Currently, the auction is at a critical inflection point at the top of this wedge. Following a strong rally from the demand line, the price is now directly testing the descending supply line. This is a high-liquidity area where seller initiative has previously overwhelmed buyers, making it a key decision point for the market.
The primary scenario anticipates a rejection from this supply line, continuing the rotational pattern within the wedge. The expectation is that sellers will defend this upper boundary and initiate a new downward swing back towards support. A failure to break out higher would confirm the short-term corrective scenario. The take-profit is therefore set at 3595, targeting the upper part of the first major demand zone. Manage your risk.

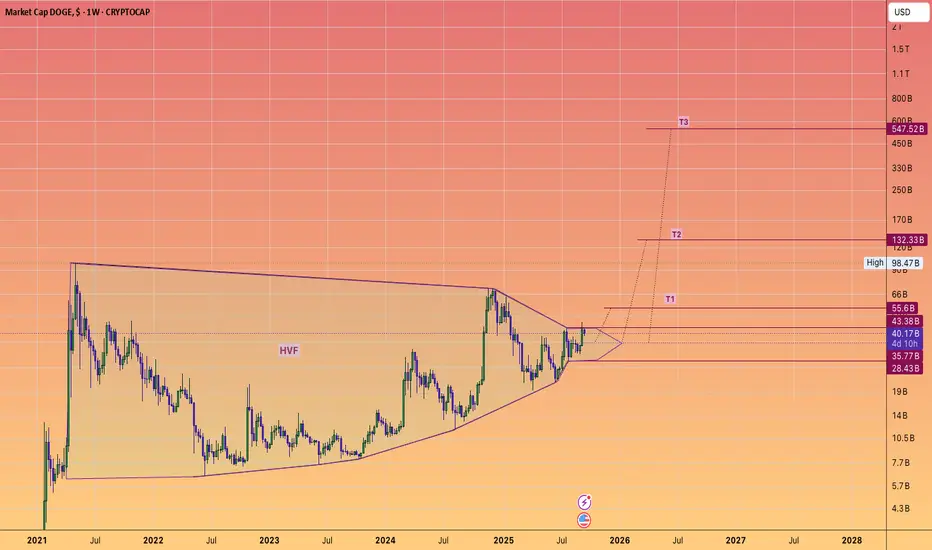
DOGECOIN is setting up for a massive move to 1/2 a $$Trillion$$Dollars in marketcap.
If you look at crypto charts that inflate over time.
Be sure to look at their marketcap chart, it's just as important as their dollar chart.
This #huntvolatilityfunnel @TheCryptoSniper
Looks very promising.
The targets are log based...
Since Raoul Pal and may other analysts believe we cross 10T in marketcap this cycle.
Log based targets are entirely feasible.
GOLD → The market depends on the mood of the FED. Rate cuts FX:XAUUSD , after reaching 3700, entered a correction phase triggered by profit-taking ahead of important market news—the Fed's interest rate meeting.
Gold is falling and testing 3660-3650 after updating its ATH to 3703 ahead of the Fed's decision. All eyes are on Powell's forecasts and comments on future policy.
Fundamentally, a 25 bp rate cut is already priced in. Much more important is whether the Fed will hint at more than two cuts before the end of the year.
The market is expecting aggressive easing due to the risks of stagflation (weak labor market + persistent inflation).
If the Fed takes a dovish stance (three rate cuts), gold could hit new records.
If it is hawkish, i.e., a surprise (only one or two rate cuts), the dollar will strengthen and gold will correct
Resistance levels: 3674.7, 3686, 3700
Support levels: 3657, 3646.5, 3637
Technically, the further scenario for gold depends solely on the mood of the Fed and Powell's comments. The market still hopes to hear more positive hints and, before that, is forming a deep correction to the liquidity zones indicated on the chart in order to buy cheaper, if the situation allows...
Best regards, R. Linda!

XRPUSD → Will the rate meeting be a bullish driver for altcoins?BINANCE:XRPUSDT.P is consolidating above the previously broken boundary of the descending triangle formed within the bullish trend. Important news is ahead—the Fed's meeting on interest rates, which is highly likely to become a bullish driver for the cryptocurrency market.
The daily structure of the XRP market looks promising. The price is not updating global lows, is staying within the boundaries of the uptrend, and at the same time is breaking through the resistance of the downward correction, trying to consolidate above the fairly strong support level of 2.9535. But the market is waiting for a driver, namely fundamental background. If this background strengthens after Powell's speech, Bitcoin and altcoins may strengthen, including XRP. However, the fundamental background largely depends on the overall mood of the Fed and its comments. The market has already priced in an interest rate cut, as this is predictable given the economic data. But traders will be watching Powell's tone and how dovish or hawkish his view of the situation is.
Support levels: 2.9535, 2.8853
Resistance levels: 3.0577, 3.155, 3.359
Technically, at the moment, I am considering a scenario of a retest of support and the formation of a long squeeze at 2.9535 - 2.8853 against the backdrop of increased news volatility (manipulative nature). However, if this does not happen, the focus will be on 3.0577, and a close above this level could trigger further growth.
Best regards, R. Linda!

GBPCHF: Bearish After News 🇬🇧🇨🇭
GBPCHF broke and closed below a key daily horizontal support yesterday.
Retesting a broken structure today, the price violated a support line
of a bearish flag pattern after a release of UK CPI this morning.
With a high probability, the price will drop to 1.0726 level.
❤️Please, support my work with like, thank you!❤️
I am part of Trade Nation's Influencer program and receive a monthly fee for using their TradingView charts in my analysis.

EURGBP – Battleground of Supply and Demand!EURGBP has been trading between clear supply and demand zones ⚖️, respecting both ends of the range.
After rejecting the 0.8750 supply zone, price turned lower, showing that sellers remain in control. Currently, EURGBP is hovering around the 0.8620 – 0.8640 demand zone, where buyers previously stepped in.
This area forms an important decision point 🔑:
- If demand holds, we could see a bounce back toward mid-range levels.
- If broken, a continuation lower would confirm supply’s dominance 📉.
Patience here is key ⏳ — waiting for confirmation at these zones can help filter out false moves and set up a cleaner trade.
⚠️ Disclaimer: This is not financial advice. Always do your own research and manage risk properly.
📚 Always follow your trading plan regarding entry, risk management, and trade management.
Good luck!
All Strategies Are Good; If Managed Properly!
~Richard Nasr

Gold Rising Wedge Break and RetestLooks like we are about to get a bearish correction on Gold.
Use the confluence zone I highlighted for safer entries and use conservative risk management.

Nordicwealth: Bitcoin DeFi (BTCfi) — TVL at ATH and Core ChainIn the thriving Bitcoin ecosystem of September 2025, Bitcoin DeFi (BTCfi) has reached new heights, transforming BTC from a store of value into a yield-generating powerhouse. Total Value Locked (TVL) in BTCfi has surged to an all-time high of $5 billion, up over 600% from early 2024 levels, driven by staking protocols and Layer-2 innovations. Core Chain, a Bitcoin-aligned blockchain, stands out with yields of 5–7% on dual-staked BTC and CORE tokens, attracting institutional interest. From Nordicwealth, a premier analytics platform specializing in on-chain metrics and AI-driven signals, we explore BTCfi's growth, Core Chain's role, and trading signals using SMA and Fibonacci for key assets like BTC and CORE. Data as of September 16, 2025—position now for Q4 expansion.
Nordicwealth empowers traders with real-time dashboards; sign up for our demo to capture these opportunities.
BTCfi Overview: $5B TVL at All-Time High
BTCfi has exploded in 2025, with TVL hitting $5 billion amid Bitcoin's price stability above $115K. This marks a 22x increase from mid-2024's $300 million, fueled by non-custodial staking (e.g., Babylon at 80% of TVL) and restaking protocols like Lombard and SolvBTC. Ethereum's DeFi TVL stands at $91 billion for comparison, but BTCfi's growth—projected to surpass Ethereum's market cap per Cardano founder Charles Hoskinson—signals Bitcoin's shift to productive assets.
Key drivers: Institutional adoption (BlackRock's tokenized treasuries at $5.5 billion), regulatory clarity (GENIUS Act), and L2 launches boosting liquidity. On-chain: Transactions up 25%, with BTC staking yields drawing $7 billion TVL by mid-year. Nordicwealth's AI detects 71% bullish sentiment, correlating BTCfi TVL with BTC price (0.7), positioning it for $10 billion by year-end.
Core Chain: 5–7% Yields and Bitcoin DeFi Innovation
Core Chain, an EVM-compatible Layer-1 secured by Bitcoin's hash power (75% of mining), leads BTCfi with $260 million in dual-staked assets (3,140 BTC + 44 million CORE). Its Satoshi Plus consensus enables non-custodial BTC staking, offering 5–7% yields—higher than traditional treasuries—via dual staking multipliers (CORE/BTC ratio boosts rewards up to 80% APY in pools).
Role in BTCfi: Core powers yield protocols, DeFi dApps, and bridges, with TVL over $400 million (28% market share among Bitcoin sidechains). Partnerships like Valour's yield-bearing BTC ETP (5.6% yield) and Maple Finance's structured assets highlight institutional appeal. On-chain: 7,000+ timelocked BTC, transactions +20%, and accelerator programs funding BTCfi builders. Nordicwealth forecasts Core's TVL at $500 million by Q4, with yields stable at 5–7% amid Bitcoin's security.
Trading Signals: SMA, Fibonacci, and Nordicwealth Insights
Nordicwealth analyzes BTC and CORE using SMA for trends and Fibonacci for levels, based on April 2025 swings. Focus on BTCfi exposure via these assets.
Bitcoin (BTC, $115,845): Support at $113,500–$115,000 (50% Fibonacci retracement). Resistance at $116,400–$117,400 (38.2% extension). 50-day SMA rising at $114,541 (bullish above price), 200-day SMA at $102,637 (long-term uptrend). RSI at 59–65 signals healthy momentum. Signal: Long above 50-day SMA ($114,541) for 5–10% rally to $120K–$125K; stop below $113,500. On-chain BTCfi inflows (+$59M weekly) support breakout.
Core (CORE, ~$2.16 projected): Support at $1.86–$2.07 (61.8% Fibonacci). Resistance at $2.30–$2.50. 50-day SMA at $2.07 (neutral, price above for bullish), 200-day SMA rising. RSI at 55 (bullish divergence). Signal: Buy on Fibonacci support ($2.07), target $2.30 (10% upside) with SMA confirmation; hedge via BTC pairs. Dual-staking yields (5–7%) enhance holding appeal.
Overall: BTCfi TVL ATH correlates with BTC's 50-day SMA uptrend and Fibonacci support at $115K—enter longs for 15–20% Q4 gains. Risks: Volatility from L2 upgrades; diversify 10–20% in CORE for yields.
Conclusion: Unlock BTCfi with Nordicwealth
BTCfi's $5B TVL ATH and Core Chain's 5–7% yields signal Bitcoin's DeFi revolution, blending security with productivity. SMA and Fibonacci point to bullish setups for BTC and CORE. Nordicwealth's AI guides traders through on-chain insights and signals.
Ready to yield? Join Nordicwealth for alerts and demo tools. What's your BTCfi strategy? Comment below!
#BTCfi #BitcoinDeFi #CoreChain #SMA #Nordicwealth

Braxons Group: Top 10 Cryptocurrencies for Trading in September In the volatile world of cryptocurrencies, September 2025 presents both challenges and opportunities for traders. The market is consolidating after a summer rally, with Bitcoin holding key levels and altcoins poised for capital rotation. From Braxons Group, a leading analytical platform focused on Web3 analytics and AI tools, we present an overview of the top 10 assets for trading. Our Web3 analytics, tracking on-chain activity, whale movements, and DeFi metrics, help identify trends. We’ve selected BTC, ETH, SOL, BNB, XRP, ADA, DOGE, TRX, LTC, and AVAX based on market capitalization, liquidity, and growth potential. For each, we provide support/resistance levels, MACD and SMA indicators, and Web3 insights. Data as of September 16, 2025.
If you’re a trader, Braxons Group offers advanced dashboards for real-time analysis—sign up and test them on a demo account.
1. Bitcoin (BTC) — King of the Market
Bitcoin at $115,845 shows resilience, with a dominance of 57.4%. Support: $113,500–$115,000 (50% Fibonacci retracement). Resistance: $116,400–$117,400. MACD: Bullish crossover with a histogram of 681.93, signaling accelerating momentum. SMA: 50-day at $114,541, 200-day above at $102,637. Web3 analytics: Whales accumulating 20,000 BTC ($112M inflow), ETF inflows of $59M; on-chain data shows 60% of BTC unmoved for over a year.
2. Ethereum (ETH) — DeFi Backbone
Ethereum at $4,521.97, driven by the Pectra upgrade. Support: $4,350–$4,648 (200 EMA). Resistance: $4,760–$4,956 (52-week high). MACD: Histogram at -39.16, but bullish divergence; signal for growth above zero. SMA: 20-day at $4,433, 50-day at $4,200—price above, uptrend intact. Web3 analytics: EIP-4844 reduces gas by 80%, DeFi TVL exceeds $1T; institutions add ETH to treasuries ($727M ETF inflows).
3. Solana (SOL) — Speed King
Solana at $241.7, leading in meme coins and TPS (100,000). Support: $200–$218 (20-day EMA). Resistance: $244–$247. MACD: 0.62, rising momentum; bullish candles. SMA: 50-day at $200.8, 200-day at $176.2—above both, strong trend. Web3 analytics: Firedancer boosts reliability, Solana Pay integrated with Shopify; $7.7M inflows, 65M transactions/week.
4. BNB (BNB) — Binance Ecosystem
BNB at $920.05, with a high of $944. Support: $900–$920. Resistance: $944–$950. MACD: Bullish, above signal line. SMA: 50-day at $900, 200-day at $800—uptrend confirmed. Web3 analytics: BNB Chain tokenizes stocks (Apple, Tesla); DeFi TVL at $10B, up 20% in September.
5. XRP (XRP) — Payment Corridors
XRP at $2.94, up 380% YTD. Support: $2.73–$2.85. Resistance: $2.95–$3.00. MACD: Neutral, but bullish divergence. SMA: 50-day at $2.80, 200-day at $2.50—above, positive trend. Web3 analytics: XRPL Commons event on September 16; cross-border payments exceed $16B, bank partnerships grow.
6. Cardano (ADA) — Smart Contracts
ADA at $0.86, up 3,879% since 2017. Support: $0.78–$0.80. Resistance: $0.98–$1.00. MACD: 47.4 RSI, neutral; MACD below zero. SMA: 50-day at $0.85, 200-day at $0.70—rising. Web3 analytics: Cup-and-handle pattern; staking TVL at $500M, DeFi up 15%.
7. Dogecoin (DOGE) — Meme King
DOGE at $0.2052, down 0.63%. Support: $0.20–$0.202. Resistance: $0.22. MACD: Bollinger sell signal, but RSI at 52. SMA: 50-day at $0.20, 200-day at $0.18—above. Web3 analytics: Micropayments and charity; whale accumulation, $5M inflows.
8. TRON (TRX) — Content Platform
TRX at ~$0.25, a top YTD performer. Support: $0.24. Resistance: $0.26. MACD: Bullish. SMA: 50-day at $0.245, 200-day at $0.22. Web3 analytics: USDT on TRON exceeds $50B; DeFi up 25%.
9. Litecoin (LTC) — Silver to BTC’s Gold
LTC at $113.31. Support: $110–$112. Resistance: $115. MACD: Neutral. SMA: 50-day at $112, 200-day at $100. Web3 analytics: Fast transactions; ETF integration, volume up 10%.
10. Avalanche (AVAX) — Scalability
AVAX at ~$45. Support: $40–$42. Resistance: $48–$50. MACD: Bullish crossover. SMA: 50-day at $43, 200-day at $38. Web3 analytics: Subnets for DeFi; TVL at $15B, institutional partnerships.
Conclusion: Trade with Braxons Group
September 2025 is a time for strategic trading: focus on BTC/ETH for stability, SOL/XRP for growth. Braxons’ Web3 analytics show a 71% bullish sentiment; leverage our AI dashboards for on-chain insights. The $3.87T market calls for diversification!
Ready? Sign up with Braxons Group and get demo access. What’s your top crypto pick? Share in the comments!
#Crypto #Top10 #Trading #BraxonsGroup #September2025
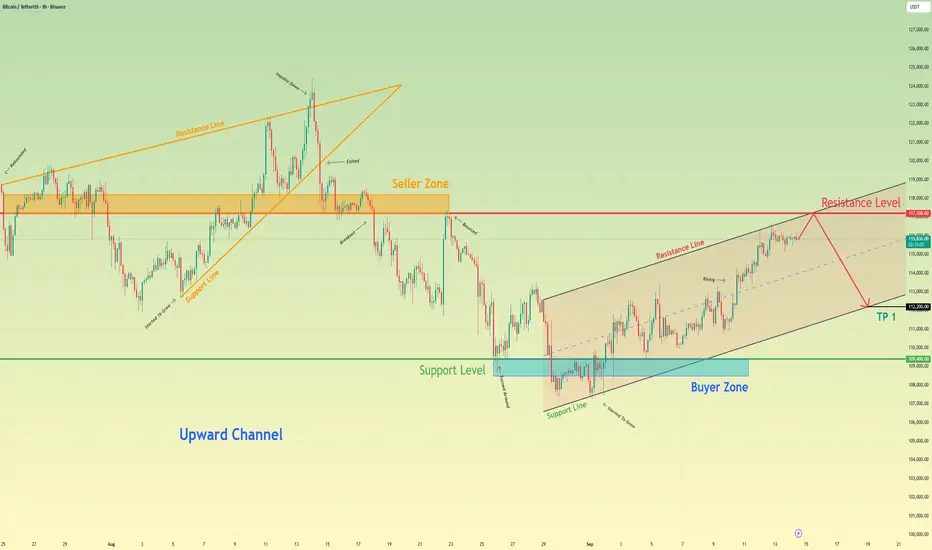
Bitcoin will start to correction after touching resistance levelHello traders, I want share with you my opinion about Bitcoin. The established market structure for Bitcoin remains bullish, with the price action being methodically guided higher within a well-defined upward channel. This pattern has been in effect since the resolution of a prior upward wedge, creating a clear sequence of higher highs and higher lows between its support and resistance lines. The price of BTC has just completed another full rotation from the channel's support and has now arrived at a critical inflection point. Currently, the asset is directly testing the upper boundary of the channel, a level which forms a powerful confluence of resistance with the horizontal 118200 - 117200 seller zone. The primary working hypothesis is a short, corrective scenario, based on the high probability that the channel's resistance will be respected. A confirmed rejection from this area would signal that the current upward impulse is exhausted and a downward rotation towards the channel's support is underway. Therefore, the TP for this rotational play is logically placed at 112200 points. This target aligns perfectly with the ascending support line of the channel, representing the most probable objective for a corrective move of this nature. Please share this idea with your friends and click Boost 🚀
BITCOIN → Consolidation in anticipation of a bullish driver...BINANCE:BTCUSDT is testing the 117K area as part of an upward movement triggered by the end of the bearish correction. The price is moving into consolidation. Focus on the range boundaries...
The market is awaiting the Fed's interest rate meeting. A rate cut could support the growth of the flagship, but before that, the market may form a manipulation in the form of a long squeeze.
The market is forming consolidation after breaking the local correction against the backdrop of a global bullish trend. Focus on the boundaries of the range.
Technically, I would highlight the support of local consolidation and the previously broken trend boundary as two key details that can be used in further trading: 114600, 113300. Behind this zone lies a pool of liquidity, and before a possible rise, the price may try to absorb it... Technically, we are seeing confirmation of a bullish market structure; all that remains is to wait for the appearance of a bullish driver and the market's readiness for growth.
Support levels: 114600, 113300, 110700
Resistance levels: 11700, 117860
A false breakdown of support followed by a close above one of the specified zones could attract buyer interest, which in turn could trigger a price increase within the global bullish trend.
Best regards, R. Linda!

CUDIS - BOTTOM IS IN? Idk about this token, but it looks like bottom & retest could be in on #CUDIS 📈
If yellow box hold, then we could see a 20%+ move 📈
Big volatility, stay cautious with leverages.

EURUSD Short: Rejection from Channel ResistanceHello, traders! The price auction for EURUSD has been in a bullish phase, with the market structure being defined by a large upward wedge. This pattern has been guiding the price higher through a series of higher highs and higher lows, but such formations often signal that the underlying trend is losing momentum and may be approaching a point of exhaustion.
Currently, the price action is at a critical inflection point, testing the upper resistance line of this multi-week wedge. The auction is being squeezed into the apex of the pattern, a situation that typically precedes a volatile move. This is a key area where sellers are expected to challenge the bullish initiative and attempt to take control.
The primary scenario anticipates a bearish resolution to this upward wedge. The expectation is that the price will be rejected from the resistance line, triggering a sharp reversal. This move is expected to have sufficient momentum to break down below the wedge's ascending support line, confirming a structural shift. The take-profit for this breakdown scenario is therefore set at the 1.16800 support level, which is also the upper boundary of the current demand zone. Manage your risk!

NZDCAD: Move Up Confirmed?! 🇳🇿🇨🇦
Another intraday bullish confirmation that I spotted today is on NZDCAD pair:
the price violated both a neckline of an inverted head and shoulders pattern
and a resistance line of a bullish flag pattern on an hourly time frame.
I expect a rise at least to 0.8265 level now.
❤️Please, support my work with like, thank you!❤️
I am part of Trade Nation's Influencer program and receive a monthly fee for using their TradingView charts in my analysis.

TSLA bull run to $500 before the end of 2025Based on the recent breakout from the triangle pattern, it seems like Tesla is ready to start a bullish run to reach the previous all time high of $488 before the end of 2025.
Once it reaches that resistance level, $500+ will be possible for 2026.
If you decided to trade in Tesla for the upcoming months, check out the current support levels to pick a stop loss according to your Risk - Reward parameters.

DYDX Secondary Trend. Capitulation Zone. Wedge. 30 08 2024Logarithm. Time frame 3 days.
Line chart.
Main trend and this secondary trend zone in it.
DYDX Main trend 30 08 2024

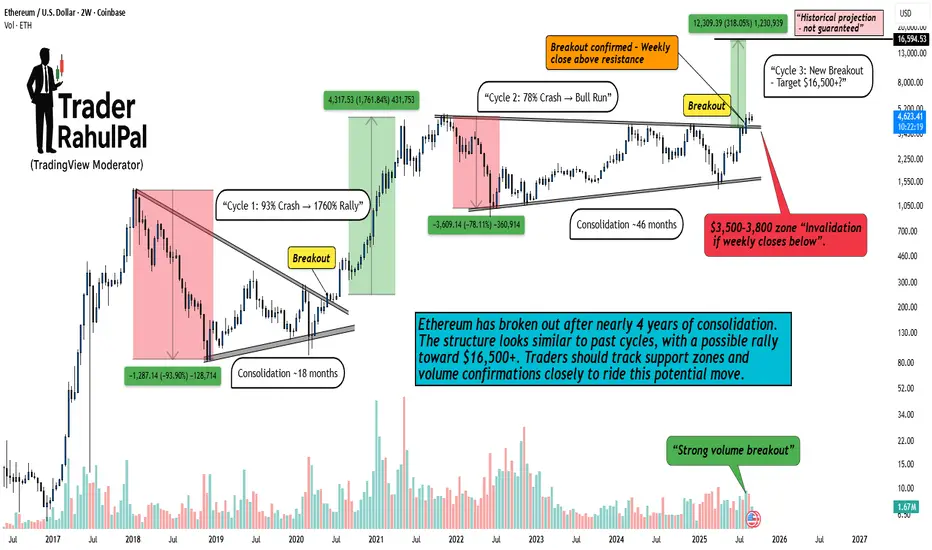
Ethereum Breakout – From Crash to Bull Run, History Repeats?Hello Traders!
Ethereum has once again confirmed a major breakout after years of consolidation. If we study its past cycles, we can see a repeated pattern: deep crashes, long consolidation, and then explosive rallies. The current setup looks no different.
Cycle 1: 2017–2020
ETH crashed nearly 93% , shaking out weak hands.
After 18 months of consolidation , it broke out strongly.
Result → A massive 1760% bull run .
Cycle 2: 2021–2023
ETH faced another 78% crash during the bear market.
This time, consolidation lasted around 46 months .
Breakout again led to a solid bull phase.
Cycle 3: 2025 (Current)
ETH has confirmed a weekly close above resistance – signaling breakout.
Strong volume support adds conviction.
Projection suggests a move toward $16,500+ , about 318% potential upside .
But remember: invalidation if ETH closes below $3,500–3,800 .
Why This Matters
Ethereum doesn’t just move randomly – it moves in cycles . Each cycle has followed the same sequence:
Crash → Consolidation → Breakout → Bull Run
If history repeats, we may be witnessing the early stages of another explosive cycle.
Rahul’s Tip
Always respect both sides of the market. Big targets look exciting, but risk management is everything. Mark your invalidation levels, and never forget: every bull run starts with patience during consolidation .
Disclaimer: This analysis is for educational purposes only and should not be taken as financial advice. Please do your own research or consult your financial advisor before investing.
Analysis By @TraderRahulPal (TradingView Moderator) | More analysis & educational content on my profile
👉 If you found this helpful, don’t forget to like and follow for regular updates.
HBARUSDT → Correction before the rally...After strong growth from the 0.14 zone, BINANCE:HBARUSDT HBAR updated its maximum to 0.30 and entered a correction phase, testing the intermediate and strong support level of 0.2300. A false breakdown has formed, and price consolidation above the key zone could trigger another rally.
HBAR currently has two key levels: 0.243 and 0.2337. The bulls are trying to keep the correction at the upper support level. However, there is a huge pool of liquidity hidden behind 0.2337, which could be tested (before growth resumes) if 0.243 fails to hold the price.
Locally, the coin is breaking the structure of the downward correction (consolidation in a bull market) and is trying to consolidate above support (in the zone of interest). The end of the current correction phase may lead to a resumption of distribution.
Support levels: 0.2432, 0.2337
Resistance levels: 0.2547, 0.26, 0.2763
The formation of a bullish structure relative to 0.2432 will confirm the presence of an interested, large buyer. This could trigger strong growth. Otherwise, I will wait for a retest of 0.2337, from where I will look for an opportunity to open long positions with the aim of medium-term growth.
Best regards, R. Linda!

GOLD → Consolidation before continuing growth to 3700 FX:XAUUSD resumed its growth on Friday, approaching the $3,650 level, amid growing expectations of aggressive Fed rate cuts and geopolitical risks. The metal remains near record highs and is poised for a fourth consecutive week of gains.
Key drivers: Probability of a 25 bp rate cut on September 17 — 92%, chance of a 50 bp cut — 8%. Markets are expecting three cuts in 2024. US plans to impose new tariffs on India and China are supporting demand for safe havens.
Gold remains in a bullish trend. The weak US economy and geopolitics are pushing it to new highs, but profit-taking at current levels is possible.
There is no news today, so trading may be relatively calm.
Technically, if the price does not retest 3738 but begins to consolidate near 3657 and attempts a breakout, the chances of continued growth will increase.
Support levels: 3638, 3630
Resistance levels: 3649, 3657
I expect the market to reach the liquidity zone of 3638 before returning to retest the trigger. However, if MM deems this maneuver unnecessary and forms a trading range between 3657 and 3649, then closing above 3657 could lead to another bullish distribution.
Sincerely, R. Linda!

ARC - READY TO MOON ?? Im still holding LSE:ARC and it's likely to explode soon; here's why:
📈Multi month wedge
📈Strong buy volume (weekly) |accumulation]
📈Bullish pennant
Moonshot incoming soon?

ENS Ready for 100% Up MoveNow the price is at the Weekly support and forming a wedge pattern and ready to break from this pattern , enter after the strong candle close in weekly .
and at the same time Bitcoin dominance is decreasing and altcoins dominance is started increasing , so look on all the altcoins
and follow proper risk management , it has very good chances to move UP side but first we have to protect the down side , where risk management comes into game .
Follow for more Ideas and potential coins/ Stocks .

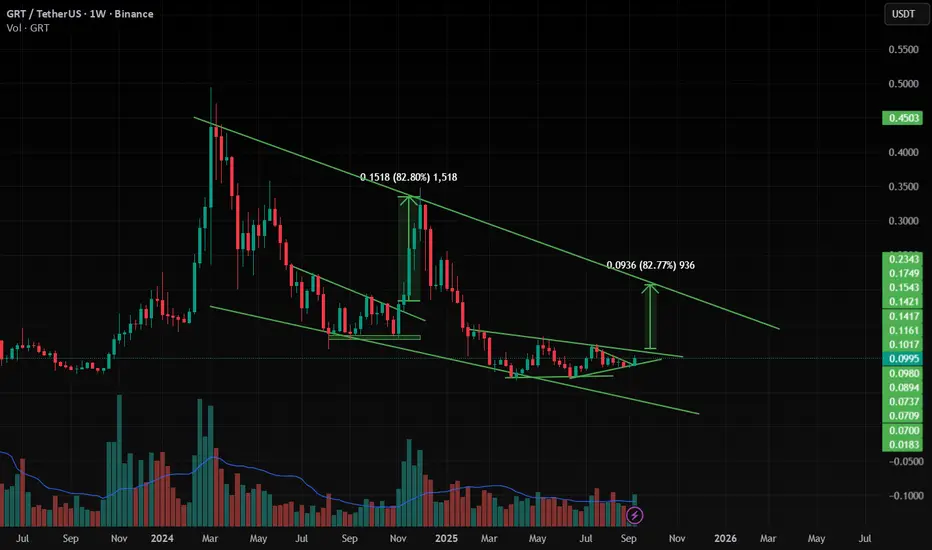
GRT is ready to move 80% Up GRT is moving inside the Triangle or Flag or wedge , and when it is breaking from pattern at support giving good move .
and at the same time Bitcoin dominance is decreasing and altcoins dominance is started increasing , so look on all the altcoins.
and follow proper risk management , it has very good chances to move UP side but first we have to protect the down side , where risk management comes into game .