Price-Action Analysis (Gold – Daily Chart)Price-Action Analysis (Gold – Daily Chart)
1. Rising Wedge Structure
The chart highlights a rising wedge, where price is moving higher but the slope of the highs and lows is converging.
This shows that although price is advancing, the momentum is slowing because each new high is made with decreasing strength.
The wedge boundaries show price repeatedly touching both the upper and lower trendlines.
2. Recent Price Behavior
Price moved from the lower wedge boundary upward and recently touched the resistance area near the upper boundary.
After this touch, the latest candle shows a pullback, indicating a pause in upward momentum.
This is consistent with price meeting the top of a tightening structure.
3. Interaction With EMAs
Price has been trading above the EMA 7, EMA 9, and EMA 21, reflecting short-term upward pressure.
The EMA 50 lies further below and has acted as a secondary dynamic support in earlier phases of the chart.
The clustering of EMAs under price indicates a generally constructive short-term trend.
4. Possible Breakdown Area (Structure-Based)
The dotted vertical measurement displayed on the chart illustrates the height of the wedge.
This height is often used to project a distance, not as a signal, but simply to visualize how the pattern size compares with nearby price areas.
The green “Target” box reflects this projected measurement placed below the wedge’s lower boundary, representing a hypothetical zone based solely on the wedge’s size.
5. Volume Context
Volume appears higher during strong downward candles earlier in the chart, then stabilizes during the wedge.
This fits a common observation where momentum can slow as patterns tighten.
📌 Summary (Neutral & Descriptive)
Gold has been moving inside a rising wedge, showing higher highs and higher lows within a narrowing structure. Recently, price touched the upper boundary of the wedge and showed a mild pullback, indicating reduced momentum at that level. Price remains above several EMAs, reflecting ongoing short-term strength, while the pattern itself shows compression. A measured-move projection is drawn underneath the wedge to illustrate how its height compares with lower price zones if the structure were to resolve downward.
Wedge

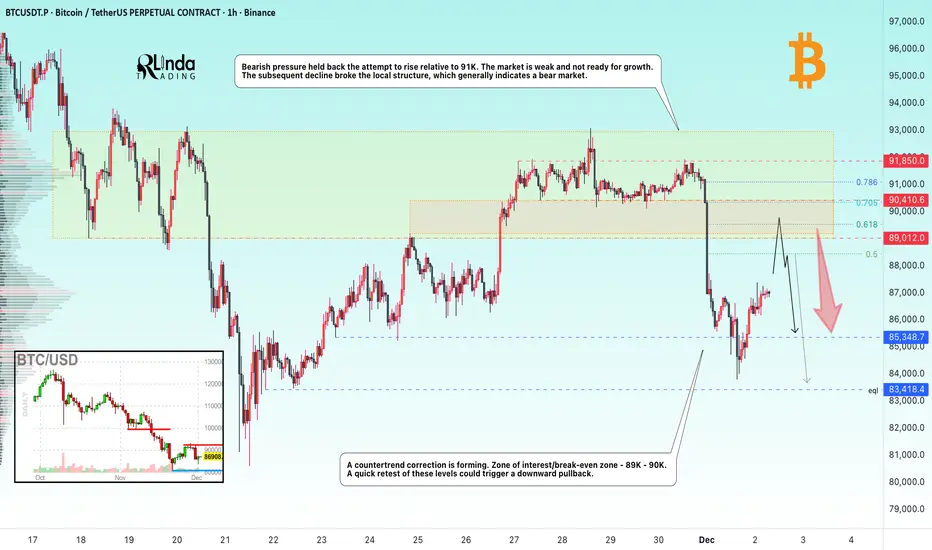
BITCOIN → The hunt for liquidity before the fallBINANCE:BTCUSDT.P continues to update lows within the global downtrend. The retest of 91K confirmed the dominance of bears...
The downtrend continues. The technical and fundamental situation for the crypto market is neutral to weak.
Bearish pressure held back the attempt to rise relative to 91K. The market is weak and not ready for growth. The subsequent decline broke the local structure, which generally indicates a bear market, but after updating the local minimum to 83700, a countertrend correction is forming. Zone of interest/break-even zone - 89K - 90K. A quick retest of these levels could trigger a downward pullback.
Resistance levels: 89K, 90K
Support levels: 85,400, 83,400
A retest of the range boundary and zone of interest could trigger a liquidity squeeze and a further decline if the bears keep the price below these boundaries.
Best regards, R. Linda!
Overextended – Retest Possible in Bank of BarodaBank of Baroda has moved far from its breakout zone and is showing signs of exhaustion.
If price cools off, the earlier trendline could act as a retest area.
Disclaimer: This chart uses older than 3 months data for educational purposes only.
Not investment advice.

USDCHFDivergence ,falling wedge formation and trend line break confirms reversal of trend. DXY break the major consolidation box and in bearish mode.

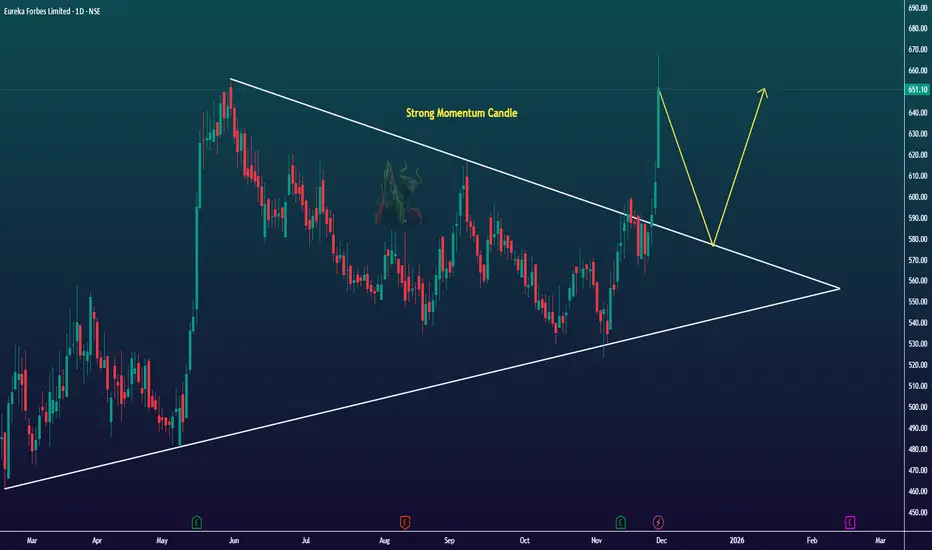
Momentum Shift Detected in EUREKAFORBNSE:EUREKAFORB shows a strong momentum candle on the daily chart after weeks of choppy structure. Price is pushing into a higher zone.
momentum is clear, but structure is still broad. Watching how it behaves in the next few sessions.
BTCUSD (2H) – Elliott Wave Completion + Breakout SetupBITSTAMP:BTCUSD
Bitcoin has completed a clear 5-wave corrective structure, currently consolidating near a demand zone after sweeping liquidity around $87,300.
Price is now attempting to break short-term structure, forming a potential reversal setup. A confirmed breakout above the $89,800–$90,300 resistance zone may trigger a bullish continuation toward the descending trendline and mid-range level.
Key Scenarios
✅ Bullish Case 🚀
Break & hold above $90,300
→ 🎯 Target 1: $95,800
→ 🎯 Target 2: $105,100 (Extended target if trendline breaks)
📌 Entry Zone: $88,500–$90,300
📌 Stop Loss: $83,900
❌ Invalidation:
A strong break below $83,900 confirms bearish continuation toward the lower demand at $80,500.
Levels to Watch
Support: $87,300 / $83,900
Resistance: $90,300 / $95,800 / $105,100
⚠️ This chart is for educational purposes only. Not financial advice.

AUD/USD eyes wedge breakoutAUD/USD starts the new month testing downtrend resistance dating back to the highs set on September 17. Coiling within a falling wedge, convention suggests a bullish breakout could see the pair retest .6700.
Should we see a clean break above the downtrend, longs could be established above the level with a stop beneath for protection. Given the first attempt in holiday-thinned trade last Friday failed, some may prefer to wait for a close above the trendline before considering the trade.
The November high of .6580 looms as the first topside test, although there’s no meaningful resistance until .6625, where price was capped for lengthy periods earlier in the year. If that level breaks, only minor resistance at .6660 stands between a retest of the September highs above .6700.
The momentum picture remains mixed but is quickly shifting in favour of bullish setups, with RSI (14) now pushing higher above 50 while MACD has crossed the signal line from below and is moving quickly towards positive territory. Should these trends persist, it would favour bullish setups over shorts, increasing the appeal of the trade if a breakout occurs.
Good luck!
DS

Selena | ETHUSD 1H – Bullish Continuation SetupCOINBASE:ETHUSD
The recent rejection from the upper trendline created short-term corrective movement. Liquidity sweeps below minor support hint at accumulation, and as long as price remains above the invalid zone at 2899, bullish momentum is favored. Holding demand could fuel another expansion toward the next resistance block.
Key Scenarios
✅ Bullish Case 🚀
Hold above Demand Zone (≈ 2990–3020) →
→ 🎯 Target 1: 3110
→ 🎯 Target 2: 3180
→ 🎯 Target 3: 3220 (Top Resistance)
❌ Bearish Breakdown 📉
Break below 2899 invalidation zone
→ Potential retracement toward 2755 – strong support zone
→ Deeper demand sits near 2621 if structure fully collapses.
Current Levels to Watch
Resistance 🔴: 3110 | 3180 | 3220
Support 🟢: 3020 | 2899 | 2755
⚠️ Disclaimer: Educational analysis only. Not financial advice.

GRASIM – Price Compressing Toward Major Trendline SupportPrice is getting squeezed between a falling trendline and a rising support. This type of compression usually ends with a strong move. A clean descending trendline from the recent swing-high shows short-term selling pressure. A major rising trendline from the bottom still holds the structure.
Price is drifting towards the intersection zone of both trendlines. If price taps the rising trendline and holds, a bounce + trendline breakout is possible.
Save this setup — this zone decides the next trend.

Selena | USDJPY 1H — Breakout Retest Setup | Bullish FX:USDJPY
Market Overview
A liquidity sweep occurred above previous range highs, followed by corrective price action. If price holds the entry zone and breaks the descending trendline with strength, bullish momentum may continue toward higher liquidity zones.
Key Scenarios
✅ Bullish Case 🚀
If price respects the rising support and breaks above 156.60–156.80:
🎯 Target 1: 157.30
🎯 Target 2: 157.85 (liquidity sweep zone)
❌ Bearish Case 📉
A clean break below 155.80 invalidates bullish setup and may target lower demand.
Current Levels to Watch
Entry Zone: 155.90–156.20
Breakout Confirmation: Above 156.60
Target Zone: 157.30–157.90
⚠️ Disclaimer: This analysis is for educational purposes only. Not financial advice.

EURAUD: Bearish Outlook Explained 🇪🇺🇦🇺
There is a high chance that EURAUD will continue falling next week.
A bearish breakout of a support line of a rising wedge pattern
suggests a strong bearish sentiment.
Expect a fall at least to 1.765
❤️Please, support my work with like, thank you!❤️
I am part of Trade Nation's Influencer program and receive a monthly fee for using their TradingView charts in my analysis.

JKCEMENT – Coiled inside a big wedgeMarkets rarely explode without building tension — this wedge might be that tension.
JK cement's long-term support zone broadly intact, but short/medium-term trend has seen pressure. Recent weeks show lower highs , forming a downward sloping upper trendline. But there's a wider, long-term rising trendline at the bottom — forming a potential large contracting triangle / wedge-like structure on daily chart (as I marked).
So, we are in a coil / compression phase. Price consolidating inside a wedge/triangle after prior swing down, while long-term support holds. That means either breakout or breakdown — but with risk-reward skewed toward bounce if support and structure hold.
If price breaks above upper trendline with volume, upside could target previous swing highs. But if it breaks below support — risk of deeper correction exists.
Save this chart. Wedges crack. This one might too.
Best regards,
Alpha Trading Station

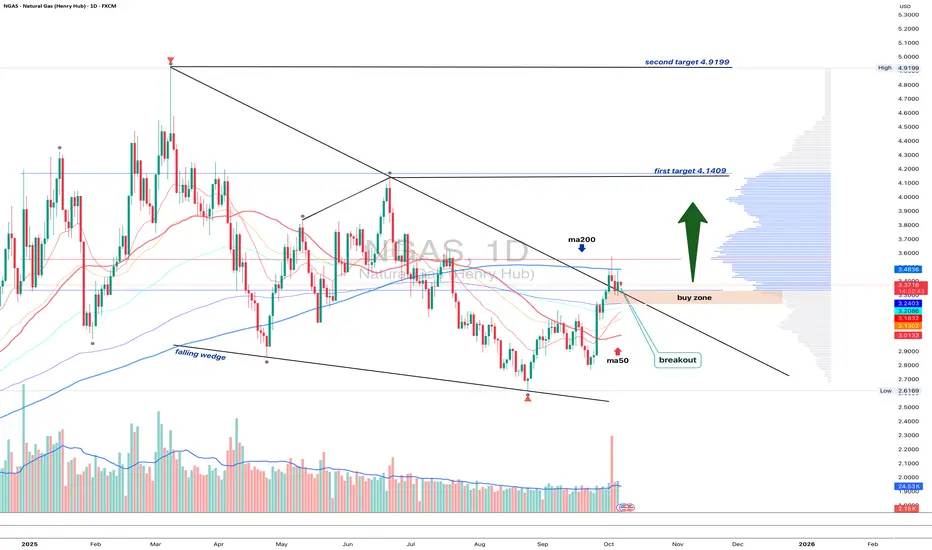
NGAS 1D - bulls waiting for the green lightOn the daily chart, Natural Gas has broken out of a falling wedge, but price remains below the MA200, while EMA still hovers above it - a mixed signal showing short-term hesitation within a longer-term downtrend.
The 3.10–3.20 buy zone remains key - that’s where the retest area aligns with short-term support. If buyers can reclaim the EMA and push above the MA200, the next upside targets are 4.14 and then 4.92.
Volume on the breakout supports growing bullish interest, while fundamentals - like rising seasonal demand - may soon add more fuel to the move.
Tactically , watch how price behaves near MA200. Once EMA flips back on top, momentum could accelerate fast. Until then, the market’s like a gas burner waiting for that click - ignition pending
Elise : XAUUSD 2H — Breakout Retest Accumulation Setup |OANDA:XAUUSD
Key Scenarios
✅ Bullish Case (Primary)
A confirmed break and hold above 4135–4150 supply opens the door for bullish continuation toward:
🎯 Target 1: 4281
🎯 Target 2: 4374 (extended trendline & previous rejection zone)
Bullish structure remains valid above 4035.
❌ Bearish Case (Invalidation)
A clean close below the demand zone 4030–4000 would signal weakness, potentially sending price toward:
Current Levels to Watch
Demand Zone: 4035–4060
Supply / Breakout Zone: 4135–4150
Extended Resistance: 4281 / 4374
⚠️ Disclaimer:
This analysis is for educational purposes only — not financial advice. Always manage risk.

#BCHBTC #1W (Binance) Big falling wedge breakoutCRYPTOCAP:BCH just regained 50MA weekly support in sats, performing better than CRYPTOCAP:BTC
Seems likely to continue bullish towards 200MA resistance, probably after a pull-back.
⚡️⚡️ #BCH/BTC ⚡️⚡️
Exchanges: Binance
Signal Type: Regular (Long)
Amount: 7.0%
Current Price:
0.004885
Entry Targets:
1) 0.004657
Take-Profit Targets:
1) 0.006329
Stop Targets:
1) 0.003987
Published By: @Zblaba
CRYPTOCAP:BCH BINANCE:BCHBTC #BitcoinCash #PoW bitcoincash.org
Risk/Reward= 1:2.5
Expected Profit= +35.9%
Possible Loss= -14.4%
Estimated Gaintime= 4-7 months

Falling Wedge on the 2H Timeframe: Is a Bullish Breakout BrewingHey TradingView community,
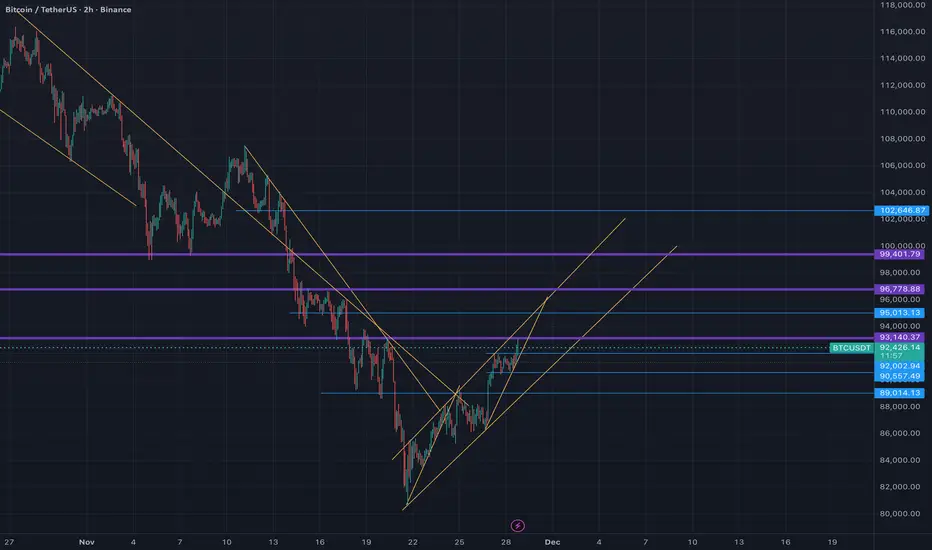
I’ve been closely monitoring Bitcoin’s price action amid this volatile November, and the 2H chart is painting an intriguing picture. After a sharp correction from October’s all-time highs above $126,000, BTC has been grinding lower, but it’s now forming a classic falling wedge pattern – a setup that’s often a precursor to bullish reversals in downtrends.    Check out my screenshot below for the details.
Key Observations from the Chart:
• The Pattern: We’ve got a descending resistance line connecting the lower highs since mid-November, paired with an ascending support line from the recent lows around $88,000-$90,000. This compression is typical of a falling wedge, where selling pressure diminishes, setting the stage for an upside breakout. If it holds, we could see a snap higher, similar to how these patterns resolved in past cycles.  
• Support and Resistance Levels:
• Strong support cluster at $92,000-$92,500 (current price action bouncing here) and lower at $89,000-$90,000, which has acted as a demand zone multiple times this month. 
• Overhead resistance at $96,000-$97,000 (prior highs), with a breakout potentially targeting $100,000-$104,000 based on the wedge’s measured move. On the flip side, a breakdown below $89,000 could open the door to $80,000 or even lower, as some analysts warn of deeper corrections.   
• Momentum Indicators: Volume appears to be drying up in the wedge, which is bullish, and RSI is hovering near oversold levels (around 30-40 on higher TFs), hinting at a potential rebound. No major divergences yet, but watch for one on the next leg down.
Market Context:
November 2025 has been a bloodbath for Bitcoin, with a 33% drop from peaks amid overleveraged longs getting flushed and broader macro pressures.  However, on-chain data shows accumulation by whales, and BlackRock’s ETF flows are turning positive again, suggesting the selling might be exhausting.  Sentiment is numb – perfect for a contrarian setup. Interestingly, ETH/BTC is also breaking out of its own multi-month wedge, which could signal altcoin strength if BTC stabilizes.  
Trading Idea:
• Bullish Scenario: Long on a confirmed breakout above the upper trendline (~$94,000) with stops below $92,000. Targets: $97,000 (short-term), $105,000+ (extended). 
• Bearish Scenario: If support cracks, short toward $85,000-$88,000, but I’d wait for confirmation to avoid whipsaws.
• Risk Management: Always use 1-2% risk per trade. Volatility is high, so position size accordingly. This isn’t financial advice – DYOR!
What do you think, bulls or bears in control? Drop your thoughts below. Let’s discuss!
#BTC #Bitcoin #Crypto #TechnicalAnalysis #FallingWedge #Trading

Falling Wedge on the 2H Timeframe: Is a Bullish Breakout BrewingHey TradingView community,
I’ve been closely monitoring Bitcoin’s price action amid this volatile November, and the 2H chart is painting an intriguing picture. After a sharp correction from October’s all-time highs above $126,000, BTC has been grinding lower, but it’s now forming a classic falling wedge pattern – a setup that’s often a precursor to bullish reversals in downtrends.    Check out my screenshot below for the details.
Key Observations from the Chart:
• The Pattern: We’ve got a descending resistance line connecting the lower highs since mid-November, paired with an ascending support line from the recent lows around $88,000-$90,000. This compression is typical of a falling wedge, where selling pressure diminishes, setting the stage for an upside breakout. If it holds, we could see a snap higher, similar to how these patterns resolved in past cycles.  
• Support and Resistance Levels:
• Strong support cluster at $92,000-$92,500 (current price action bouncing here) and lower at $89,000-$90,000, which has acted as a demand zone multiple times this month. 
• Overhead resistance at $96,000-$97,000 (prior highs), with a breakout potentially targeting $100,000-$104,000 based on the wedge’s measured move. On the flip side, a breakdown below $89,000 could open the door to $80,000 or even lower, as some analysts warn of deeper corrections.   
• Momentum Indicators: Volume appears to be drying up in the wedge, which is bullish, and RSI is hovering near oversold levels (around 30-40 on higher TFs), hinting at a potential rebound. No major divergences yet, but watch for one on the next leg down.
Market Context:
November 2025 has been a bloodbath for Bitcoin, with a 33% drop from peaks amid overleveraged longs getting flushed and broader macro pressures.  However, on-chain data shows accumulation by whales, and BlackRock’s ETF flows are turning positive again, suggesting the selling might be exhausting.  Sentiment is numb – perfect for a contrarian setup. Interestingly, ETH/BTC is also breaking out of its own multi-month wedge, which could signal altcoin strength if BTC stabilizes.  
Trading Idea:
• Bullish Scenario: Long on a confirmed breakout above the upper trendline (~$94,000) with stops below $92,000. Targets: $97,000 (short-term), $105,000+ (extended). 
• Bearish Scenario: If support cracks, short toward $85,000-$88,000, but I’d wait for confirmation to avoid whipsaws.
• Risk Management: Always use 1-2% risk per trade. Volatility is high, so position size accordingly. This isn’t financial advice – DYOR!
What do you think, bulls or bears in control? Drop your thoughts below. Let’s discuss!
#BTC #Bitcoin #Crypto #TechnicalAnalysis #FallingWedge #Trading
EUR/USD – Rising Wedge Breakdown Signaling Deeper BearishThis EUR/USD 2H chart shows a classic rising-wedge distribution, a pattern that often forms before a strong bearish move. Price rallied inside a rising channel, but the momentum weakened near the upper resistance zone, creating lower highs and showing sellers stepping in early.
A clean breakout below the wedge support confirms that buyers lost control. After the drop, price pulled back for a retest of the broken structure — exactly where sellers typically reload positions. That retest (highlighted in yellow) shows rejection, signaling bearish continuation.
The market is now expected to push toward the 1.15400 support zone, which aligns with previous demand and high-volume areas. If that level fails, the larger support near 1.14700 becomes the next major target.
This setup reflects a textbook bearish transition:
Breakout → Retest → Continuation.

Bitcoin - 66k in 2026 (but first a pump - watch this!)Bitcoin has been going down drastically, as I expected many, many weeks in advance. But this is not the end of the crash! We will see lower prices in 2026, specifically 66k and possibly 50k later in Q3 2026. This is my long-term vision, but in the short term I think Bitcoin should go up to retest the previous long-term trendline and the previous falling wedge pattern at 97k! Usually after a breakout/breakdown, we want to see a retest. These retests are very important because they give us a chance to sell Bitcoin at a better price and also to short Bitcoin on the futures market.
Bitcoin did some pretty crazy movements in the past weeks, regardless of the seasonality patterns. Statistically Bitcoin is extremely strong in October and November—but this time it was the opposite. Even though seasonality patterns are helpful, you always need to look for more indicators and fundamentals. Moonboys that were screaming for 200k and 500k got liquidated, and soon they will disappear from the market for good. I have been trading for almost 10 years, and I have experienced many crypto crashes, and the moonboys are always here at the top. When I was bearish at 120k, everyone was screaming in the comment section and even spitting on my bearish predictions.
So my plan for the next Bitcoin movements is as follows: First, Bitcoin should retest the 97k level (this will take some time). After that we should see another big leg to the downside to 66k.
Write a comment with your altcoin + hit the like button, and I will make an analysis for you in response. Trading is not hard if you have a good coach! This is not a trade setup, as there is no stop-loss or profit target. I share my trades privately. Thank you, and I wish you successful trades!

NZDUSD Wave Analysis – 27 November 2025
- NZDUSD broke daily Falling Wedge
- Likely to rise to resistance level 0.5800
NZDUSD currency pair recently reversed from support area between the powerful support level 0.5550 (which has been reversing the price from January) and the lower daily Bollinger Band.
The upward reversal from this support area stopped the previous minor impulse wave 5 of the intermediate impulse wave (C) from September.
Having recently broken the resistance level 0.5700 and the daily Falling Wedge from August, NZDUSD can be expected to rise to the next resistance level 0.5800.

Coca-Cola Is Attacking All-Time HighsCoca-Cola is basically one of the most famous drink brands in the world. It started in the late 1800s in the U.S., and over time it turned into a huge global company. They’re known for their classic Coke, but they also make tons of other drinks—juices, waters, teas, and even energy drinks.
After that gap up, Coca-Cola filled that gap as expected and then turned higher and broke above 71.77 resistance. So the wave structure remains bullish, and we could still see a push to new highs, as wave C — possibly the final leg of an ending diagonal — may target the 76–78 area. So latest retracement toward 68 might have been just temporary setback ideally wave two and bulls are now ready for new highs. We remain bullish as long as price stays above 66.
Highlights:
Trend: Bullish (wave C continuation in w. 5)
Support: 71, 68, 66
Resistance: 74, 78
Note: Bullish above 66, watching for wave C resumption towards new highs.

BTC Rebounds From 85K Support — Rally Toward 93K ResistanceHello traders! Let’s take a look at BTCUSD (Bitcoin). BTCUSD continues to trade within a broader corrective structure after a long bearish decline. Earlier, the market formed a large descending wedge, where price consistently respected both the Resistance Line and the Support Line. After the breakout from this wedge pattern, Bitcoin briefly turned bullish but soon entered a sideways Range, showing indecision and weakening momentum. The Range eventually broke to the downside, sending BTCUSD directly into the Seller Zone around $93,000, a key area that triggered several strong rejections in the past. A clean retest of this zone confirmed bearish pressure, leading to another impulsive drop. During the decline, price briefly pushed below the Support Zone near $85,000, creating a fake breakout, which trapped sellers and sparked a strong bullish reaction. From this point, buyers gained control and pushed price into a new ascending structure, supported by a rising Support Line shown on the chart. This indicates a shift in short-term momentum, with BTCUSD now forming higher highs and higher lows. Currently, Bitcoin is approaching the $93,000 Resistance Level, which aligns with the upper boundary of the previous Seller Zone. This is the key barrier for buyers. If price manages a clean breakout above this level, bullish continuation toward higher resistance zones becomes likely. As long as BTCUSD holds above the ascending Support Line and the $85,000 Support Area, the outlook remains bullish in the short term. From my perspective, BTCUSD is showing a short-term bullish continuation setup, supported by the ascending Support Line and the strong rejection from the $85,000 demand zone. If BTCUSD breaks back below $85,000, the bullish scenario becomes invalid, and a deeper correction could follow. For now, market structure supports a bullish recovery as long as buyers defend support and maintain the ascending trend. Please share this idea with your friends and click Boost 🚀

Breakout from falling wedge pattern?I think as soon as the EMA crossover VWMA occurs on the 1D that we will see a breakout from here. 1D macd bullish signal already occured in the meanwhile. Bulls are back!
