I see no INCentive for holding Richard Hearts INC token.As cryptocurrency investors grapple with the realisation that the four-year cycle has indeed unfolded, we find ourselves pondering, that all of 2025 was a distribution year for the entire industry.
(especially when considering the BTC/GOLD ratio)
Richard's Hearts Pulsechain ecosystem has faced numerous challenges and obstacles.
From legal confrontations with the SEC
To a cult founder who operates from the sidelines instead of leading the charge at the forefront.
The ETH price has been stagnant, constrained by early investors who are locking in multi-cycle gains.
Pulsechain has largely remained an isolated, siloed pool of capital for a small group of investors who cling to the hope that their leader will return and guide them to Valhalla.
There is indeed a possibility for this to happen in the next cycle, once the dust settles from this bear phase in crypto.
The INC token is particularly vulnerable as it lacks a real use case.
It does not provide yield.
As RH once mentioned, it is the token he cares about the least.
It was intended as a reward for providing liquidity on his DEX.
However, those rewards have been significantly reduced as the Heart man has attempted to prevent economic energy from leaving his chain, which has been hindered by a small group of large whales that have capped price growth in the past.
Therefore, I believe that #INC, #HEX, #PLSX, and #PLS will all experience significant new lows in 2026.
With INC potentially trading as low as 5 cents due to this inverted HVF pattern that has formed and triggered.
Wedge

CDSL !! Time to Be Cautious! Bearish Signals Getting StrongerThis is the Daily Timeframe Chart Analysis of CDSL
CDSL is currently forming a Rising Wedge pattern near the key resistance zone of 1680–1700. A breakout above this level with strong volume could lead to an upside target around 1800.
However, if the stock fails to break this resistance and the zone holds, we may witness a downside move. In that case, CDSL could retrace towards the range-bound support area of 1500–1520.
Thank you.

RIO | Metals Miner Will Rise | LONGRio Tinto Plc engages in the exploration, mining, and processing of mineral resources. It operates through the following business segments: Iron Ore, Aluminium, Copper, and Minerals. The Iron Ore segment supplies iron ore mining and salt and gypsum production. The Aluminium segment produces bauxite, alumina and primary aluminum. The Copper segment offers gold, silver, molybdenum and other by-products. The Minerals includes businesses with products such as uranium, borates, salt and titanium dioxide feedstock together with coal operations. The Other Operations segment covers the curtailed Gove alumina refinery and Rio Tinto Marine operations. The company was founded in 1873 and is headquartered in London, the United Kingdom.

KASPA Is Compressing Into a Macro Coil — Big Move Approaching?📉➡️📈 KASPA Weekly Falling Wedge – Compression Before a Larger Move
_______________________________________________________________________________
KASPA (KASUSD) – Weekly Falling Wedge Analysis
Kaspa has been forming a large falling wedge on the weekly timeframe, a structure often associated with decreasing selling pressure and potential bullish reversal setups. The trendlines have held for months, and price continues to compress as it approaches the apex of the pattern. Confidence is medium at this stage: the pattern remains valid, but momentum has not yet confirmed a breakout.
_______________________________________________________________________________
📉 Structure Overview
On the weekly chart, price action has been steadily narrowing between lower highs and relatively stable lows. The lower trendline has been tested multiple times, and the aggressive wick on October 6th highlighted strong buying interest at this support. Since the Kraken listing, volume has gradually declined, which is typical behavior in the later stages of a wedge. Based on the current trajectory, a breakout still appears to be several weeks away as the market continues its compression.
_______________________________________________________________________________
🐂 Bullish Scenario
If Kaspa continues to respect the wedge support, the first significant move would likely be a push toward the upper boundary of the structure near $0.09. Should price break out of the wedge, the next areas of interest become:
🎯 $0.09 – First touch of upper wedge resistance
🎯 $0.10 to $0.11 – Key structural resistance zone
🎯 $0.13 – A measured-move extension and historical supply area
The strong wick reaction at the lower boundary suggests that buyers are active at these levels, which supports the idea that upside continuation is a realistic scenario if structure holds.
_______________________________________________________________________________
🐻 Bearish Scenario
A full weekly candle close below the wedge would invalidate the structure and would likely lead to increased bearish momentum. If this breakdown occurs, the next downside levels to watch are:
🔻 $0.032 – First major support
🔻 $0.015 – Broader structural low
Although this outcome is technically possible, it currently appears less probable due to the strength of demand visible along the lower trendline.
_______________________________________________________________________________
📐 Why This Pattern Matters
A falling wedge represents tightening volatility and a reduction in selling strength as the pattern matures. These conditions often create a coiled-spring effect, leading to significant movement once the structure resolves. On a weekly chart, wedge breakouts tend to result in multi-week or multi-month directional moves, which makes this current setup important to monitor.
💡 Fundamental Tailwinds Supporting Long-Term Strength
Kaspa’s fundamentals continue to evolve alongside this technical setup.
_______________________________________________________________________________
🧠 VProgs (Virtual Programs)
VProgs introduce customizable, programmable rules directly into transactions. This allows users to define spending conditions, automate certain behaviors, and create more complex logic without relying on a full smart contract engine. They deliver much of the flexibility associated with smart contracts while keeping execution lightweight and efficient.
_______________________________________________________________________________
⚙️ Smart-Contract-Like Capabilities via the BlockDAG
Kaspa’s BlockDAG architecture, combined with VProgs, provides room for expressive, rule-based applications while maintaining extremely fast confirmation times and strong Proof-of-Work security. This positions Kaspa to serve as a high-throughput programmable network without the bloat or congestion common in legacy smart contract environments.
These fundamental developments support strong long-term potential, even as price compresses in the short term.
_______________________________________________________________________________
📌 Summary and Final Outlook
Kaspa is approaching the apex of a clean falling wedge on the weekly chart. Volume is tapering, structure remains intact, and both bullish and bearish scenarios are clearly defined. The next major move will likely emerge once price resolves this tightening pattern.
_______________________________________________________________________________
Bullish Targets:
📈 $0.09 → $0.10–$0.11 → $0.13
Bearish Invalidations:
📉 Weekly close below the wedge → $0.032 → $0.015
Overall, Kaspa continues to show long-term promise, supported by both technical structure and evolving fundamentals. Traders should watch closely as price approaches the point of resolution within this macro wedge.

AUD/USD Climbs on Jobs Report as Wedge Pattern Eyes BreakoutDespite a slightly stronger dollar, via the DXY index, AUD/USD managed to tick slightly higher on Friday, rising by about 0.15% in afternoon U.S. trading. The Australian employment report surprised to the upside this week, with the country’s unemployment rate dropping to 4.3%. That reduced rate cut odds, likely explaining some of the strength this week.
Friday’s move helped the currency rise about 0.73% for the week, although prices remain inside of last week’s open/closing range. Zooming out a bit, this month’s price action puts the currency at about a 0.08% loss, with prices remaining contained within the October swing high/low levels. In fact, prices have retracted to the pseudo 50% Fibonacci retracement level from that range. Indecision within the range shows that AUD/USD traders haven’t come to a consensus on the direction for the currency’s path yet.
Zooming out to the weekly chart, we see that a symmetrical wedge pattern has formed, with the bottom of the wedge starting in late June and the top of the wedge defined by the September highs. Prices rallied into the wedge formation, suggesting that this could be a bullish wedge that could see an upside breakout if prices manage to pierce above the pattern. If we assume an upside breakout is to occur, we can take the measured move to gauge the upside target once resistance breaks. The measured move is defined by the widest part of the pattern, which measures 0.03344. That could put prices within touching distance of the 0.69000 level, which is where 2024 trading saw resistance. Alternatively, a clean break below the pattern’s support would invalidate the pattern and dash hopes of a breakout.

BTC long-Term Technical Analysis📍 Current Status:
Bitcoin is forming a Bullish Flag Pattern🎯
•Currently at the bottom of the pattern
•Key Support: $93,000 🛡️ (Flag Bottom)
•**Main Resistance**: $108,000 🚧 (Flag Top)
📊 Technical Signals:
•Bullish Flag pattern confirmed 📈
•RSI: Showing oversold bounce potential 💪
•Trading Volume: Consolidating at support ✅
•Fear & Greed Index: 22 - Extreme Fear Zone 🚨
🎯 Possible Scenarios:
•Bounce from pattern bottom → Target $108,000 🚀
•Break above flag → Targets:
· $116,000 🎯
· $132,000 📈
· $145,000 🏁 (Final Target)
•Pattern failure: Only if breaks below $93,000 ❌
⚡ Key Insights:
•This is the optimal entry zone within the bullish flag!
•Fear & Greed Index suggests potential reversal 📊
•Historical pattern success rate: ~75% ✅
•Potential 56% growth to final target 📊
⚠️ Risk Management:
•Stop Loss: Below $92,500 📌
•Take Profit Targets:
· $116,000 🎯
· $132,000 📈
· $145,000 🏁
💬 What's Your Analysis?
Do you confirm these signals?Share your thoughts! 👇

AUDNZD Rally Losing Steam – Watch This Reversal Zone!As we’ve seen, AUDNZD ( OANDA:AUDNZD ) recently began an upward move after forming a Falling Wedge Pattern , and it’s been in an Ascending Channel for about the past 16 days.
Currently, AUDNZD is moving into a Heavy Resistance zone(1.1662 NZD-1.1340 NZD) and a Potential Reversal Zone(PRZ) .
From an Elliott Wave perspective, it seems like AUDNZD is completing the microwave 5 of the main wave 3 . Once it breaks below the lower line of the ascending channel, we can somewhat confirm the end of the main wave 3.
Additionally, we can see a Negative Regular Divergence(RD-) forming between two consecutive peaks.
I expect that in the coming hours, AUDNZD might decline at least to the Support zone(1.1480 NZD-1.1444 NZD) . If it breaks that Support zone, we could see it dropping toward around 1.1353 NZD(Second Target) .
Stop Loss(SL): 1.16403 NZD
Please respect each other's ideas and express them politely if you agree or disagree.
Australian Dollar/New Zealand Dollar Analyze (AUDNZD), 4-hour time frame.
Be sure to follow the updated ideas.
Do not forget to put a Stop loss for your positions (For every position you want to open).
Please follow your strategy and updates; this is just my Idea, and I will gladly see your ideas in this post.
Please do not forget the ✅' like '✅ button 🙏😊 & Share it with your friends; thanks, and Trade safe.

FILUSDT — the formation is repeating, the structure is familiar.Filecoin(FIL) - is a decentralized storage system with the goal of "storing humanity's most important information." During its initial coin offering (ICO) in 2017, the project raised $205 million. The launch was initially planned for mid-2019, but the mainnet launch date was postponed until block 148,888, which occurred on October 15, 2020.
📍 CoinMarketCap : #50
📍 Twitter(X) : 667.3K
🔍 What I observe:
I’ve added the full trading history to the chart for better understanding (the chart on exchanges is cut off). The coin is liquid. I also added the prices for the public and private offerings.
There’s a large horizontal channel, or more specifically, a channel within a channel, which has been active for about 1111 days.
After another drop, a descending wedge formed, and now we are witnessing a breakout of its resistance (a retest is possible).
These patterns are ones I regularly track and trade, based on personal experience accumulated over the years and my strategy.
📊 I’ve plotted the nearest resistances and target prices with movement percentage calculations.
💭 It’s quite possible that this formation in the lower part of the wedge, coinciding with the area of lows on the support of the outer channel, was used to gather liquidity and shake out weak hands.
I also want to point out the large wicks in this zone - a characteristic pattern for accumulation points and subsequent reversals.
______
📌 Not financial advice. Observing structure and recurring phases.
Operate within your strategy and with an awareness of risks.

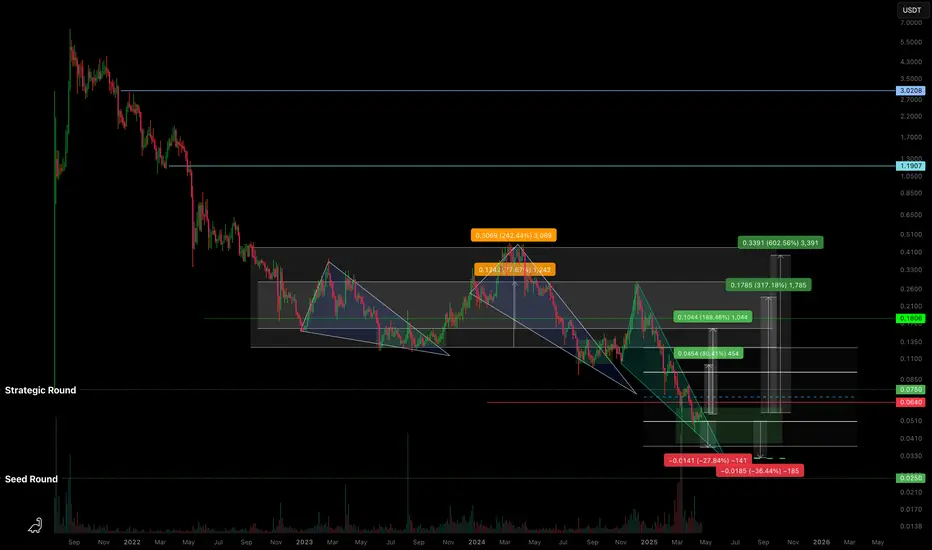
C98USDT — Descending Wedge & High R/R ZoneBased on the current structure, BINANCE:C98USDT is moving within a descending wedge , approaching zones that align with early investor positions.
🔍 What I’m seeing:
Potential drop into the range of a previous horizontal channel - marked on the chart.
We've already reached the Strategic Round level; below that is the Seed Round .
Assuming the project isn’t abandoned, it makes sense to expect investor defense in this zone.
From what I observe, there's likely accumulation happening from weak hands - at a discount .
🛡️ Approach:
As I’ve said before - you can’t treat coins like this in isolation .
They should be traded as part of a group of low-liquidity tokens , with proper risk management .
You can’t know in advance which one will “survive” without insider info from the team.
So the key is having a solid strategy and managing your portfolio and risk wisely .
📈 Targets:
Potential breakout targets from the wedge are marked on the chart.
If the market remains weak, I’ve noted a lower zone where consolidation might occur (sideways chop within a horizontal channel).
💭 Opinion:
The market is “paused” and waiting for a catalyst. You can’t rush it.
But zones like the current one on BINANCE:C98USDT seem attractive in terms of risk/reward .
The goal isn’t to guess - it’s to follow a pre-built strategy and stay focused .
📌 As always, this is not financial advice. Just my personal take and observations on the structure.
USDCAD WEDGE BREAKOUT|LONG|
✅USDCAD broke out of a bullish wedge, signaling a potential continuation toward higher imbalance zones above 1.4050$. Liquidity resting above equal highs could be targeted next. Time Frame 4H.
LONG🚀
✅Like and subscribe to never miss a new idea!✅

USDCHF - Bearish Rising WedgeHello traders,
The USDCHF pair has broken down from a rising wedge pattern, signaling potential bearish momentum 📉
I expect the price to continue lower toward the next target zone.
🎯 Target: 0.79130

Bitcoin - Why everyone is probably wrongYou may have noticed published ideas on tradingview.com are now calling for price action to take one direction and that direction is down. Don’t take my word for it, click on BTCUSD pair to the bottom right of this screen and then ‘ideas’ then ‘Recent’. A significant number of analysts are “short” at this time.
The number of short ideas should not be surprising, there is tens of millions of dollars in short interest around the 74-75k area waiting to be liquidated.
Two falling wedge patterns are shown on the above 1-day chart. All too easily these patterns produce false breakouts. How do you verify? Verification is made in a similar way to the recently published “How to void or validate a head and shoulders pattern” (idea linked below). We achieve validation by observing the movements of the oscillators.
1) A cross up of 20 indicates momentum is returning to the market. Look left.
2) Momentum oscillators cycle from above 80 to below 20 the majority of the time between 20 to 30 days. Look left and confirm, don’t take my word for it! At this time 26 days have passed since Stochastic RSI was above 80.
3) Considering points (1) and (2) the falling wedge now has a high probability of confirming the continued uptrend.
4) The wedge target area may be forecast by measuring the flagpole height (black circles). You can observe how accurate the first wedge target was forecast using this process. The forecast for the 2nd wedge is shown, towards the 115k area.
5) The 115k target area was first forecast from the “Is Bitcoin about to rally to 110-120k” idea (linked below) in July 2022 as price action was around $18k using the same method described above.
6) When the target is reached the bull market is over. There will be calls from all quarters informing us how price action is now going to $250k and beyond. Ignore it. The next macro long opportunity will be in 2026.
Is it possible price action continues correcting from the new all time high? Sure.
Is it probable? No
Ww
How to void or validate a head and shoulders pattern
Is Bitcoin about to rally to 110-120k

S&P500 (US500): Important Breakout & Bullish Continuation
US500 likely completely a correctional movement,
breaking a resistance line of a bullish flag pattern on a 4H time frame.
I think that a bullish wave is going to start soon
and the market will reach at least to 6917 level.
❤️Please, support my work with like, thank you!❤️
I am part of Trade Nation's Influencer program and receive a monthly fee for using their TradingView charts in my analysis.

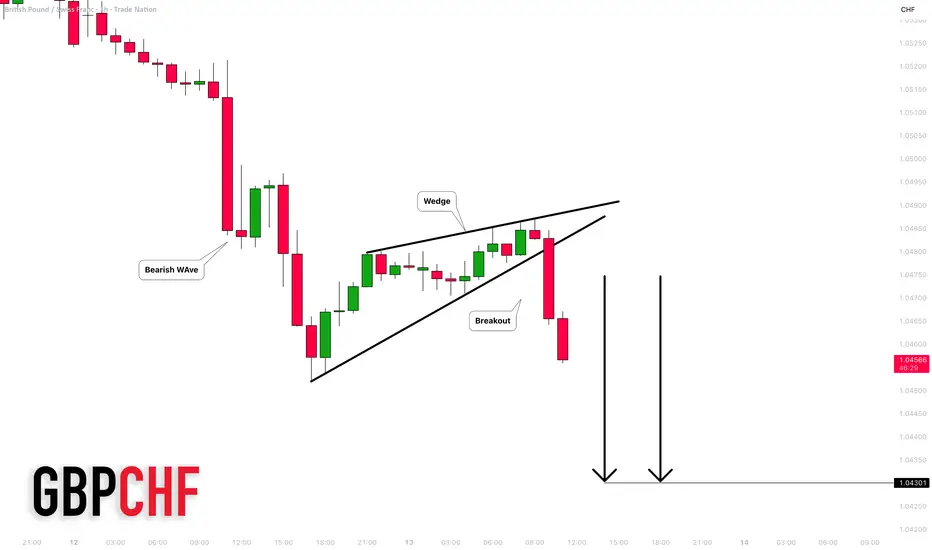
GBPCHF: Bearish Trend Continuation 🇬🇧🇨🇭
GBPCHF is trading in a strong downtrend.
A bearish breakout of a rising wedge pattern on an hourly time frame
indicates a highly probable trend continuation.
I expect a fall at least to 1.043 level.
❤️Please, support my work with like, thank you!❤️
I am part of Trade Nation's Influencer program and receive a monthly fee for using their TradingView charts in my analysis.
EURNZD: Strong Bullish Confirmation 🇪🇺🇳🇿
Quick update for EURNZD.
Retesting the upper boundary of a major demand zone on a daily,
the price bounced and violated a resistance line of a falling channel
on an hourly time frame.
Probabilities are high that we will see a pullback from that.
Goal - 2.059
❤️Please, support my work with like, thank you!❤️
I am part of Trade Nation's Influencer program and receive a monthly fee for using their TradingView charts in my analysis.

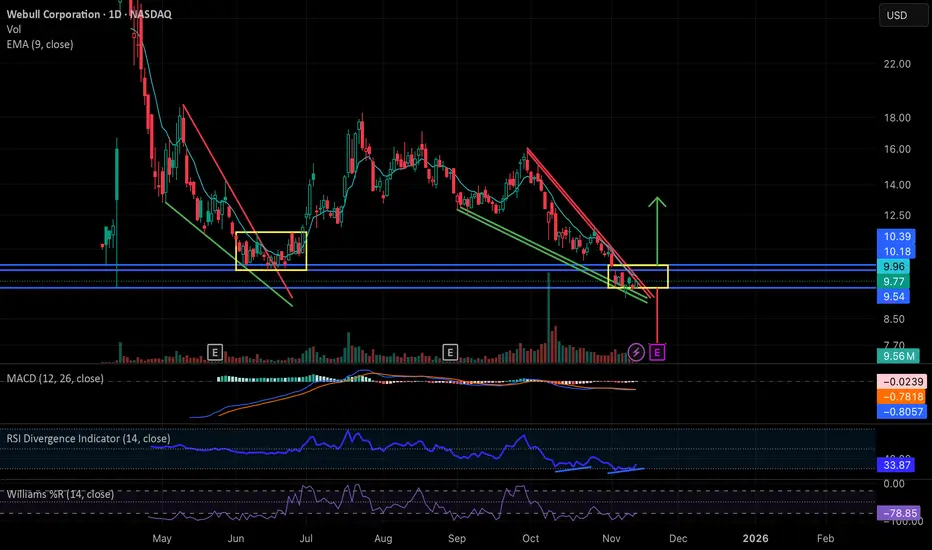
Webull: Falling Wedge Breakout ImminentNASDAQ:BULL has been in a steady decline essentially since the start of the government shutdown, forming a clean falling wedge structure very similar to the setup we saw in May and June. Back then, the wedge resolved with a brief breakout but ultimately moved into a sideways consolidation inside the yellow range before finally lifting in late June/early July.
Price is now sitting at the apex of a new wedge right as the government has officially reopened, almost to the day. With the president signing the bill, this may act as a macro green light for liquidity into year end, and BULL is positioned to potentially benefit from that.
Technically, the stock is deeply beaten down (roughly 40 percent from pre-shutdown levels), the MACD is starting to curl up, and there’s a clear daily RSI divergence. Together, these conditions make a relief move or breakout increasingly plausible.
If we don’t get a meaningful directional move between now and earnings on 11/20, then the most likely scenario is a replay of the May/June pattern: a period of sideways chop inside its current established support and resistance band zone around 9.54-10.18/10.39 while the market waits for the earnings catalyst. That report would then determine the next substantial move up or down.
In short: BULL is at a technical decision point, with momentum indicators improving, macro pressure easing, and earnings close enough that either a near-term wedge break or a consolidation-before-catalyst are both reasonable outcomes from here.
Bitcoin Falling Wedge Signals Breakout or Breakdown ZoneBitcoin is trading inside a falling wedge, a pattern that traditionally leans bullish when the breakout occurs.
At the same time, the price is approaching a historically sensitive region — the 112,000 USD zone, which is acting as the potential Point A (left shoulder zone).
If Bitcoin rejects from 112k–113k, this level may complete the left side of a developing head and shoulder formation, especially if the market loses its neckline later.
Important Supports to Watch
$97,000 → The most crucial support on the daily.
$97,500–$98,000 → Double-bottom demand zone.
$92,000 → The next major support & unfilled gap region.
A clean break below 97k will flip the entire market structure bearish and likely trigger a rapid decline toward 92k, confirming the neckline breakdown of a head and shoulder setup.
Bullish Scenario
If BTC forms a double bottom around 97.5k–98k, or if it sweeps liquidity and reclaims the level:
The falling wedge can break upward.
A push toward 112k becomes highly probable next week.
A breakout above 113k invalidates the bearish reversal and opens the way for continuation to higher levels.
This scenario requires a successful retest of the falling wedge breakout and strong volume.If BTC gets rejected at 112k–113k, and later breaks down below 98k, the chart will complete:
A textbook head and shoulder
A lost wedge structure
Momentum shift from bullish to bearish
This breakdown can trigger a high-velocity dump into the 92k gap zone.What Traders Should Focus On
112k–113k → Critical rejection zone to confirm the left shoulder.
97k–98k → Most important support and possible double-bottom area.
92k → Final downside target if BTC loses the neckline.
Watch for liquidity sweeps and volume strength to validate direction.Final View
Bitcoin is entering a decision phase.
The chart is offering both bullish wedge breakout potential and bearish head and shoulder risk, depending on how price reacts at 112k and 97k.
This is a position where traders should stay alert and wait for clean confirmation from either the breakout or the breakdown before placing major trades.

NZD-USD Bearish Wedge! Sell!
Hello,Traders!
NZDUSD formed a bearish wedge structure and broke its lower boundary, hinting at bearish continuation toward the next liquidity level resting below. Time Frame 4H.
Sell!
Comment and subscribe to help us grow!
Check out other forecasts below too!
Disclosure: I am part of Trade Nation's Influencer program and receive a monthly fee for using their TradingView charts in my analysis.

Bitcoin - New falling wedge! (no one talks about, must see)Bitcoin is forming a brand new falling wedge pattern no one really talks about! This falling wedge pattern is not complete, and it will take another week to see the whole pattern, but what we see now is the first skeleton of the pattern. Of course this is great because we can enter a short position on futures and speculate on the price decrease!
What is very interesting is that inside the falling wedge pattern we have a symmetrical triangle. This triangle recently broke down, and we saw a massive drop, but now the price is recovering, and soon we may see a retest of the triangle. That's also a great opportunity to short Bitcoin!
Currently Bitcoin is going up, but to me this is just a temporary pullback. I am pretty bearish, and I think we are going to go down! There is still an untested 2024-2025 trendline, so I expect Bitcoin to hit this trendline this or next week. I think this could be a good idea to open a long position if this happens.
What is the plan for November? I think Bitcoin is bearish, and we are going to hit 98k later this month. A lot of people may start to think that the bottom is in and that Bitcoin will go to a new all-time high; I disagree with this idea. I think there is more downside for Bitcoin.
Write a comment with your altcoin + hit the like button, and I will make an analysis for you in response. Trading is not hard if you have a good coach! This is not a trade setup, as there is no stop-loss or profit target. I share my trades privately. Thank you, and I wish you successful trades!

DKNG Update | $10Video contains a update on DKNG price action
Looking to see a move to $10 in the long term view
First we need to see a pullback which we are going through currently
Before $10 we will look to hit $20 first. Any rejection under liquidity grab will validate the next move.
Watch video for more details.
Ps
TradingView needs to allow shorter descriptions again😕

GBPUSD: Very Bearish Outlook 🇬🇧🇺🇸
Intraday price action on GBPUSD looks very bearish after a recent
test of a significant daily resistance that we discussed earlier.
The occurrence of a bearish imbalance indicates a highly probable
down movement.
I anticipate a fall at least to 1.3064
❤️Please, support my work with like, thank you!❤️
I am part of Trade Nation's Influencer program and receive a monthly fee for using their TradingView charts in my analysis.

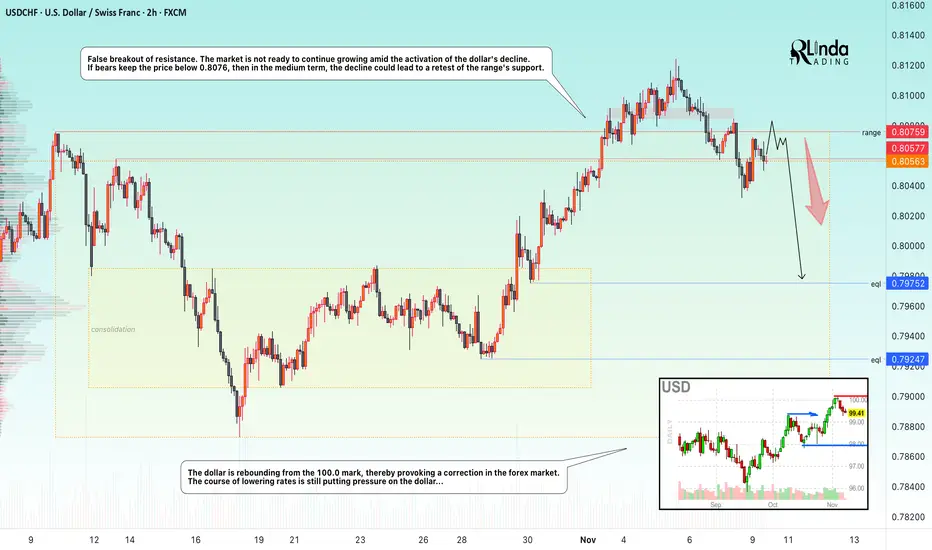
USDCHF → Manipulation? False breakout of resistance FX:USDCHF attempted to take advantage of the trend reversal opportunity after breaking out of a descending wedge, but the weak dollar hindered the rally...
The currency pair is facing resistance at 0.8076. There is no continuation of the momentum towards a breakout, and bearish pressure, which is intensifying as the dollar index declines, is negatively affecting the currency pair. The price has returned to the trading range, with an emphasis on 0.8057 - 0.8076. If the bears keep the price below this zone, this move could trigger further sell-offs.
Resistance levels: 0.8057, 0.8076
Support levels: 0.7957, 0.7925
The false breakout confirms that sellers currently have the upper hand and buyers lack the strength to push the price higher. Accordingly, consolidation below the key level could trigger a further decline towards the zone of interest at 0.7975.
Best regards, R. Linda!
NZDCADTrend was bearish now it is going to bullish also had bullish divergence
Reversal Pattern Rising wedge
No continuation pattern
