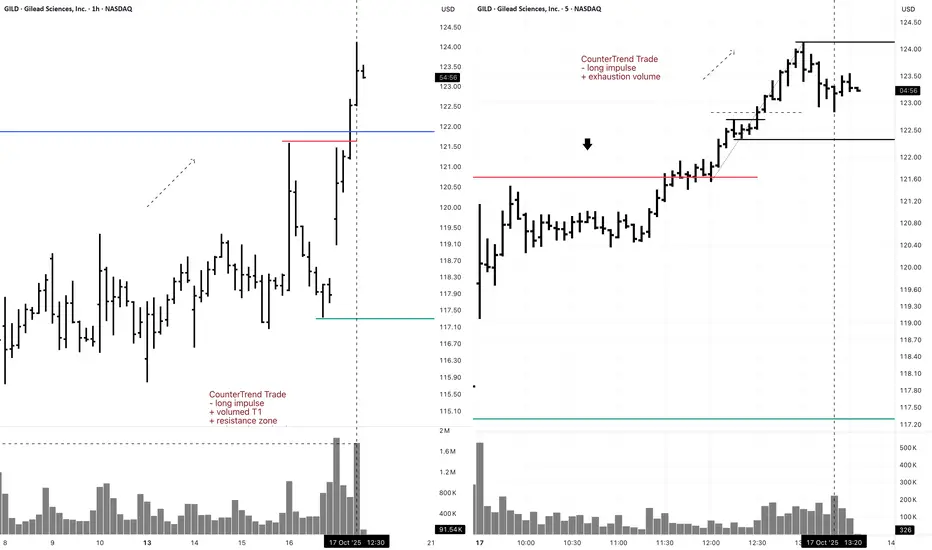
GILD 5M Short CounterTrend Daytrade (Buy Put to Open)5M CounterTrend Trade
- long impulse
+ exhaustion volume
1H CounterTrend
"- long impulse
+ volumed T1
+ resistance zone
+ volumed reaction bar"
1D CounterTrend
"- long impulse
- unvolumed T1
+ resistance level
+ volumed manipulation bar "
1M CounterTrend
"- long impulse
+ volumed T1 level
+ resistance zone"
1Y CounterTrend
"- long impulse
- unvolumed T1
+ resistance zone"
Wyckoff
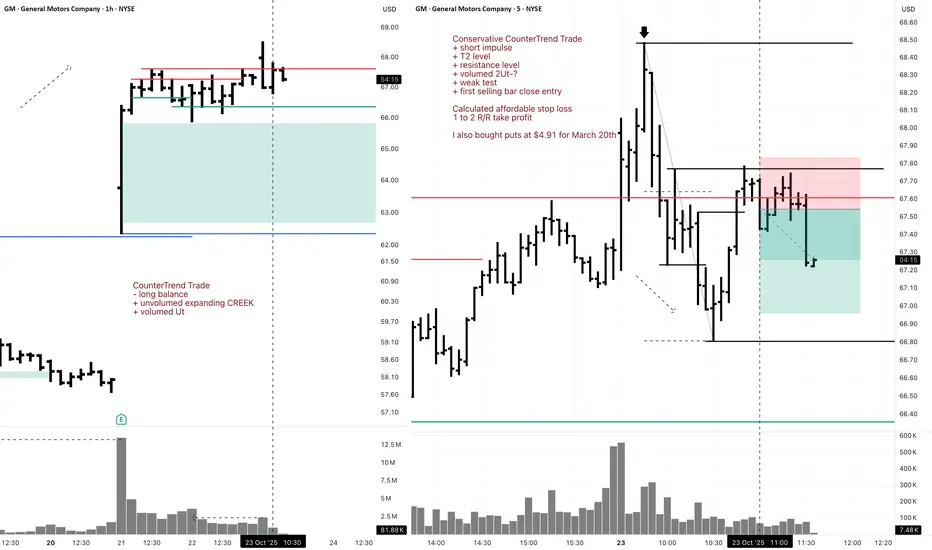
GM Short 5M DayTrade Conservative CounterTrend TradeConservative CounterTrend Trade
+ short impulse
+ T2 level
+ resistance level
+ volumed 2Ut-?
+ weak test
+ first selling bar close entry
Calculated affordable stop loss
1 to 2 R/R take profit
I also bought puts at $4.91 for March 20th
1H CounterTrade
"- long balance
+ unvolumed expanding CREEK
+ volumed Ut"
1D CounterTrend
"- long impulse
- neutral zone
+ exhaustion volume?"
1M CounterTrade
"- long impulse
- unvolumed T1
+ resistance zone
+ volumed manipulation bar
- volumed reaction bar looks for break
- volume distribution is long"
1Y CounterTrend
"- long balance
+ expanding volumed CREEK
+ resistance level"
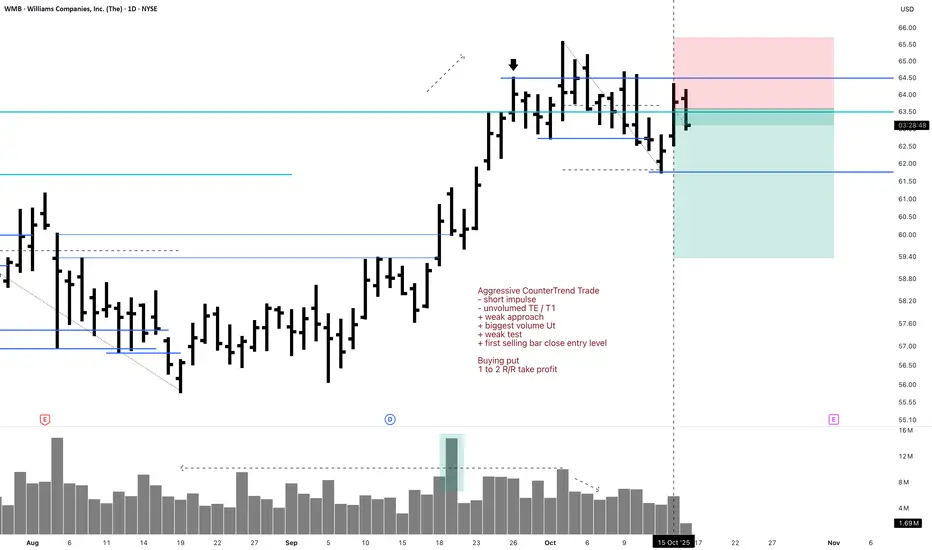
WMB 1D Short Aggressive CounterTrend Trade (Put Buy to Open)Aggressive CounterTrend Trade
- short impulse
- unvolumed TE / T1
+ weak approach
+ biggest volume Ut
+ weak test
+ first selling bar close entry level
Buying put
1 to 2 R/R take profit
Monthly CounterTrend
"- short balance
+ volumed expanding CREEK
+ resistance level
= wrong volume distribution weak approach"
Yearly CounterTrend
"- short balance
+ volumed expanding CREEK
+ resistance level
= wrong volume distribution weak approach"
BTC retracement by Wyckoff Replicated the model of Wyckoff distribution. The only thing is that he never used Fibbonacci in hes practice. While applying Fibbs will give us Swing entry at two resistance levels $98-100K and deeper at $92-94K, and the total 0.786 retrace would erase whole pump since April, that would be $84K. COnsidering that 2/3 of the trading volume is the US markets and US is currently in a bad shape, considering political situation, gov close and raw metals pump, BTC as a risk asset is still not a favorable investment. loosing 24K in short period of time or 20% value is showing that it can easy lose such value.

Ford 1D Investment Aggressive CounterTrend TradAggressive CounterTrend Trade
- short impulse
+ exhaustion volume
+ 1/2 correction
Calculated affordable stop limit
Take profit:
1/3 to 1/2 Month Trend
1/3 to Month T2
1/3 to Year 1/2
Sell F Limit at $14.95 (Good 'til Canceled)
Sell F Limit at $11.57 (Good 'til Canceled)
Sell F Limit at $10.21 (Good 'til Canceled)
Monthly CounterTrend
"- short impulse
+ 1/2 correction
- unvolumed T1
+ support level
+ reverse volume approach
+ volumed manipulation"
Yearly Trend
"+ long impulse
+ volumed T2 level
+ volumed 2Sp+
+ weak test"

F 5M Daytrade Long Aggressive Trend TradeAggressive Trend Trade
- short impulse
+ volumed TE / T1 level
+ support level
+ long volume distribution approach
+ biggest volume 2Sp+
- no test
Calculated affordable stop limit
1 to 2 R/R take profit before 5M T2
Hour Trend
"- long impulse
- volumed T2
+ support level
+ 1/2 correction
+ biggest volume manipulation"
Day Trend
"+ long impulse
+ 1/2 correction
- neutral zone
- context direction short"
Month CounterTrend
"- short impulse
+ 1/2 correction
- unvolumed T1
+ support level
+ long volume distribution
+ biggest volume manipulation"
Year Trend
"+ long impulse
+ volumed T2 level
+ volumed 2Sp+
+ 1/2 correction
+ weak test"

UPS Swing Long 1H Conservative Trend TradeConservative Trend Trade
+ long impulse
- supporting reaction bar
+ support zone
+ 1/2 correction
+ biggest volume Sp
Calculated affordable virtual stop loss
1 to 2 R/R take profit
Daily Trend
+ long impulse
= neutral zone"
Monthly CounterTrend
"+ short impulse
+ biggest volume T1
+ support zone
+ biggest volume manipulation bar
- one bar reversal?"
Yearly trend
"+ long impulse
+ 1/2 correction
+ T2 level
+ support zone
+ biggest volume manipulation bar"

ITMAX TO CONT MARK UPThis is a Re-Accmulation of Schematic #2, Rising Bottom
From the pov of BUEC , my hypothesis for now, probably price would be making upward trajectory (Phase E)
Taking 23/9 as landmark for the Trigger Bar :
-This entry is an atypical type approach as compare to my original tactic
-Bar (or Candlestick) @ 24th + 25th + 26th + 29th + 30th September, would be considered as the
'Stage Reversal'
-This stage reversal , is also a type of SpringBoard
-To be more specific, SpringBoard Schematic #2
Tight risk here.
Pure Wyckoff

KLCI SELLThis is a continuation from my previous post
-Kindly refer to the link attached
Yesterday, leaders has been acting weird, consisting of pathological behaviours.
With lots of volatility and failed breakouts.
These kind of environment and background are the kind that i want to avoid the most.
As such, i was forced into cash and managed to book all profits.
Being a Stock Investor, i am fully devoted to the action of individual stocks, dictating my plan in the market.
-Probably @ level of 1640-1676 would be the end for this 2025
In the meantime, i am dipping toes incrementally if possbile.
Balancing between risk n the upside.
Staying cash is the prudent thing to do for me at the moment.

Shakeout - PurchasesThe professional has already shakeout and also it already confirmed us each phase. So, what we could expect? higher prices once it breaks 4287

Mr. Wyckoff Is That You? (Pt II) & Pi Cycle Top Trendline on BTCHey Trading Fam,
As the Donald keeps the market gambling and scrambling, I want to step away from the headlines a bit and take a closer look at what our charts might be suggesting. Admittedly, the bias indicated may be somewhat contrarian at the moment. If you're not into that, this video is probably not for you.
It feels like an echo chamber out there with most analysts. Everyone keeps yelling, "Buy the dip! Buy the dip!" But what about a more cautious approach? Maybe it was time to sell the top and preserve your cash? I don't know. Just throwing it out there.
As many of you are aware, we've reached my third and final target on the SPY. I've been talking about 670-700 on the SPY for a couple of years now. It's been hit, and personally (though I am cautiously still trading publicly), I've exited. My goal is to preserve my cash. Maybe I do this through precious metals? Haven't decided yet. But I am happy with the profit I've made to this point and will probably not test fate too much further.
As for crypto, old Bitcoin usually follows our stock market. And we have tracked the SPY for that part. If the market does, in fact, pull back further, I would expect Bitcoin and all of crypto to follow.
I know, I know. But what about that altcoin season? I don't know guys. That may not actually start until next year. I'm not saying this will be the case for sure. But more and more, it sure is looking that way.
Enjoy the vid,
✌️Stew

SCGBHD CONT ITS MARKING UPThis is a continuation trade from my previous entry
-Kindly refer to previous post (Link as attached)
SCGBHD is one of the Leader in this current Bull Market.
-Kindly refer to my post about KLCI Index
In a bigger context, for now, i see SCGBHD is currently in Mark-Up Phase.
I Re-Initiated position @ 2.35 today with an assumption that price is undergoing for Phase A :
1/ Purple Color line : Would be an imagination of a probable, Schematic #2 Of Re-Accumulation Trading Range
2/ Black Color line : Would be an imagination of a probable, Schematic #1 Of Re-Accumulation Trading Range
PureWyckoff

UPS Swing 1H Long Conservative CounterTrend TradeConservative CounterTrend Trade
+ long impulse
- support bar above JOC level
+ support level
- above 1/2 correction
+ volumed 2Sp-
+ weak test
Calculated affordable virtual stop loss
1 to 2 R/R take profit above 1H T1 below 1D CREEK
Daily CounterTrend
"= uniderectional balance
+ expanding ICE level
+ support level"
Monthly CounterTrend
"- short impulse
+ biggest volume T1
+ biggest volume breaking bar with bad result"
Yearly Trend
"+ long impulse
+ 1/2 correction
+ T2 level
+ support level"

KLCI TO CONTINUE BULLISHThis is a continuation from my previous post
-Kindly refer to the link attached
Since 3/10/2025, KLCI has been dropping for about 3.3% from the peak.
Judging from the behaviour of current market leaders, i think KLCI most probably going to resume its uptrend from here (Black Box)
-or it could further, plummet, slightly below the Black box (lingering around EMA 50)
Im not sure, i have my own prediction but dont stick with it.
At this moment October 2025, i managed to pull up around 140% total ROI of my account
*(Heavy use of Margin )
For the Leadership stocks, they are acting very well at the moment
And based on Wyckoff Projection , looks like KLCI able to reach 1700-1750 at the end of 2025? Or early 2026?
Leaders mid bullrun October 2025 :
SCGBHD, PEKAT, MNHDLG
ITMAX (lead n rest)
KGB
FFB / KOPI (Cookie cutter)
Spritzer (Category Killer)
---> These are my top Leaders

Mr Wyckoff, is that really you?Just a question folks. Don't shoot the messenger. Mr. Wyckoff loves to surprise the market. When they least expect it, he'll jump out and scare the hell out of everyone.
✌️Stew


BTC — Targets for the Current CycleIt looks like BTC is completing its growth phase. The current structure points to a distribution stage and a gradual rotation of liquidity into ETH and altcoins.
Still, our key levels for this move remain:
🎯 Target 1: $102,000 — key support and possible first reaction zone.
🎯 Target 2: $87,000 — deeper retracement
🎯 Target 3: $64,000

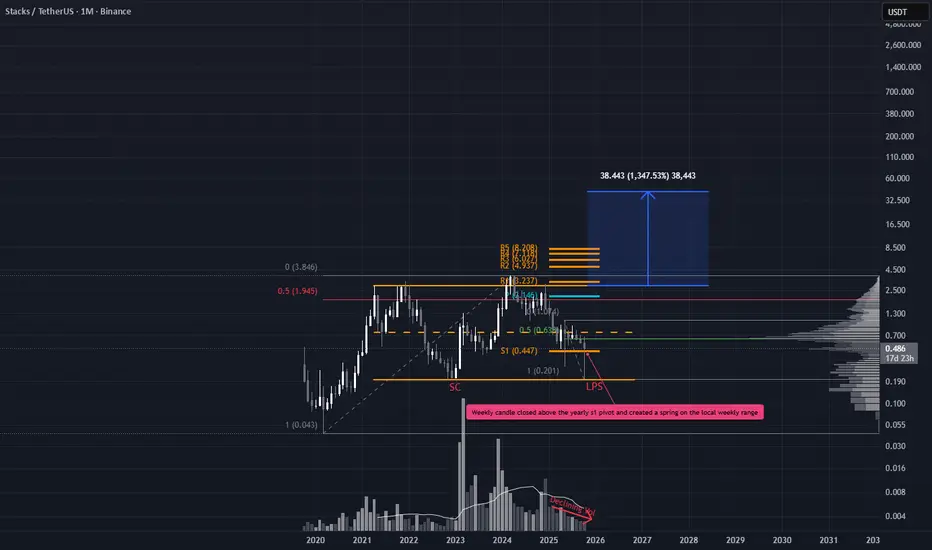
Smart Money Absorbs as Max Pain Setup UnfoldsSTX has been quietly range bound for nearly four years, but the recent price action demands attention. While most alts printed fresh lows during the October 10th liquidation flush, STX held firm its wick didn’t breach the Selling Climax (SC), and volume surged. This Last Point of Support (LPS) signals strong demand and potential smart money presence (weekly timeframe).
Trade Scenarios
Option 1: Immediate Entry
Entry: Current price
Stop Loss: Just below the LPS
Targets:
TP1: Yearly pivot + major 50% level
TP2: If price breaks the range high, a projected range extension gives a minimal target of ~$42
These targets may seem ambitious, but they’re derived directly from the chart structure, no hopium, just data.
Option 2: Pullback Entry
Entry: Wait for a pullback near the EQ of the large wick
Stop Loss: Based on daily TF structure
Targets: Same as Option 1
Fear-Fueled Shakeout Sets the StageMassive liquidation shook the crypto space on Friday, October 10th with nearly $20B flushed out. But while the masses panicked, the charts show smart money buying.
LINK printed a textbook high-volume spring out of the range, signaling smart money absorption amid capitulation. The weekly candle closed deep into the range, reinforcing the idea that this wasn’t random volatility, it was structured accumulation and shakeout.
Volume on the Spring exceeded that of the Selling Climax (SC), which sets the stage for a potential retest. But don’t anchor to the $7.64 wick, that’s an anomaly. Instead, watch for price to revisit the EQ of that wick zone to form a higher low (HL) and validate the test.
This setup offers a compelling Risk-to-Reward profile. If the structure holds, a minimal very simple range target sits around ~$66. from here price could go much higher but one step at a time.

Silver Long-Term Outlook: Wyckoff, Fibonacci & Volunacci in PlayOn the monthly chart, Silver is showing a strong setup for long-term investors. We can clearly identify two adjacent Wyckoff accumulation patterns, signaling institutional accumulation phases.
Price action is following an ascending Fibonacci channel, reflecting a steady bullish structure. After breaking out of the second Wyckoff pattern, a Volunacci projection has formed—pointing toward a potential move to retest its historical high near $48.
This alignment of classic technical patterns with volume-based projection tools strengthens the long-term bullish case for Silver.

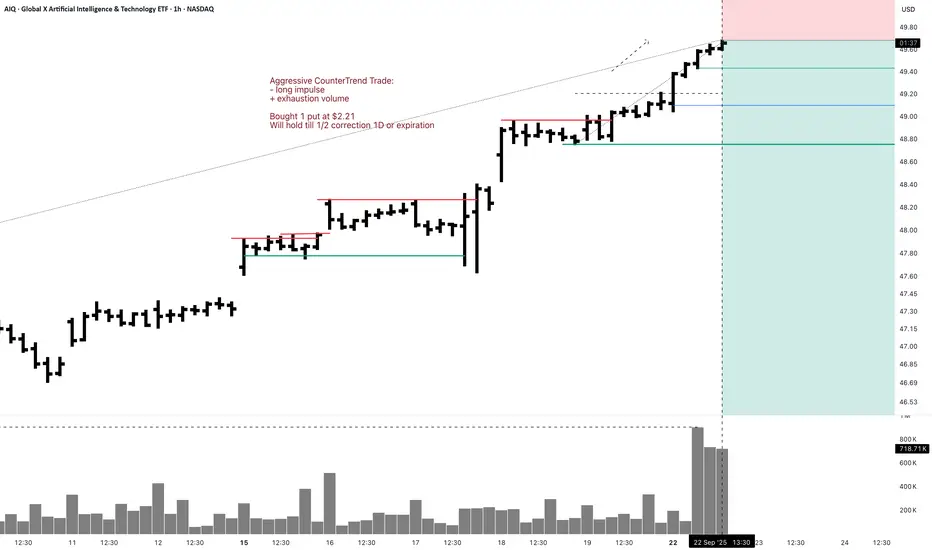
AIQ 1H Swing Aggressive CounterTrend TradeAggressive CounterTrend Trade:
- long impulse
+ exhaustion volume
Bought 1 put at $2.21
Will hold till 1/2 correction 1D or expiration
Daily CounterTrend
- long impulse
+ above expected range
+ exhaustion volume
Monthly CounterTrend:
- long impulse
+ SOS reaction bar
Yearly CounterTrend
"- long impulse
+ T1 level
+ resistance level
- far above T1"
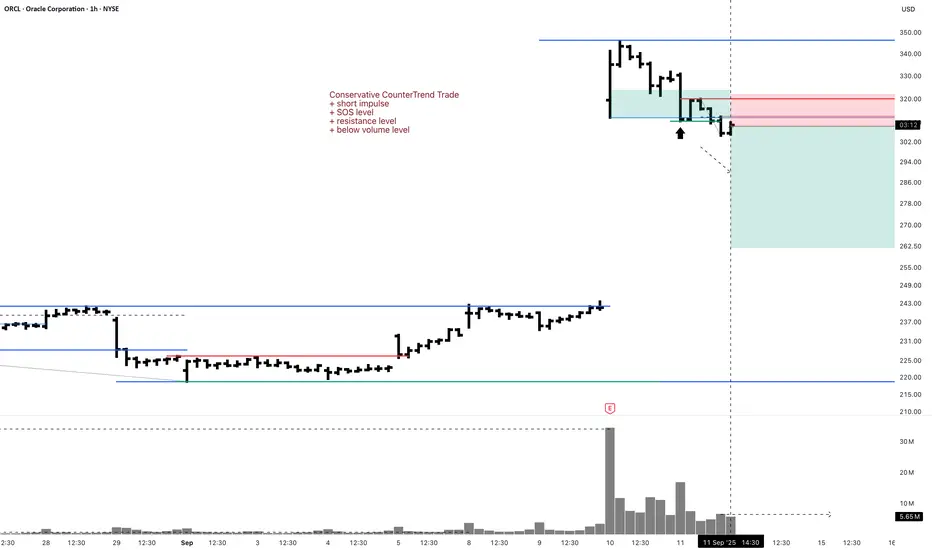
ORCL 1H Short Investment Put PurchaseConservative CounterTrend Trade
+ short impulse
+ SOS level
+ resistance level
+ below volume level
Daily CounterTrend
"- long impulse
+ exhaustion volume
- SOS level"
Monthly CounterTrend
"- long impulse
+ resistance zone
+ volumed interaction bar"
Yearly CounterTrend
"- long impulse
- neutral zone
+ impulse potential reached"
Fartcoin Wyckoff ReaccumulationCRYPTO:FARTCOINUSD looks to be in Wyckoff reaccumulation. Honestly, there’s nothing more to say, the chart speaks for itself.
We’re currently sitting in the spring zone, waiting for a bounce, retest, and move up. In my opinion, that should unfold over the coming months.
The risk here is that the spring I’m seeing might not actually be the spring, in that case, price could go lower. Still, I doubt it breaks below the current low; if it does, I’d say the downside risk sits around $0.5.
The trend is slowly curling upward, and I’m looking at potential targets of:
- Bear case: $2
- Base case: $3
- Bull case: $4
