XAUUSD need to be careful Liquidity is extremely strong in this area, creating a high probability for price to move both up and down to trigger all stop-losses before continuing the downward trend.
What we expect:
The price breaks this box to the upside, grabs liquidity from the minor high, and then resumes the downward movement, aligning with the overall bearish trend for gold.
This scenario highlights the importance of staying cautious and planning trades carefully around these key levels.
Wycoff

Nvidia Wycoff AnalysisA: Find a new resistance, volume was high too
B: Test and failed the resistance
C: Attemp to break but it won't even be near
D: Fail at the support zone
E: Break heavily with a high volume
F?: It could be a pullback to the break to immediatly continue failing to the next support zone

XRP - Next move for xrp! #xrpcommunityXRP - completed its A,B,C correction.
looking for a Elliot wave too 0.65 - this would be the next resistance level's.
first looking to get back into the creek then would expect a breakout!
XRP being XRP, likely it pulls back then stalls with the long grueling lawsuit holding it back
* lawsuit due to come to an end any week - which makes this coin very unpredictable!
*markets are posed for a verdict this month or at least some progress in a bullish direction.
*also waiting on liquidity to transfer into the altcoin market. would expect that to come fully after BTC completes its rally.

Bitcoin breakout! #wycoffBitcoin breaking out of its downtrend following a elliot wave down.
I believe we have just seen the LPS (last point of support) this is where we see BUEC price dips then rally's (back up to the edge of the creek)
still waiting on todays candle for confirmation. once we get back into the creek i would expect the price to finally break out of this range heading too 32-34 range.

BTC/USD Update! Wycoff accumulation. #wycoff #bitcoinFOMC paused rates, and created a bearish move!
anticipated a pull back from this level, I was leaning towards another rate hike just to cause this potential shakeout.
bullish on BTC once we find a bottom.

IOT repeating a move from VEEV in 2017 Very BullishSince I have been using chatGPT, I have taken a very bullish approach to all things ai. This stock is one of the leading in its sector. While charting it I noticed it had the same Chart Pattern as VEEV in 2017. Which went from 17 - 50 in 8 months. So far this stock has spent 4 months under institutional control since it hit its low and started Accumulation. Its low is around $8.50 and looks like its following this pattern almost perfectly.... there are some efficiency differences but somehow gets all the moves still in there. Ill post the Chart here for you to see.
by iCantw84it
03.30.23

TSLA is pushing againTSLA on the 4H chart started 2023 with an upward trend taking it from basically $100 to a
doubling by February 15th then a reversal in a fibonacci retracement fashion to mid level
level by March 10th with a bounce up and then resettled in the same area by April 20th
then holding above the upper of a VWAP band until its reversal a week later. At present,
TSLA is pushing higher and has crossed ever a low VWAP band as well as the mean from the
anchored VWAPs. TSLA reversed on April 27th at the bottom of the high-volume area of the
profile and is now progressing through it. I believe that this is a good long setup. The stop
is VWAP at $178 The target is $ 196 which is the neckline of the head and shoulders from
February as well as the April 1 pivot high. i believe that TSLA has enough interest and
typical momentum to push $10-11 despite headwinds like interest rates and loss of
market share in China and the Nordic countries due to USD strength. The volume indicator
shows relatively high volume compared with this past winter. I think this accumulation will
result in price appreciation as things progress ( as per Wycoff).

BTC Trend continuesHi there this is CAPEFOX Btcusdt Long to 28200 Approximately
Based On Wyckoff
HOPE FOR YOUR BENEFITS;)

BTC short with smart money"Okay, today we can look for a deal on SELL in the desired areas for the BTCUSDT currency pair. We can consider these deals in two stages, which can be pursued until the desired liquidity. Both of these deals are profitable with a 1 to 3 ratio in the worst conditions, which can be seen as a successful trade. These trades are based on the principles of recursive Wyckoff theory in entry points and the Smart Money method."

Ada for daily apportunity to buy"As you can see in the image, this currency is now in the order block area and with the confirmation of the Wyckoff method, it has a high chance of increasing in price to the two liquidity levels above it."

Bitcoin Wycoff Accumulation Phase D into EFor fun i was just re reading up on Wycoffs Methods and decide to put it on the chart to see how it holds up (to the well known photo)
which it really doesnt have to look anything like the photo just so long as those steps or should i say Causes and Effects or Efforts and Results happen, it can better help you know whats happening. and not all of them have to be met, but dont let me bore you. i just wanted this archived to see how it plays out in the future. also, it lines up pretty dang perfect if you ask me. now do i think it rips through phase E to 36k-38,200 give or take? sure. and beyond? welp, it still could reject there an enter back into the "accumulation zone". esp if my thoughts on recession (light one) comes about. anyway no price targets really just archiving this to see it in the future. cheers

XRP analysis whilst listening to mike maloney GM!
Getting close to some serious moves in XRP. predicting take off begining of june based of this wycoff acumilation.Watching Mike Maloney latest video. rather fitting background. #aligment

Gold Bear Case - Wyckoff Distribution Pattern - Posting for funThis chart is for entertainment purposes only and setups up a possible bear scenario. I'm not an expert at distribution patterns but I thought it would be fun to see if this might fit the pattern.
I don't think gold is excluded from the 'everything bubble' that the Fed is trying to pop. The Fed has been very clear that interest rates are going to go higher and stay higher for a long time. Gold does not yield interest payments and so people are going to put their money in things that do (e.g. treasury bills paying 4-5% for a low risk return).
I would not be surprised to see a large correction in gold to prices below or at $1k.
I'm neither bearish or bullish on gold.
Enjoy.

28 % profit opportunity In phase D of the Wyckoff scheme. I would buy ONLY after the price passes the High of SOW. The TP would be based on the volume profile of a higher timeframe.
Good luck.
-m

LINKUSDT: Wyckoff analysis 4hrHello friends. According to Waykoff's method, we are witnessing the formation of its phases, it is expected to move towards phase D and E, so such a movement is not unexpected for this currency.


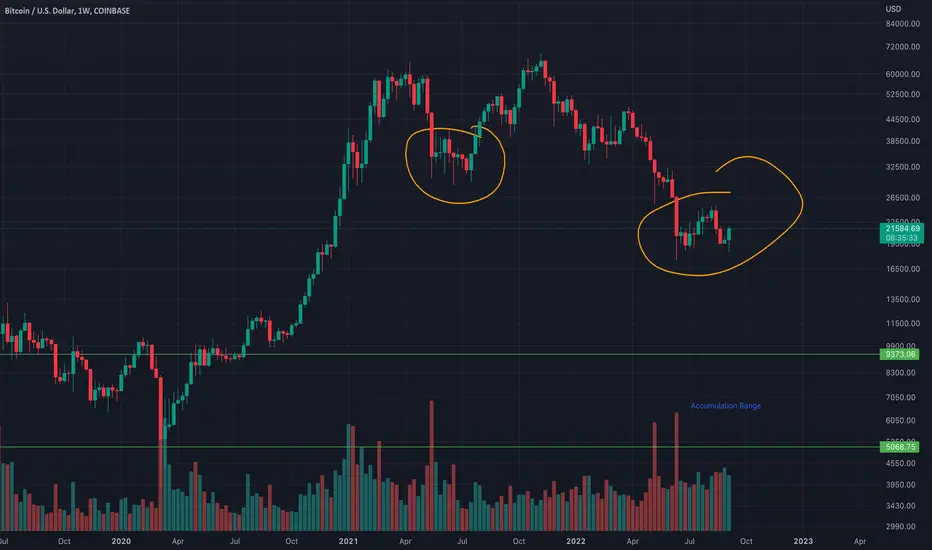
Wyckoff Accumulation going into 2023A rough estimate of a Wyckoff Accumulation going into 2023, the in between movements of the accumulation is suppressed just general direction and targets

Looks like textbook Wyckoff or Massive rug pullEither a good looking bottom or a massive rug pull. Worth dipping my toes in.
Bitcoin Wycoff AccumulationBitcoin is playing out a picture perfect Wycoff Accumulation phase so far. will be watching for a rejection at range highs and then a spring to 15-16k.
The accumulation phase is a sideways and range bound period that occurs after a prolonged downtrend. This is the area where larger players try to build positions and shake out smaller fish without causing much of a further drop in price, or the beginning of the new trend. They aim to maintain this phase until all their positions have filled, hence the name “accumulation.”
According to Wyckoff, there are six distinct parts of the accumulation phase, all with an important function. Below are all phases and labels for reference.

AXS/USDT Wycoff AccumulationAXS/USDT
🟢entry: $47.660- $44.495
❌stoploss: $39.400
🎯tp1: $124.605
🔼potential %profit: +161.45%
🔽potential %loss: -17.33%
r/r: 9.32
Hi Everyone,
🧩AXS appears to be undergoing Wycoff Accumulation. During Phase A, we saw a -52% mark-down with moderate volume to Preliminary Support (PS) and a -67% mark-down to Selling Climax (SC) with moderate-high volume. After establishing a tight range for 2 weeks after SC, an automatic rally began with high volume.
🧩After the first AR, Phase B began, establishing a much larger trading range. Within Phase B, we see 2 Spring Tests (ST) with moderate-low volume. Following the second ST, there was another large AR with high volume. Beginning with the second AR and through today’s date, we see sustained moderate-high volume, especially compared to the previous trading volumes. This can be interpreted as large operators fully committing to large-scale accumulation.
🧩As price is currently at the bottom of the trading range, it is probable that we are coming to the end of accumulation by large operators and will see one last ST to establish the final shake-out before a mark up to begin Phase D.
🧩Based on this analysis, I am entering a swing long. I will enter at the bottom of the trading range and patiently hold the position, watching for price to demonstrate LPS and SOS to confirm my analysis. I will sell half of the position in the annotated range of anticipated distribution and keep half the position to be placed as price establishes the actual distribution range.
Check back for updates as the position progresses.
Feedback and constructive criticism is always appreciated.
✌️All good luck and always practice strict risk management!

DraftKings Distribution. RIP Cathie Wood.How does an esteemed invested such as Cathie Wood not see the clear distribution of this chart? In her ARKF fund she has over $205 million dollars invested in this company, and another $205 million in her ARKK fund. Ouch Cathie. Ouch.

Climb slowly to 97On 4h TF
Some good signals
- Positive divergence RSI
- Morning star
BINANCE:SOLUSDT is climbing to 97, perhaps
What next, wait and see

BTC in last LPS backup action before going higherBTC appears to be in the middle of Phase D, and more specifically experiencing backup action before a pump. This is usually a good point to go long if you missed the lower levels.
Not financial advice, DYOR.
