price reductionWe can predict a price decline to the support floor in the inverted triangle pattern.
X-indicator

Bullish Rebound at $1.1590! Is the Next Major Breakout Imminent?🚀 EUR/USD: Bullish Rebound at $1.1590! Is the Next Major Breakout Imminent? (15-Minute Analysis)
✍️ Attractive Description
The Euro/US Dollar (EUR/USD) pair is at a critical juncture! Following an initial surge that marked a strong Break of Structure (BOS) and tagged the $1.1615 high, the price has executed a healthy Pullback to the key $1.1590 support level.
The market is currently respecting this crucial support zone, signaling that Buyers remain active and engaged. The previous $1.1607 breakout level has now reverted to immediate resistance, creating a clear battleground.
What's Next?
Bullish Scenario: If the price holds above $1.1590, we can anticipate a move to challenge and break the $1.1607 resistance, aiming to re-challenge the recent high of $1.1615.
Immediate Safety Net: The $1.1590 level is the last line of defense for the buyers. A break below this support would suggest potential weakness in the immediate trend.
Why This Chart Matters: This is a classic BOS and Retest scenario, potentially building momentum before a larger, sustained Bullish Move. Keep your eyes glued to $1.1607—that is the next door the market needs to unlock!

Runtime Error- Rapid ORB ProIf you facing this issue. please go the video this will solve the issue. this is just a memory buffer limitation. We just need to reset the buffer.

Can Gold Reach $4300? Strategy Update, Please Check BackRising market expectations for a Fed rate cut are a key driver of gold's rise. Simultaneously, ongoing global political and geopolitical risks have further increased demand for gold as a safe haven. Overall, gold's upward momentum has strengthened after a previous moderate rise, suggesting the possibility of further gains.
The upside resistance for gold can be seen around $4250-60, near the upper Bollinger Band on the daily chart. This is also near the intraday high. The 4-hour chart shows significant resistance in this area. Only a break above this level could lead to the $4290-4300 psychological level, which is near the upper Bollinger Band on the monthly chart. If the bulls fail to break through effectively during the US session, shorting at higher levels remains the preferred strategy.
For gold, during the European and American sessions, we need to pay attention to support levels: the first is $4215-25, where buying in batches is possible. Strong support lies at $4210. If this price level holds, we maintain a bullish outlook. Blindly chasing the upward trend is unwise. Trading based on structure and key points is crucial for consistent and stable growth.
For gold this week, if the initial upward momentum continues, reaching 4300 shouldn't be difficult, and many are already accepting this. The expected target for this week's rise is 4290-4300. The market is constantly changing; be a follower, not a die-hard. The strategy has been updated again. If you need to recover significant losses or obtain accurate trading signals, find the channel entry and contact me. Let's work together to flexibly and steadily pursue higher profits in the ever-changing market!

#Bitcoin HTF IdeaThey haven’t allowed the price to make even a single higher high for about 50 days.
In an environment like this, the HTF looks completely negative.
The green box I marked with an alert below will be important — I’m waiting for that area.

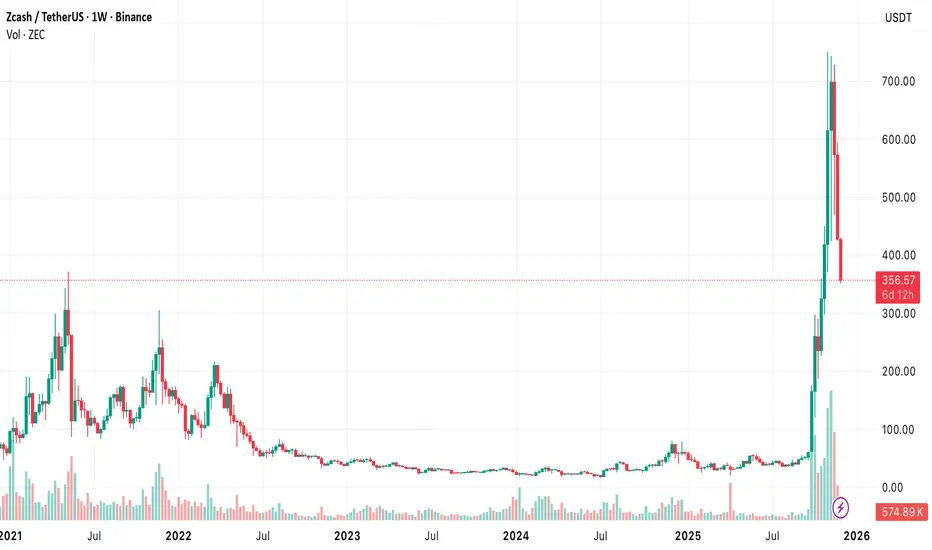
ZEC/USD – TradingView Script-Style Summary// ZEC/USD – Market Summary
// Trend: Bearish below 20-day EMA
// Volatility: Elevated
// Bias: Neutral → Bearish
// STRUCTURE
Price remains below EMA20 (437.28), forming lower highs + lower lows.
Momentum weak (RSI ~36), MACD negative but stabilizing.
Bollinger Band width ~138.51 → high volatility.
// KEY LEVELS
Support 1: 351.28 (daily low)
Support 2: 320.00 (psychological)
Support 3: 220–330 (selloff zone)
Resistance 1: 430.16 (swing high)
Resistance 2: 437.28 (EMA20)
Resistance 3: 512.37 (upper BB)
Fib Target: 577.90 (61.8% retracement)
// BULLISH TRIGGER
Daily close > 437.28 (EMA20) + rising volume
→ Targets: 500–600 range
→ RSI > 50 required for confirmation
// BEARISH TRIGGER
Break < 351.28 (daily low)
→ Targets: 320 → 260 → 220
→ RSI drop < 30 increases downside momentum
// NEUTRAL ZONE
351.28–430.16
Trend consolidation unless EMA20 is reclaimed.
// BIAS
Bearish until EMA20 is reclaimed on strong daily close.
GU 12/1overall = downtrend...
idea 1
1 hour - GU is currently in a downtrend retracement, which has pulled back into the 50%–61.8% Fibonacci zone, a typical reaction area for continuation setups.
Price may continue moving sideways or slightly upward until it touches or approaches the red downward trendline.
If bearish pressure returns from that zone, the next leg down can extend toward the 127% Fibonacci extension or beyond.
Take-profit target 1: @ 127% extension (lower gold box marked 127-161)
idea 2
1 hour tf -
If price continues pushing higher and breaks above the red descending trendline, the corrective structure may evolve into a W-pattern (double-bottom reversal).
A confirmed breakout and retest would support a shift toward a bullish recovery, targeting two major upside expansions:
Take-profit target 1: +210 pips
Take-profit target 2: +440 pips
(Both zones are represented by your blue boxes.)
share your thoughts. take care

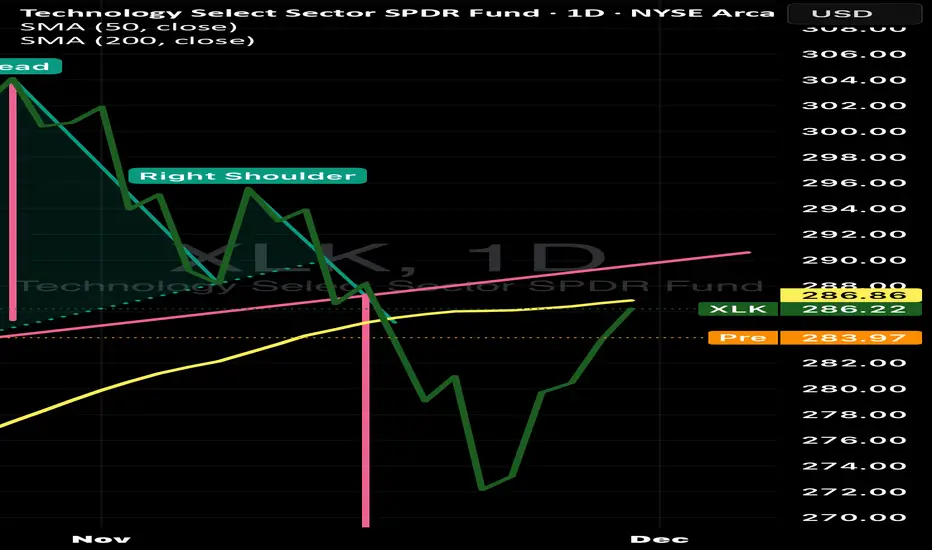
A H&S Pattern has formed in the XLK. What does it mean?A head-and-shoulders pattern usually signals a potential trend reversal from bullish to bearish.
What to watch (triggers & confirmation)
1. Neckline break on volume — primary sell signal. Wait for a daily close below $283–285 with higher volume for confirmation.
2. Retest behavior — if price breaks and then returns to the neckline and is rejected (fails to reclaim it), that’s a strong continuation signal.
3. Momentum indicators — look for RSI falling below 50 and MACD turning bearish to add confidence.
4. 200-SMA reaction — a bounce there could be a good place to trim or hedge; a break below it strengthens the move toward the $265 measured target.
5. Market breadth / sentiment — if broad market or sector rotation accelerates away from tech, the pattern’s odds rise; if the market rallies, pattern may fail.
Do you agree? Any in contrary’s comments?
BTC/USD: Rebound Fades as Liquidations Spike and Macro Pressure Last week, BTC/USD attempted a corrective bounce within the broader medium-term downtrend. After reversing near 80,600, the price moved toward 91,000 as markets sharply increased expectations of a December Fed rate cut. Dovish comments from Fed officials, softer wholesale inflation (2.9% → 2.6%), and slowing retail sales (0.6% → 0.2%) pushed the FedWatch probability of a cut from 30% to 87%, boosting demand for non-dollar assets.
However, the rebound was short-lived. BTC failed to hold above 91,000 and resumed its decline, now trading near 86,500, down more than 5% intraday.
Analysts point to technical triggers behind the sell-off: the liquidation of several large long positions cascaded across the market, reaching a total of $646M, with ~90% longs washed out.
Additional pressure came from:
• Yearn Finance hack (~$9M stolen, incl. 1,000 ETH moved via Tornado Cash)
• China reaffirming a full nationwide ban on crypto trading, stating digital assets have no legal-tender status and cannot be used in commerce
These events fueled risk-off sentiment across the market.
⸻
Support and Resistance Levels
BTC reversed from the middle Bollinger Band near 91,000 and is now attempting to consolidate below 87,500 (Murray ).
A firm breakdown below 87,500 would target:
• 81,250 (Murray )
• 75,000 (Murray )
A bullish reversal requires a breakout above 93,750 (Murray , 61.8% Fib), which would open the way toward:
• 100,000 (Murray , 50% Fib)
• 106,250 (Murray )
Indicators remain aligned with the downtrend:
• Bollinger Bands slope downward
• Stochastic points lower
• MACD stays negative
Resistance: 93,750 • 100,000 • 106,250
Support: 87,500 • 81,250 • 75,000
⸻
BTC/USD Trading Scenarios
📉 Primary Scenario — SELL STOP
• Entry: 85,800
• Take Profit: 81,250 • 75,000
• Stop Loss: 89,100
• Timeframe: Weekly
• Bias: Bearish continuation below 87,500
📈 Alternative Scenario — BUY STOP
• Entry: 93,800
• Take Profit: 100,000 • 106,250
• Stop Loss: 88,400
• Bias: Breakout above resistance

EURGBP oversold bounce resistance at 0.8800The EURGBP remains in a bullish trend, with recent price action showing signs of a corrective pullback within the broader uptrend.
Support Zone: 0.8745 – a key level from previous consolidation. Price is currently testing or approaching this level.
A bullish rebound from 0.8745 would confirm ongoing upside momentum, with potential targets at:
0.8800 – initial resistance
0.8830 – psychological and structural level
0.8840 – extended resistance on the longer-term chart
Bearish Scenario:
A confirmed break and daily close below 0.8745 would weaken the bullish outlook and suggest deeper downside risk toward:
0.8727 – minor support
0.8700 – stronger support and potential demand zone
Outlook:
Bullish bias remains intact while the EURGBP holds above 0.8745. A sustained break below this level could shift momentum to the downside in the short term.
This communication is for informational purposes only and should not be viewed as any form of recommendation as to a particular course of action or as investment advice. It is not intended as an offer or solicitation for the purchase or sale of any financial instrument or as an official confirmation of any transaction. Opinions, estimates and assumptions expressed herein are made as of the date of this communication and are subject to change without notice. This communication has been prepared based upon information, including market prices, data and other information, believed to be reliable; however, Trade Nation does not warrant its completeness or accuracy. All market prices and market data contained in or attached to this communication are indicative and subject to change without notice.

CADCHFHello traders.
Today we’ll walk through a thoughtful market analysis, starting on the 15-minute timeframe.
A bullish trend is gradually forming, presenting a meaningful opportunity for a buy position — but as always, we approach it with confirmation, not haste.
Right now, price is advancing from the lower boundary of the Bollinger Bands, moving steadily toward the upper band.
This upward momentum is also supported by the RSI, which is aligning with the developing trend and reinforcing the probability of continuation to the upside.
If we look just below the current price, we notice a reliable support region — a zone where buying interest has previously shown strength.
Because of this, the likelihood of price breaking deeply beneath this area appears limited, adding confidence to our scenario.
Our next expectation is a measured move upward toward the resistance zone.
Within the ellipse marked on the chart, the potential entry and exit boundaries are defined — offering a structured area for trade planning rather than emotional decision-making.
At the end of this video, you can also observe the publication time of this analysis.
Remember — trading at its core is not about speed.
It’s about patience, clarity, and respecting structure.
Wishing you balance, discipline, and consistency in your trades.

Walmart Stays Strong, Ready for the Next LeapWalmart is proving once again why it remains one of the strongest companies in the world. Even as many retailers struggle, Walmart continues to grow, innovate, and win the confidence of investors.
Its stock is already up 22% this year, beating the S&P 500, and many signs show that the company could stay strong in 2026 as well.
◉ Why Walmart Is Winning
Walmart has become a perfect mix of traditional retail and modern technology.
Strong results:
● Revenue up 5.8% year over year
● Operating income up 8%
● EPS rising from $0.58 to $0.62
Market share growth:
Walmart gained more customers in grocery and general merchandise. Even higher-income shoppers have been spending more at Walmart.
E-commerce strength:
Online sales grew 27% as Walmart expands its online offerings and reaches customers beyond its stores.
Growing advertising business:
Walmart’s ad sales increased 53% in the latest quarter, turning it into a serious player in retail advertising.
◉ Technology Is Shaping Walmart’s Future
Walmart is investing heavily in technology to stay ahead:
● Partnering with OpenAI to let customers use ChatGPT for shopping and checkout
● Training developers to code faster with AI
● Automating supply chains and warehouses
● Buying Vizio to strengthen its advertising ecosystem
These changes are helping Walmart protect its low-price model while moving closer to becoming a tech-driven retailer.
◉ Leadership and Listing Changes
Two important updates were recently announced:
● CEO Doug McMillon is stepping down after ten years
● John Furner, head of Walmart U.S., will become the new CEO
Walmart also announced that it will move its stock listing from the New York Stock Exchange to the Nasdaq. This connects Walmart more closely with tech-focused indexes and funds.
◉ Dividend Stability
Walmart is a Dividend King, raising its dividend every year for more than 50 years. This adds strong stability for long-term investors.
◉ Technical Outlook
● From a technical point of view, the stock recently broke out of an ascending triangle pattern and touched a new all-time high.
● If this momentum continues, Walmart could see another strong rally in 2026.
◉ Final Thoughts
Walmart is winning today and building an even stronger position for the future. With solid financials, strong e-commerce growth, expanding advertising revenue, and steady leadership changes, the company is well-placed for 2026 and beyond.

BTC Dip Resilience: A Healthy Pullback Inside Structure - Dec 1 BTC is dipping again today, but the price action remains orderly and far from bearish breakdown territory. Despite the volatility, BTC continues to hold above the previous cluster of local lows, preserving its higher timeframe structure. More importantly, price is still sitting comfortably within a key support band that has acted as a demand pocket throughout this entire consolidation phase.
The market has not shown any signs of structural damage. Sellers pushed into support, but so far there has been no follow-through or momentum shift that would indicate trend exhaustion. Instead, the reaction looks controlled, with buyers stepping in each time price revisits this region. This kind of behavior usually reflects absorption rather than weakness.
In the bigger picture, this is the type of pullback you expect during a mid-cycle correction: sharp enough to unsettle sentiment, yet technically intact and anchored by strong underlying demand. Until we see a break beneath those prior lows, the path of least resistance remains upward.
Overall, the chart still leans bullish. The current dip is behaving like a constructive reset, not the start of a deeper unwind.

XAU/USD M15 BULLISH CONTINUAITION📌 GOLD Market Idea (Clean & Simple) 🟡 GOLD is showing bullish momentum The chart suggests that price recently bounced from a strong demand zone (pink highlighted area). This shows buyers are active and defending this level. 📈 Potential Upside Target If buyers continue to hold this zone, GOLD may aim for the next resistance area around 4328–4330. This matches with your marked “Target Point” and upward arrow movement. 🛡️ Key Support Zone The pink zone around 4220–4230 is acting as a strong support. If GOLD stays above this area, the bullish idea remains valid. 📊 Summary (Emoji Style) 🟡 Support Holding Strong 🛒 Buyers active after bounce 📈 Upside target: 4320–4330 zone 🛑 Invalidation: Break below 4220

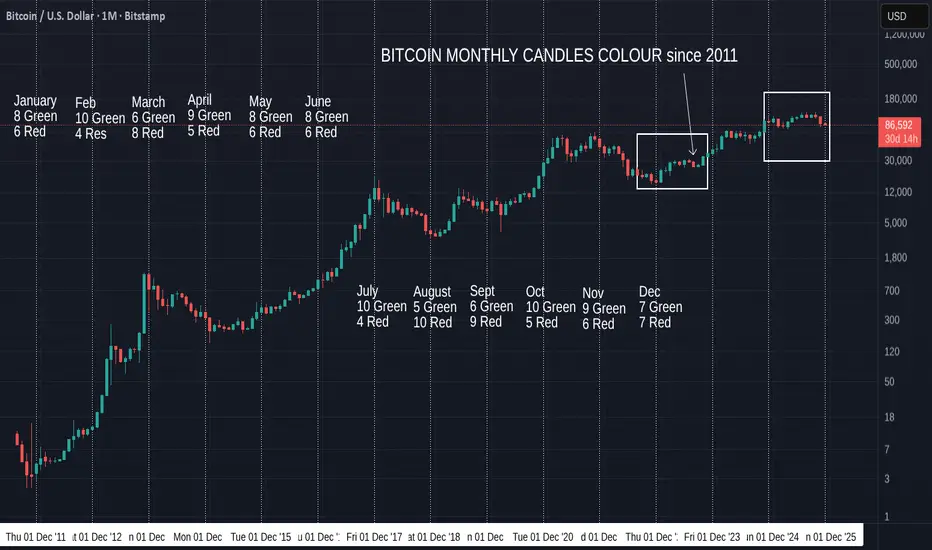
Bitcoin Monthly Candle Close Color since 2011 and patternsNovember closed RED as expected and so we have continued to follow Sequence in the left Box, mentioned in the October post.
The left Box shows the only similar monthly Candle sequence, similar to the one we currently have. If you look closely, it is also a very similar "Curve" shape. Descent to low, rise, flatten out.
The Candle Sequence to see is Red, Green. 2 Red. 4 Green, 1 red, 1 Greeno 1
red
That Sequence was followed by a larger Red Candle, which we have just also done.
The Thin down facing arrow in the left Box, points to the equvilant candle to the one we just closed, thought the month was August and not a November.
The left box starting in September 2022 and the Right Box starts in December 2024.
These Sequences run for 11 Months so Far..
This is the only 2 occasions this sequence has ever happened in Bitcoin history...and they are Both in the same "Bull Run"
And I will just mention that the Left Box was the recovery period after the 2022 Bear market.
A Very positive period.
If we continue this Sequence, we should see a Green Candle in December, though maybe not a large one. Some charts point to a Red start to December, so remain cautious.
We should also remember that a pattern workss untill it Stops...but the longer it runs, the higher the chance of that point being reached.
Just to Recap from the October post of this Series.....
"The Red November in 2011 was the bottom and was the start of Bitcoins 2 year push to ATH.
The Red one in November 2022 marked the Bottom of the Bear, though December was red but a small candle.
Nearly half of the Red Novembers called the Bottom of a Bear, a turning point in market behaviour." (There had been only 5 Red Novembers at the time of writing)
What is also very interesting is how the November 2022 Red candle was approx -27% draw down. (Wicks included) -> the following December in 2022 closed a small Red candle.
The Red November we just closed was also approx -27%
However, To follow the Color sequence, we will expect a Green December.
Of the Previous Red NOVEMBER closes, we have only ever had ONE Green December, way back in 2011,
The Odds do point to a Red December close....but hopefully a small one.
If this happens, the color sequence gets broken but I will look at what happened in early 2023 as a possible follow on. The November, December, January candles for sure....
Looking Forward. Previous December closes.
7 Green to 7 Red - A 50 - 50 mix.
Of the previous 7 Red December Closes, 4 were followed by a Green January, the last one being in December 2022 and was followed by a Lovely Green January, marking the start of the current push higher by Bitcoin from 15K usdt low to over 120K usdt.
That January Candle was over 50% rise.
Only one Red December led us into a Deep Bear market, the others signalled change.....
So, While the odds, technically, point to a Red December close, to follow previous moves and sentiments, this may not be a bad thing.
A Red December would break the sequence we have been talking about, as the next in sequence is a GREEN candle. And so were the next 6 Months.
So, December Close will answer Many questions and is, once again, a pivotal month. The Sentiment for the entire year to follow will be set by this months Candle Close..
We currently have a number of pointers suggesting this is an End to a "Bear"....and this Draw back right now has seen PA fall below a number of Key support levels but interestingly, we have got no where near the "traditional " - 80% Bear draw down.
Very confused signals, hinting at moves in either direction.
We have to wait......as ever.... But I am VERY BULLISH
As it stands, a Red or a Green December has the potential to be Good, providing that, obviously, a BEAR market is not confirmed.
My preference is fr a small Red candle this month........
USDCAD can break channel resistance.The USDCAD rebound from monthly lows below 1.3940 on Friday has stalled beneath the significant 1.4000 level on Monday. The pair is hovering above 1.3980 at the time of writing. However, higher oil prices and market expectations of imminent Fed rate cuts are restricting further upward movement for now.
Additionally, the Canadian Dollar remains supported by the upbeat Canadian Gross Domestic Product (GDP) figures released on Friday. The Canadian economy rebounded with unexpected strength in Q3, growing at a 0.6% quarterly rate and recovering from a 0.5% contraction in Q2. YoY, GDP grew 2.6%, surpassing expectations of 0.5% growth and following a 1.8% decline in the previous quarter.
Technically, USDCAD is trading within a support and resistance channel, following a pattern of lower lows and lower highs. On Friday, it rebounded from its support zone and is currently trading near its 20-day Exponential Moving Average (EMA).
If the pair breaks above the 20-day EMA at 1.3986, it is likely to reach the channel resistance at 1.4004 before potentially dropping a few pips toward the support zone. In the coming days, we expect it to rebound from the support zone, break above both the 50-day EMA and the channel resistance at 1.4004, and start a new upward trend toward the 1.4050 level.


An Attempt at Seasonal Market Growth and BTC RollbackTo date, we have reached another bifurcation point in the market and it's time for another review. So far, there is a share of positivity in the market situation. As I wrote earlier, there is strong medium-term support for BTC in the 85-90k zone, from which a rollback is likely. Unfortunately, last month we broke through the 85k level, which is a signal for a possible test of 75k in the spring. However, the probability of a rollback from 85k to 90-100 still prevails. The broadcast opened the month ambiguously. According to Asian time, the opening is in the negative zone below 3000, higher in the neutral zone at GMT. I think the market will move this month based on the bullish BTC signal, and the coins will continue to move in different directions.
The seasonal growth period in the first half of December is also a positive signal. Once again, I would like to draw attention to the background trigger used by the United States to manipulate the market - brent oil. At the last bifurcation point, prices still collapsed, despite the positive data on US stocks, to which ETH immediately reacted with a consolidation below 3k, as I warned in the review. The current monthly candle opened above the interim support of $ 62.5, against which there is a signal for growth in the first half of the month at least.
As a result, we have signals for new growth waves for individual altcoins that have reached supports and have high growth goals, as part of seasonal growth, attempts to rollback BTC with oil and rollback according to the annual schedule. However, most of the alcoins, especially those with high capitalization or upcoming aggressive issuance, will not have time to show significant growth in this short period and will continue the medium-term bearish trend. Be careful with new purchases in the next couple of weeks. Today - tomorrow is the time when coins draw a shadow down the new monthly candle, but starting tomorrow evening or Wednesday, the probability of a reversal for individual coins will increase. If positive oil data is released in the middle of the week, then the growth of the crypt is likely to accelerate steadily by the end of the week, with a continuation in the next weekly candle. Next, the opening zone of the second half of the month will be of great importance.
For altcoins, in the event of a reversal attempt, the minimum target will be to overshoot the last monthly candle. For work today, I am considering the TURTLE NTRN ENSO VIC MITO BMT HOOK first of all. These tools were recently listed on binance, which reduces the threat of delisting hanging over projects from 20-22. The issue of these instruments is also smooth, which reduces the likelihood of further large drawdowns. Given today's circulating supply, these instruments are already in an oversold position and the likelihood of a reversal to growth at the slightest provocation from the market prevails. They also previously provided strong technical signals for growth up to 300%+, which will be worked out in the medium term.
Secondly, I am considering CHESS UTK COS DATA QUICK FIO for scalping, which can give new growth waves of up to 40-50% at least, but I recommend using a smaller position size for them. CHESS has been assigned the monitoring tag, but there are strong technical signals for a 0.1 retest, which is why a large exit pump is likely. After that, I will no longer consider using the token.
Gold Holds Near Channel High as Fed Cut Bets Weaken DollarGold trades around a six-week high near 4,250 as expectations of a December Fed rate cut and a softer dollar keep real yields under pressure.
Structural support comes from persistent central-bank buying, resilient investment demand, and constrained mine supply, according to recent World Gold Council data.
Technically, XAUUSD remains in a well-defined rising channel on the 1-hour chart, with the main scenario pointing toward 4,268–4,282 and potentially 4,298 if momentum persists.
Key support lies at 4,241 and 4,215; a break below this zone would open a corrective move back toward the channel midline near 4,200 in an alternative, lower-probability scenario.
Upcoming US data on manufacturing, spending, housing and the Fed’s Beige Book will shape the path of real yields and risk appetite, keeping gold sensitive to any surprise that challenges or reinforces the December cut narrative.
Read full article here:
erranteacademy.com

MARICO IS READY TO IGNITE A BULL FIRE!This is the daily timeframe chart of Marico.
The stock is approaching a strong support zone near the 700–710 level and resistance 780-790 and lop resistance near the 740-750.
If Marico sustains above this zone, it may potentially move towards higher price levels.
Thank you.


EURNZDPrice Action Trading is a method of financial market analysis where traders make buying and selling decisions solely based on the asset's price movements over time, without relying on technical indicators.
It's essentially the art of reading a "naked" or clean chart to understand the psychology and behavior of market participants.

Polkadot Crashes to 2.00 – Breakdown Fully ConfirmedDOT just dropped -7.5% and is now sitting at 2.04, confirming a full structural breakdown. No bullish MSB in sight, and price continues setting lower lows.
RSI is deeply oversold at 24, but MACD still shows no reversal signal. Until bulls flip 2.60–2.80, this trend remains heavily bearish.
Momentum is dying fast. Breakdown is clean and active.
Bias: Bearish
Pair: DOT/USDT
Timeframe: 12H
This is not financial advice, only data analysis. Please consult a qualified financial professional for personalized guidance.
