Bitcoin coming swing move from <89000 To 95000/96000>In this video, I am looking at the short term fundamentals (FOMC), that could be impacting Bitcoin higher from <89000-90000> level to 95000 ^ possibly 96/97000.
A 4Hr trigger has already occured to take the move. I will attempt to support the entry by showing how to take a 15/45min trigger to long going into FOMC in the next video.
Profitable Trading.
Summerset
____________________
High Risk Investment Warning:
Financial products are traded on margin, and carry an extremely high degree of risk. It is very possible to lose all your capital trading them. Financial Products such CFDs (Contracts for Price Difference) are considered the most volatile and risky of the majority of financial assets, and as such will NOT be suitable for everyone to trade. Most importantly, CFDs are derivative products of, / (and are) impacted by several financial issues and asset classes. Because several complex fundamentals become intertwined. It becomes very hard, even for professionals to assess and acutely understand ALL the risks involved. Under volatile market conditions, Losses could well exceed the account’s initial deposits. Therefore Please think very carefully whether such trading portfolios' suit you. Take into consideration all of your personal relevant circumstances as well as your personal resources, and DO NOT POST your entire account balance to meet margin requirements. Clients can minimize their level of risk exposure by requesting a change in leverage limits. For more information on this please refer to your broker’s Risk Disclosure. Further, do not wavier seeking independent expert and legal advice on trading issues and their suitability to yr geographical location.
-------------------------------------------------------------
X-indicator

EURAUD further selling pressure below 1.7630 resistanceThe EURAUD currency pair continues to display a bearish outlook, in line with the prevailing downward trend. Recent price action suggests a corrective pullback, potentially setting up for another move lower if resistance holds.
Key Level: 1.7630
This zone, previously a consolidation area, now acts as a significant resistance level.
Bearish Scenario (rejection at 1.7630):
A failed test and rejection at 1.7630 would likely resume the bearish momentum.
Downside targets include:
1.7500 – Initial support
1.7456 – Intermediate support
1.7380 – Longer-term support level
Bullish Scenario (breakout above 1.7630):
A confirmed breakout and daily close above 1.7630 would invalidate the bearish setup.
In that case, potential upside resistance levels are:
1.7660 – First resistance
1.7690 – Further upside target
Conclusion
EURAUD remains under bearish pressure, with the 1.7630 level acting as a key inflection point. As long as price remains below this level, the bias favours further downside. Traders should watch for price confirmation around that level to assess the next move.
This communication is for informational purposes only and should not be viewed as any form of recommendation as to a particular course of action or as investment advice. It is not intended as an offer or solicitation for the purchase or sale of any financial instrument or as an official confirmation of any transaction. Opinions, estimates and assumptions expressed herein are made as of the date of this communication and are subject to change without notice. This communication has been prepared based upon information, including market prices, data and other information, believed to be reliable; however, Trade Nation does not warrant its completeness or accuracy. All market prices and market data contained in or attached to this communication are indicative and subject to change without notice.

Breaking: Wave Life Sciences Ltd. (WVE) Spike Ovr 150%In what came as a shock, Wave Life Sciences Ltd. (WVE) broke out of a bullish symmetrical triangle surging almost 150%, extending the gains to premarket session.
NASDAQ:WVE shares are up 4% in Tuesday's premarket session aiming for a move to the $50 resistant. With increased momentum NASDAQ:WVE stock is poised to continue its bullish sojourn.
In another news, Wave Life Sciences Ltd. (Nasdaq: WVE), announced today that it has commenced an underwritten public offering of $250 million in aggregate of its ordinary shares, and, to certain investors that so choose in lieu of ordinary shares, pre-funded warrants to purchase ordinary shares. In connection with the offering, Wave intends to grant the underwriters a 30-day option to purchase ordinary shares in an amount up to an additional 15% of the total amount of ordinary shares and shares underlying pre-funded warrants sold in the public offering on the same terms and conditions. All of the securities in the offering will be sold by Wave Life Sciences.
About WVE
Wave Life Sciences Ltd., a clinical-stage biotechnology company, designs, develops, and commercializes ribonucleic acid (RNA) medicines through PRISM, a discovery and drug development platform. The company’s RNA medicines platform, PRISM, combines multiple modalities, chemistry innovation, and deep insights into human genetics to deliver scientific breakthroughs that treat both rare and prevalent disorders.

EFG Holding (HRHO) – Weekly Long Setup: Breakout PotentialEFG Holding (HRHO) – Weekly Analysis
Price is currently moving inside a long-term ascending channel, respecting both trendline support and Ichimoku cloud structure. After the recent correction from the 28.90 zone, the price is stabilizing above the trendline and inside the cloud — a typical consolidation before a potential continuation move.
📌 Entry Zone
Entry #1: Around 26.40 (current market price)
Entry #2 (Aggressive): 24
🎯 Take-Profit Targets
TP1: 29.90
TP2: 31.91
TP3: 34.93
Targets match major resistance levels + previous swing highs on the weekly chart.
🛡️ Stop-Loss
Below 23.20 (trendline + Ichimoku cloud support)
🔍 Technical Signals
Price holding the Weekly Kumo (Ichimoku) → bullish structure maintained
Supertrend still positive on weekly timeframe
MACD showing early signs of momentum recovery
StochRSI in oversold reversal zone → possible upside push
📈 Bias
Bullish as long as price remains above the ascending trendline and weekly cloud.
This setup becomes stronger if we get a weekly close above 29.00, confirming continuation toward TP2 & TP3.
⚠️ Disclaimer
This is not financial advice. Purely educational technical analysis based on chart structure.

XAUUSD Buy Signal ScalpingGOLD. Buy 4204
TP¹ 4408
TP² 4211
TP³ 4214
TP⁴ 4217
SL...4194
Not a financial advice
USE PROPER MONEY MANAGEMENT CONSISTENCY

#MYRO/USDT Breaks Out of Inverse Head and Shoulders#MYRO
The price is moving in a descending channel on the 1-hour timeframe. It has reached the lower boundary and is heading towards a breakout, with a retest of the upper boundary expected.
We are seeing a bearish trend in the Relative Strength Index (RSI), which has reached near the lower boundary, and an upward bounce is expected.
There is a key support zone in green at 006770. The price has bounced from this level several times and is expected to bounce again.
We are seeing a trend towards stabilizing above the 100-period moving average, which we are approaching, supporting the upward trend.
Entry Price: 0.006940
First Target: 0.007170
Second Target: 0.007619
Third Target: 0.008123
Remember a simple principle: Money Management.
Place your stop-loss order below the green support zone.
For any questions, please leave a comment.
Thank you.

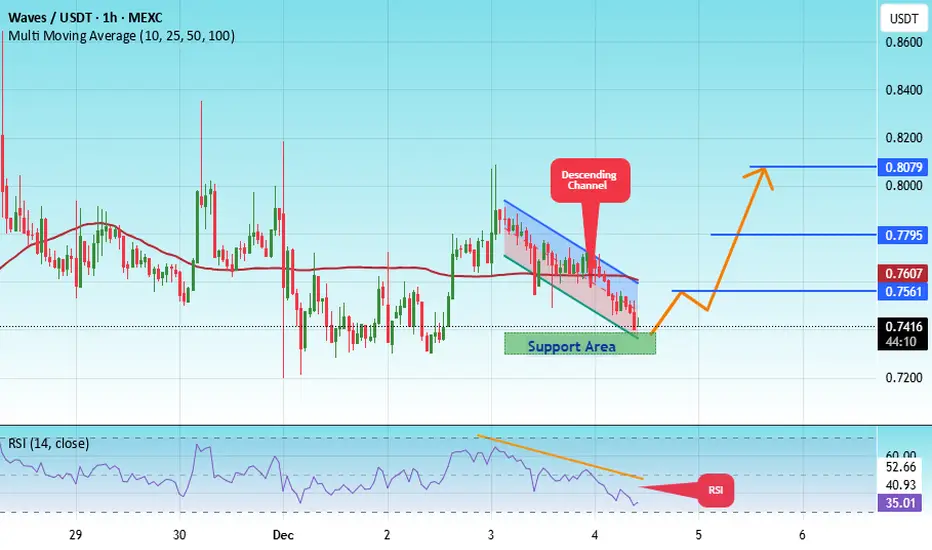
#WAVES/USDT is currently strongly bullish#WAVES
The price is moving in a descending channel on the 1-hour timeframe. It has reached the lower boundary and is heading towards breaking above it, with a retest of the upper boundary expected.
We have a downtrend on the RSI indicator, which has reached near the lower boundary, and an upward rebound is expected.
There is a key support zone in green at 0.7335. The price has bounced from this level multiple times and is expected to bounce again.
We have a trend towards consolidation above the 100-period moving average, as we are moving close to it, which supports the upward movement.
Entry price: 0.7416
First target: 0.7560
Second target: 0.7795
Third target: 0.8080
Don't forget a simple principle: money management.
Place your stop-loss order below the support zone in green.
For any questions, please leave a comment.
Thank you.
EURUSD bullish continuation pattern developingThe EURUSD remains in a bullish trend, with recent price action showing signs of a breakout within the broader uptrend.
Support Zone: 1.1640 – a key level from previous consolidation. Price is currently testing or approaching this level.
A bullish rebound from 1.1640 would confirm ongoing upside momentum, with potential targets at:
1.1710 – initial resistance
1.1730 – psychological and structural level
1.1750 – extended resistance on the longer-term chart
Bearish Scenario:
A confirmed break and daily close below 1.1640 would weaken the bullish outlook and suggest deeper downside risk toward:
1.1620 – minor support
1.1600 – stronger support and potential demand zone
Outlook:
Bullish bias remains intact while the EUPUSD holds above 1.1640. A sustained break below this level could shift momentum to the downside in the short term.
This communication is for informational purposes only and should not be viewed as any form of recommendation as to a particular course of action or as investment advice. It is not intended as an offer or solicitation for the purchase or sale of any financial instrument or as an official confirmation of any transaction. Opinions, estimates and assumptions expressed herein are made as of the date of this communication and are subject to change without notice. This communication has been prepared based upon information, including market prices, data and other information, believed to be reliable; however, Trade Nation does not warrant its completeness or accuracy. All market prices and market data contained in or attached to this communication are indicative and subject to change without notice.

DAX pivotal resistance at 23870The DAX remains in a bullish trend, with recent price action showing signs of a breakout within the broader uptrend.
Support Zone: 23870 – a key level from previous consolidation. Price is currently testing or approaching this level.
A bullish rebound from 23870 would confirm ongoing upside momentum, with potential targets at:
24300 – initial resistance
24450 – psychological and structural level
24560 – extended resistance on the longer-term chart
Bearish Scenario:
A confirmed break and daily close below 23870 would weaken the bullish outlook and suggest deeper downside risk toward:
23712 – minor support
23600 – stronger support and potential demand zone
Outlook:
Bullish bias remains intact while the DAX holds above 23870. A sustained break below this level could shift momentum to the downside in the short term.
This communication is for informational purposes only and should not be viewed as any form of recommendation as to a particular course of action or as investment advice. It is not intended as an offer or solicitation for the purchase or sale of any financial instrument or as an official confirmation of any transaction. Opinions, estimates and assumptions expressed herein are made as of the date of this communication and are subject to change without notice. This communication has been prepared based upon information, including market prices, data and other information, believed to be reliable; however, Trade Nation does not warrant its completeness or accuracy. All market prices and market data contained in or attached to this communication are indicative and subject to change without notice.

#MAGIC/USDT Bullish Reversal in MAGICUSDT Accumulation Zone in#MAGIC
The price is moving within an ascending channel on the 1-hour timeframe and is adhering to it well. It is poised to break out strongly and retest the channel.
We have a downtrend line on the RSI indicator that is about to break and retest, which supports the upward move.
There is a key support zone in green at 0.1111, representing a strong support point.
We have a trend of consolidation above the 100-period moving average.
Entry price: 0.1146
First target: 0.1194
Second target: 0.1268
Third target: 0.1343
Don't forget a simple money management rule:
Place your stop-loss order below the green support zone.
Once you reach the first target, save some money and then change your stop-loss order to an entry order.
For any questions, please leave a comment.
Thank you.

$spy $tlt Entering High Risk Low Reward ScenarioThe yield spread may be entering a period where a collapse of the spread or and increase of the spread above 1.5 causes high volatility market and potential large top. In my opinion, the market need to maintain the current spread to keep it going. I've never scene this happen...so buckle up 2026 is gonna be a ride

VICI Investment ThesisVICI looks like a very interesting setup right now following its recent pullback to roughly $27.73. Even though the company delivered a beat-and-raise quarter in Q3 2025 and announced a transformative $1.16 billion transaction with Golden Entertainment in November, the stock has de-rated. It is currently trading at an 11.7x P/AFFO multiple. This is a significant discount to its historical trading range, which is typically 14x–16x.
In my view, the market is mispricing just how resilient this business is. With 100% occupancy, 40 year Weighted Average Lease Term (WALT) and a fully covered 6.5% dividend yield VICI is pretty good stock of the gaming sector. I'm initiating my outlook with "Buy" rating and around 4 month price target of $35.00 which means 26% upside.
Regarding Funds From Operations, VICI grew AFFO per share by 5.3% YoY in Q3 2025 to reach $0.60. This growth was because of rent escalators and the funding of the Venetian investment. VICI raised its FY2025 guidance to $2,510–$2,520 million which signaling confidence in continued cash flow expansion.
The recent stock drop, which was roughly a 10-12% correction in November and December is because of broader rate volatility or sector rotation rather than company fundamentals in my opinion. I view this as a technical capitulation point.

The Day Ahead Tuesday, December 9:
Data highlights:
US: November NFIB small business optimism, September & October JOLTS job openings
Japan: November machine tool orders, PPI
Germany: October trade balance
Central banks:
RBA policy decision
ECB’s Nagel speaks
BoJ Governor Ueda speaks
Earnings:
thyssenkrupp
Auctions:
US 10-yr Treasury Notes
Market focus:
The RBA decision and Ueda’s remarks will be closely watched for global rates direction, while US JOLTS will be key for labour market tightness and Fed pricing. The 10-yr auction could influence Treasury yields and broader risk sentiment.
This communication is for informational purposes only and should not be viewed as any form of recommendation as to a particular course of action or as investment advice. It is not intended as an offer or solicitation for the purchase or sale of any financial instrument or as an official confirmation of any transaction. Opinions, estimates and assumptions expressed herein are made as of the date of this communication and are subject to change without notice. This communication has been prepared based upon information, including market prices, data and other information, believed to be reliable; however, Trade Nation does not warrant its completeness or accuracy. All market prices and market data contained in or attached to this communication are indicative and subject to change without notice.


Gold indecisive on Year end / I am in huge ProfitTechnical analysis: So far Gold has failed at attempt to invalidate the #4,157.80 - #4,167.80 wall of Support lines on Hourly 1 chart, despite an #3-consecutive sessions of weakness and #1-Month old Resistance zone ahead. Since Support zone managed to showcase strong durability and Price-action delivering almost #45 point uptrend on Intra-day basis, such aggressive spike confirms that Support zone is now even stronger and that area represents the trend’s Ultimate Bottom. Keep in mind on the other side that #4,227.80 benchmark have to be invalidated firstly on Hourly 1 chart to continue the Buying sequence, and with DX on spiral downtrend, is the mix which is keeping Bullish Short-term bias alive. Even though the December #5 trendline was invalidated, Hourly 1 chart was on healthy Descending Channel, DX was testing it’s Short-term Resistance + most importantly Fundamentals which weren’t enough to invalidate much expected Support zone break where market speculators were preventing total Selling domination and full oscillation towards #4,142.80 - #4,152.80 Lower Low’s Lower zone. Interesting fractal on Hourly 4 chart where Price-action was Trading above the Upper zone of Bollinger bands, which was instantly rejected as always Price-action tends to Trade within Bollinger Bands since #2002 Year. Historically, last time Gold was rejected above the Bollinger Bands on Daily chart (January #6 #2021), Gold extended the Medium-term decline of more than #150 points on the aftermath.
My position: I had light break in past few sessions as I've met my Annual Profit Target Months ago and December always is surprise Month for Trading / manipulations, fake-outs etc. I didn't answered to all messages and I am back now with posting my free Daily analysis. I will not Sell Gold at all costs and will continue Buying Gold from my key entry points. Also my Medium-term Buys did the job many times in recent Months and will continue to do so in #2026 Year.
PABC, Falling wedge breakout with bullish divergencePABC, 1D
Falling wedge breakout with bullish divergence
TP: 140, 158
SL: 118 closing below
Arsalan Anwer
Stags

ES - December 9th - Daily Trade PlanDecember 9th- Daily Trade Plan - 6:40am
*Before reading this trade plan, if you did not read yesterday's take the time to read it first! (You can view the posts in the related publication section) *
If my posts provide quality information that has helped you with your trading journey. Feel free to boost it for others to find and learn, also!
My daily trade plan and real-time notes that I post are intended for myself to easily be able to go back and review my plan and how I did from an execution perspective.
--------------------------------------------------------------------------------------------------------
If you have been reading my daily trade plan posts this year you know that I am a long ES trader only. I do not Short ES. I find levels that Institutions are buying at, and I ride along with them. You also know if you have been trading ES for any length of time is that ES when it sells off goes elevator down. When you see 15 min red candles like yesterday and when price is not flushing and reclaiming our key levels, it is better to wait for the highest quality levels, which are previous day's lows. You know that on my chart I color code them a certain way.
Purple = A Weekly Low (Current or Previous Week)
Blue = A previous day low (Day before or day in the past week)
Red - Overnight Session High/Low (Prior to my post)
White = Key Support/Resistance Levels
How do Institutions accumulate? They hunt for liquidity. How? They run stops. How do we know where those stops are? They are typically near or below key lows. You can see these key lows via a 15 min candle based on the wick.
I have decided to change my daily post to focus on the core levels and not all support/resistance levels.
When ES is selling off and we do not get a flush and reclaim that produces a follow through on the first 2 core levels, it is better to wait for a purple or blue level to enter.
Yesterday I wrote that 6857 was my highest quality level and any loss and no quick reclaim would change the structure of the trend. We pretty much flushed down to below 6857 and could never put in a reclaim that held the level by 5pts. Meaning, we did not reclaim 6857 and hold above it around 6857-6862.
Example - At 10:26am - We bounced at 6858, tried to recover but could not make a higher high and fizzled out at 6869 then continued lower. You also want price to attempt to sell off back at the core level and see it hold. When price came back down it tried to hold it and bounced at 10:45am to 6862. It needed to clear 6867 to create a higher high. Every dip that bounced yesterday did not make a higher high until later in the day.
I did not have 6841 called out on my plan, because I was not anticipating price to lose 6857 if it was going to keep moving higher. I did post at 11am that I would only trade the reclaim of 6857 or 6836 (both previous day's lows in the past week). While 6841 did produce a nice bounce, ultimately it never reclaimed 6857 and held. It rallied quickly into 6853 and then sold off. If price is coming up from a support into a resistance. I would only enter on the reclaim and back test of that level that holds for 5mins or so to show that it wants to keep going higher.
Why did I take a position at 6836 level? Price dipped below to 6835, bounced and then came back down and retested 6836 and continued higher. This was a great R/R trade, but did I know if this was going to be the low for the day? No. I did know that price had been trying to find a low for a while yesterday and eventually sellers ran out of steam, and we started making higher highs, higher lows on the 1 min chart and that gave me confidence that price could continue higher. 6848 was a clear resistance above and that is where I sold 3/4 of my position (next level up).
I hope this helps anyone that is trying to understand my system.
Overnight high is 6868 and is a clear resistance and also the resistance of Friday's intraday lows. The overnight low is 6854 with a quick flush and reclaim that we got while I have been typing this post. As of right now, it has not produced any follow through.
Key Levels Today
1. 6854 flush and reclaim (Lower quality)
2. 6836 flush and reclaim (Highest quality)
You can try a back test of 6868, IF price can clear it and hold above. I would give it time to show that it wants to hold that level.
Below 6836 and the only core levels I would look for a flush and reclaim would be 6818, 6801, 6792.
Below these levels and price will most likely be selling off and I would be getting out the way and let price find a level below to reclaim and move higher.
I will post an update around 10am EST
----------------------------------------------------------------------------------------------------------------
Couple of things about how I color code my levels.
1. Purple shows a current or prior weekly low
2. Red shows the current overnight session High/Low (time of post)
3. Blue shows the previous day's session Low (also other previous day's lows)
4. White shows key support/resistance levels

XAUUSD Beaware of picpocket GOLD IS OVerthe higher time frames are showing intersting zone of resistence that price couldn't go above it , the creation of a bearish market structure can relate

Solana Bullishthe red stick is your parametrer to enter the trade , once price cross over it , take you position as the market is already showing a bullish momentum

Gold ahead of FED decisionGold has completed a Wave 4 triangle and has now broken out decisively, confirming the start of Wave 5. After the breakout, price action has formed a rectangle consolidation, which reflects investor indecision, understandable ahead of tomorrow’s Fed rate decision.
If the Fed cuts rates, gold would likely rally, with Wave 5 breaking out of the rectangle and pushing toward the upper boundary of the rising purple channel, which comes in around $4,500.
If the Fed does not cut, we could see a deeper correction, potentially pulling gold back toward the $3,800 level, a major historical support.

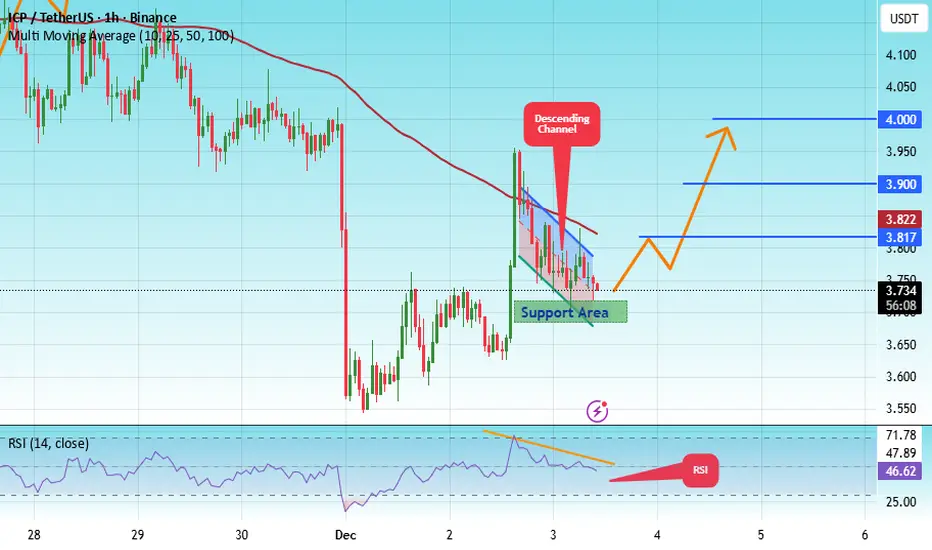
#ICP/USDT Ready for a Breakout — Double Digits Possible#ICP
The price is moving in a descending channel on the 1-hour timeframe. It has reached the lower boundary and is heading towards breaking above it, with a retest of the upper boundary expected.
We have a downtrend on the RSI indicator, which has reached near the lower boundary, and an upward rebound is expected.
There is a key support zone in green at 3.70. The price has bounced from this zone multiple times and is expected to bounce again.
We have a trend towards stability above the 100-period moving average, as we are moving close to it, which supports the upward movement.
Entry price: 3.74
First target: 3.82
Second target: 3.90
Third target: 4.00
Don't forget a simple principle: money management.
Place your stop-loss below the green support zone.
For any questions, please leave a comment.
Thank you.
ZEC - From Exhaustion to Expansion!!!📉ZEC spent days trapped in a clear bearish phase on the left side of the chart, forming lower lows and lower highs. But everything changed once price tapped the major swing low, where buyers stepped in aggressively.
📈Since then, ZEC has been respecting a new rising channel , shifting the market structure from bearish to bullish. As long as price remains inside this channel, the bulls remain in control.
We will be looking for longs around the intersection of:
- the lower blue trendline, and
- the most recent higher-low zone
🏹This is where buyers have consistently reacted before, and where the next bullish impulse could start.
If this structure holds, ZEC may push toward the upper boundary of the channel once again.
Do you think ZEC is gearing up for another leg up? Let me know below 👇
⚠️ Disclaimer: This is not financial advice. Always do your own research and manage risk properly.
📚 Stick to your trading plan regarding entries, risk, and management.
Good luck! 🍀
All Strategies Are Good; If Managed Properly!
~Richard Nasr
