Can Gold Reach New Highs? Strategy Update.
Gold remains in an uptrend. After testing the bottom, strong support has emerged, forming a double bottom at 4270, leading to a strong rebound. Today, we continue our weekend analysis, buying on pullbacks that hold above this level, as the uptrend persists. We don't recommend chasing the price higher, mainly due to concerns about potential market manipulation and sharp sell-offs. With the previous high of 4380 just around the corner, those without a long-term holding strategy should avoid chasing short-term highs and patiently wait for pullbacks. This week is also a data week, so the market is likely to be quite active. Considering Tuesday's non-farm payroll data, today's trading is likely to be range-bound at higher levels.
Today's trading should be done in batches. Aggressive traders should focus on support at 4300-4290, while conservative traders should focus on strong support around 4275-85.
Currently, there is resistance at 4330-40, with strong resistance around 4350.
Market conditions are constantly changing, and we're currently at a crucial juncture in the battle between gold bulls and bears. The principle is to follow the trend of whoever is stronger, and never trade against it. The key is to go with the flow; the trend is king. Plan your trades, and trade your plan. How far a person can go depends on who they walk with. How much success a person can achieve in the market depends on who guides them; no amount of advice can compare to a single, tangible profit.
X-indicator

The Anatomy of an Overextended Market MoveMarket Context: When Momentum Accelerates
Markets periodically enter phases where price accelerates rapidly, often driven by a combination of macro catalysts, positioning imbalances, and behavioral feedback loops. In such environments, momentum can appear self-reinforcing: higher prices attract more participation, which in turn pushes prices even higher. While these phases can feel decisive and convincing, they also introduce an important analytical question — is the move being accepted by the market, or is it simply expanding faster than structure can support?
This distinction matters because strong momentum does not automatically imply durability. In fact, the most aggressive moves often carry the seeds of their own instability, particularly when price begins to disconnect from commonly observed reference points such as volatility envelopes, prior value zones, and resting order clusters.
The recent advance examined in this case study provides a clear example of this dynamic: a structurally bullish resolution followed by a sharp acceleration that raises legitimate questions about sustainability.
Pattern Resolution Versus Move Sustainability
Classical chart patterns are useful because they describe how markets transition from balance to imbalance. A double bottom, for example, reflects a failed attempt by sellers to extend lower prices, followed by renewed demand. Once the neckline is cleared, the pattern is considered resolved.
However, pattern resolution only explains directional bias — it does not guarantee how price will behave after the breakout.
In practice, many pattern completions coincide with:
Early participants reducing exposure
Profit-taking activity near projected objectives
New positioning that is more sensitive to short-term adverse movement
As a result, the completion of a pattern can sometimes mark the end of a clean directional phase rather than the beginning of an extended one. This is especially relevant when the breakout is followed by aggressive price expansion rather than gradual acceptance.
Volatility Expansion and the Bollinger Band Framework
Bollinger Bands® are commonly misunderstood as directional indicators. In reality, they function as volatility envelopes, providing context for how far price has deviated from its recent mean.
When price trades:
Outside the upper band
After a gap higher
And remains extended for multiple sessions
it signals volatility expansion, not necessarily trend continuation.
From a statistical perspective, such conditions indicate that price has moved beyond its recent distribution range. From a behavioral perspective, they often reflect:
Late participation
Emotional decision-making
Reduced liquidity on one side of the market
None of these imply that price must reverse immediately. What they do imply is that the informational risk of continuation increases, while the probability of mean reversion back toward equilibrium also rises.
Mean Reversion as a Structural Tendency
Mean reversion is not a prediction tool. It is a structural tendency observed across liquid markets, driven by the constant interaction between:
Value discovery
Liquidity provision
Inventory management by participants
When price moves “too far, too fast,” it stretches these mechanisms. Liquidity providers become more selective, directional participants begin to manage exposure, and resting orders closer to the mean regain relevance.
Importantly, mean reversion does not require a bearish narrative. It simply reflects the market’s natural inclination to revisit areas where participation was previously deeper and more balanced.
In this context, mean reversion should be viewed as a risk consideration, not a directional conviction.
Order-Flow Structure
A key element of this case study is the alignment between classical technical projections and observable order-flow structure, described here through the lens of UnFilled Orders (UFOs).
UFOs represent areas where prior activity suggests the presence of resting interest that has not yet been fully executed. These zones often coincide with:
Prior consolidations
Structural inflection points
Pattern-derived objectives
In the current structure:
o An upper zone near 1.18350 aligns with:
The projected objective of the resolved pattern
UFO resistance
Likely areas of trade closure and sell on-field activity
o A lower zone near 1.16875 aligns with:
UFO support
Areas where price previously attracted participation
A logical mean reversion destination
The importance of these zones lies not in their precision, but in their confluence. When multiple frameworks point to the same areas, they tend to attract attention from a broader range of participants.
Why Overextended Moves Become Fragile
Overextended markets often appear strongest right before they become most sensitive. This is because:
Positioning becomes one-sided
Liquidity thins as fewer participants are willing to transact at extremes
Small shifts in order flow can have outsized impact
In such conditions, price does not need a major catalyst to retrace. It often only needs:
A pause in aggressive buying
Routine profit-taking
A minor shift in expectations
This fragility is what makes mean reversion a relevant consideration after sharp extensions, even within broader bullish structures.
Illustrative Trade Framework (Case Study Only)
To translate these concepts into a practical framework, consider the following illustrative structure, presented strictly as a case study.
o Context
Price has resolved a bullish pattern
Volatility has expanded sharply
Price is trading outside the upper Bollinger Band
o Area of Interest - Upper reference zone near 1.18350, where:
Pattern objectives converge
UFO resistance is present
Trade closure activity is likely
o Mean Reversion Reference - Lower zone near 1.16875, aligned with:
Buy UFO support
Prior participation
The statistical mean
o Risk Definition
Invalidation occurs if price demonstrates acceptance above the resistance zone rather than rejection
This framework highlights an important principle: mean reversion trades are defined by risk first, not by direction. They require patience, flexibility, and a clear understanding of when the underlying premise no longer applies.
Standard and Micro Contracts
This case study can be examined using both standard and micro futures contracts, which offer different exposure profiles while referencing the same underlying market. Understanding their basic specifications is essential, particularly when volatility expands and mean reversion risk increases.
o Standard Futures Contract (6E)
Minimum price fluctuation (tick): 0.000050 per Euro increment = $6.25
Typical margin characteristics: ~$2,700 per contract
o Micro Futures Contract (M6E)
Minimum price fluctuation (tick): 0.0001 per euro = $1.25
Typical margin characteristics: ~$270 per contract
Margin requirements are dynamic, not fixed. They are influenced by market volatility, exchange risk controls, and clearing firm policies.
From a risk-management perspective, the availability of both standard and micro contracts enables traders to align position size with conviction and uncertainty, rather than forcing binary exposure decisions.
Risk Management Considerations
Mean reversion setups carry unique risks. Unlike momentum trades, they often involve entering against recent price direction, which requires:
Smaller position sizing
Wider tolerance for initial adverse movement
Strict invalidation criteria
It is also important to distinguish between being early and being wrong. Overextended markets can remain extended longer than expected. Risk management exists to ensure that such scenarios do not result in disproportionate losses.
Ultimately, the objective is not to capture every retracement, but to participate selectively when structure, volatility, and order-flow context align.
Data Consideration
When charting futures, the data provided could be delayed. Traders working with the ticker symbols discussed in this idea may prefer to use CME Group real-time data plan on TradingView: www.tradingview.com - This consideration is particularly important for shorter-term traders, whereas it may be less critical for those focused on longer-term trading strategies.
General Disclaimer
The trade ideas presented herein are solely for illustrative purposes forming a part of a case study intended to demonstrate key principles in risk management within the context of the specific market scenarios discussed. These ideas are not to be interpreted as investment recommendations or financial advice. They do not endorse or promote any specific trading strategies, financial products, or services. The information provided is based on data believed to be reliable; however, its accuracy or completeness cannot be guaranteed. Trading in financial markets involves risks, including the potential loss of principal. Each individual should conduct their own research and consult with professional financial advisors before making any investment decisions. The author or publisher of this content bears no responsibility for any actions taken based on the information provided or for any resultant financial or other losses.

Gold price analysis on December 15thGold prices are moving exactly as VHT Trader previously analyzed. The current upward momentum clearly indicates the possibility of setting a new all-time high in the near future.
The 4400 level continues to be considered a significant psychological resistance level, acting as a short-term target where the market may experience profit-taking and sell signals. However, with a strong upward wave structure forming, the gold uptrend shows no signs of ending. Further down, 4500 is the next resistance level that the price could potentially target in subsequent upward movements.
📌 Key Technical Points
Support: 4265 – 4217 – 4177
Resistance: 4347 – 4400
🔹 Preferred Strategy: BUY following the trend
BUY Trigger: When the price shows a clear rejection signal at the support zone of 4265 – 4217 – 4177
Target: 4400

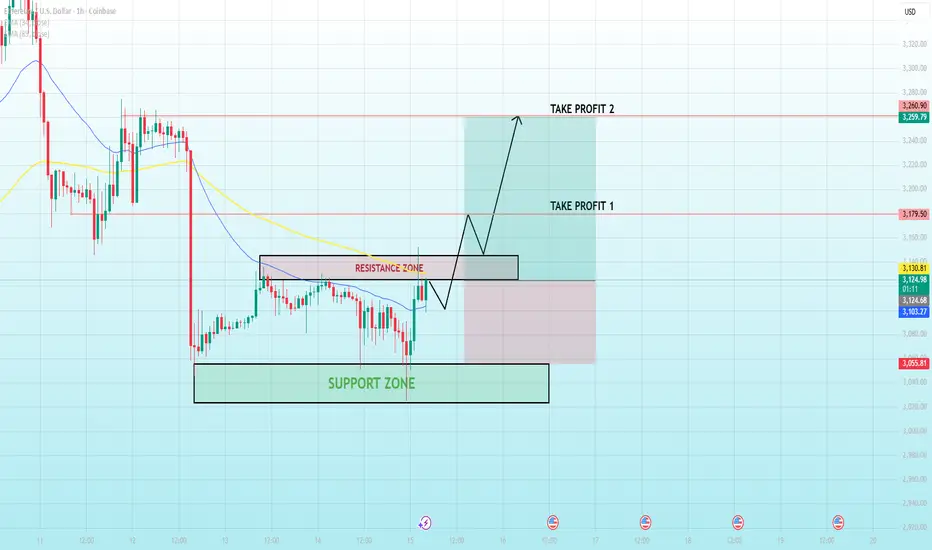
Ethereum Tests a Key Flip Zone....🔹 MARKET BRIEFING – ETH/USD (1H)
Market State:
– Ethereum has reacted strongly from the lower support zone and is now pressing into a well-defined resistance area.
– The impulsive bounce suggests short-term momentum recovery, but price is still interacting with prior supply, making this a decision point rather than a confirmed continuation.
Key Technical Levels:
– Support Zone: 3,030 – 3,060
– Resistance / Flip Zone: 3,120 – 3,145
– Take Profit 1: 3,175 – 3,185
– Take Profit 2: 3,250 – 3,265
– EMAs are flattening, reinforcing a transition from corrective to neutral structure.
🌍 Macro Context – What Supports the Upside Attempt
– Bitcoin Stability: BTC holding above recent lows reduces systemic downside pressure on ETH.
– Fed Expectations: With rates priced to remain steady, risk assets are allowed to recover technically, though without aggressive expansion.
– Liquidity Rotation: Post-selloff conditions favor mean-reversion rallies, especially from clean support zones.
Next Move:
– Acceptance above the 3,145 resistance zone would confirm a bullish flip and open the path toward 3,175 → 3,265.
– Failure to hold above resistance would likely result in a pullback toward the 3,060 support, keeping ETH range-bound.
Bottom Line:
– Ethereum is at a make-or-break level.
– Strength above resistance confirms continuation rejection reinforces a broader consolidation phase until a clearer macro catalyst emerges.
XAUUSD | Gold Signal |Dec 15,2025📊 Market Overview
⏱️ H1 Chart
- Price opened today at 4302 and is currently trading around 4324, holding above today’s VAH (4314) → indicating buyers remain in control during the session.
- Today’s POC at 4305 and VAL at 4301 define the 4300–4305 zone as a key intraday balance and support area.
- EMA34 is above EMA89 and EMA200, with all three EMAs sloping upward → confirming that the short-term bullish trend remains intact.
- However, price is currently extended far above EMA34, increasing the probability of a short-term pullback toward the EMA or POC.
→ H1 Bias: Bullish, but over-extended. Prefer waiting for pullbacks to enter long positions.
⏱️ M15 Chart
- After a strong impulsive move, price is consolidating above today’s VAH (4314), showing that buyers are still controlling the market.
- EMA34 and EMA89 remain above EMA200 and continue to slope upward → short-term bullish structure is maintained.
- Every pullback into the EMA34 on M15 has been quickly absorbed, signaling active buying pressure.
- Declining volume during consolidation suggests a typical accumulation phase before potential trend continuation.
→ M15 Bias: Short-term bullish. Focus on buying pullbacks.
📌 TRADING PLAN
🟢 BUY LIMIT 4310 – 4315
Reasons:
- Today’s VAH acting as dynamic support.
- Confluence with EMA34 on M15.
- Bullish market structure remains intact.
🟢 BUY LIMIT 4300 – 4305
Reasons:
- Confluence of today’s VAL, today’s POC, and the daily open.
- Alignment with EMA34/EMA89 on M15 → strong support zone.
- High-probability area to buy in line with the H4–H1 bullish trend.
🟢 BUY LIMIT 4245 – 4255
Reasons:
- Weekly VAH → medium-term support.
- H4 demand zone + EMA89 on H1 + EMA34 on H4.
- Previous breakout zone, likely to act as support on a retest.
🔴 SELL SCALP 4335 – 4345
Reasons:
- Nearest H1 supply zone.
- Potential profit-taking after an extended bullish move.
- Strictly for quick scalps, not trend reversal trades.
⚠️ Final Notes
- The long-term and medium-term trend remains strongly bullish, with price trading well above the H1 EMA200.
- Intraday bias favors buying pullbacks, avoid FOMO buying at highs.
- SELL setups should be treated strictly as reactionary scalps at resistance, not counter-trend positions.
- A solid H1 close above 4314 could open the door for an extension toward 4335 → 4350.
- A breakdown below 4300 may trigger a deeper pullback toward 4255, where buyers are expected to re-engage.

USDJPY Weekly Outlook Week 51 Day 15My analysis remains bullish on this pair (please see previous analysis). I added extra analysis for those interested in selling - selling on demo accounts of course.
My point of view (POV) on this asset is that I take 158 as my supply and 140 as my demand. My bullish bias becomes invalid if the price pushes or retraces back to 149.3, the 50 per cent Fibonacci level. Note that the market validates this fib zone by the pivot points to the left - meaning that historically, price finds a bit of support at this level before either going north or south. If the asset finds its true north, bullish investors like me will jump in; otherwise, I will leave it for the sellers.
Should the price stay below 157, sellers can take a profitable trade till about 153. Obviously, bullish traders like me would like to go on holiday on this pair.
Don't forget that the trend is your friend until the end when it bends.
Disclaimer: Not a trading advice, for educational purposes only.
Let me know what you think in the comments section. Please give me post a boost

Review and plan for 15th December 2025Nifty future and banknifty future analysis and intraday plan.
This video is for information/education purpose only. you are 100% responsible for any actions you take by reading/viewing this post.
please consult your financial advisor before taking any action.
----Vinaykumar hiremath, CMT


NZDCHF – Trend Shift Confirmed ..... Buy the PullbackNZDCHF has broken its bearish trend, signaling a shift to a bullish market structure. Following a bullish divergence, price action has broken the last Lower High (LH) and formed the first Higher High (HH), confirming a potential trend reversal.
Now, waiting for a pullback into a favorable zone to look for long entries with a tight stop-loss zone, aiming for a 1:2 risk-to-reward ratio.
Bias: Bullish
Risk-Reward: 1:2
Plan: Buy on pullback with confirmation

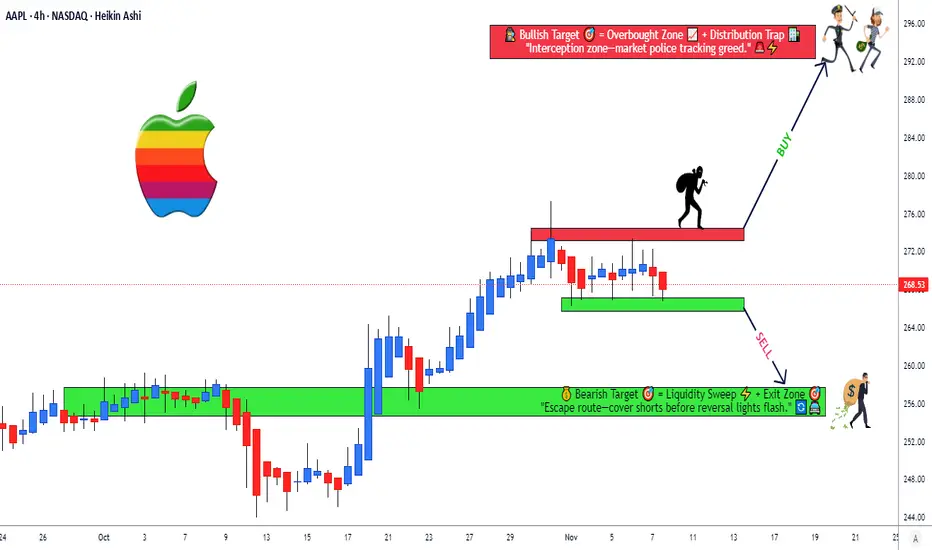
Apple Inc. Swing Setup – Breakout or Breakdown Ahead?🍎 AAPL | Apple Inc. - Swing Trade Profit Blueprint 💰
NASDAQ: AAPL | Breakout Pattern Setup ⚡
Master the Swing Trade Game 🎯
📊 TECHNICAL OVERVIEW
Currently trading at $268.47 with strong momentum indicators aligning for a breakout scenario. Apple is positioned in a critical decision zone with defined technical levels offering professional risk/reward opportunities.
🎲 Market Structure: Tight consolidation phase with multiple confluences at key resistance and support zones.
📈 SWING TRADE SETUP - DUAL SCENARIO ANALYSIS
SCENARIO 1: BULLISH BREAKOUT 🚀
Entry Signal: Price breaks above resistance with volume confirmation
Entry Zone: Above $272.00 (Daily Close Confirmation)
Initial Target: $290.00 TP1 🎯
Extended Target: $295.00 TP2 (Ultimate Profit Zone) 🏆
Stop Loss: $264.00 (Risk Management Point) 🛑
SCENARIO 2: BEARISH BREAKDOWN 📉
Entry Signal: Price breaks below support with selling pressure
Entry Zone: Below $266.50 (Daily Close Confirmation)
Target 1: $262.00 TP1 🎯
Target 2: $256.00 TP2 (Profit Protection Zone) 🏆
Stop Loss: $276.00 (Risk Management Point) 🛑
🔍 KEY TECHNICAL FACTORS
✅ Momentum Alignment: Multiple timeframe convergence detected
✅ Volume Profile: Above average volume supporting breakout potential
✅ Support/Resistance: Well-defined levels from historical price action
✅ RSI Positioning: Neutral to strong momentum setup
✅ Moving Averages: Key dynamic support levels in play
🎯 SCENARIO CORRELATION PAIRS TO MONITOR
Primary Correlations:
🔗 NASDAQ:MSFT (Microsoft) - Tech sector strength indicator | Tech giants move together | Watch for divergence signals
🔗 NASDAQ:QQQ (Nasdaq-100 ETF) - Broader market direction | If QQQ breaks down, AAPL pressure increases | Use as macro confirmation
🔗 AMEX:VGT (Vanguard Info Tech ETF) - Sector sentiment gauge | Tech rotation plays | Confirms sector health
🔗 AMEX:IVV (iShares S&P 500 ETF) - S&P 500 correlation | Broad market support/resistance | Risk-on/risk-off indicator
🔗 AMEX:GLD (Gold) - Risk sentiment inverse correlation | Gold up = Risk-off = Tech pressure | Macro economic climate
📍 IMPORTANT REMINDERS FOR TRADERS
Your Entry Is Your Choice ✓ Only enter when YOUR checklist is complete
Your Stop Loss Is Your Decision ✓ Set it where YOU feel comfortable with risk
Your Take Profit Is Your Call ✓ Exit when your profit target is achieved or thesis breaks
Every trader's risk tolerance differs. These levels are technical reference points, not personal recommendations.
🎓 STRATEGY NOTES
✨ Best used on 1H-4H timeframes for swing trading
✨ Volume confirmation is CRITICAL before entries
✨ Wait for candle closes above/below levels - no wick trading
✨ Use this alongside your own technical analysis
✨ Market conditions can invalidate setups rapidly - stay flexible
✨ The breakout zone is where patience rewards traders
💡 CORRELATION SUMMARY
Green Lights ✅: When MSFT, QQQ, and VGT all confirm uptrend = Stronger AAPL bullish case
Yellow Caution ⚠️: When divergence appears between AAPL and QQQ = Possible reversal warning
Red Lights 🔴: When GLD spikes & IVV breaks support = Risk-off environment = Tech pressure incoming
✨ If you find value in my analysis, a 👍 and 🚀 boost is much appreciated — it helps me share more setups with the community!
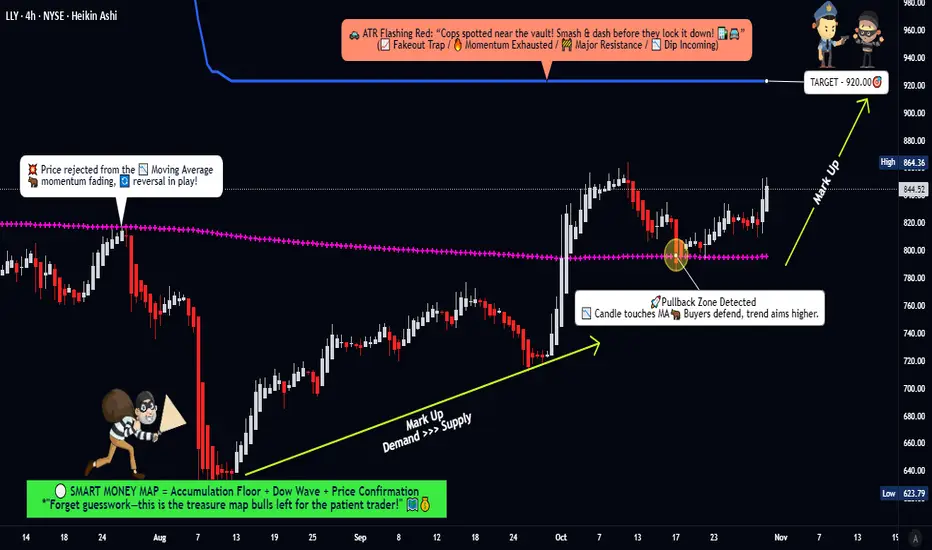
LLY Market Blueprint – From Pullback Base to Profit Zone🎯 LLY Stock Market Heist Plan 🏦💰 | Swing Trade Setup
📊 Asset Overview
Eli Lilly and Company (LLY) - NYSE
Pharmaceutical Giant | Market Cap Leader
🔍 The Setup: What We're Seeing
The chart is screaming opportunity! 🚨 LLY is showing classic bullish pullback behavior with strong accumulation zone activity. We've got:
✅ Accumulation Zone Pressure - Big money is quietly loading up
✅ Weighted Moving Average Breakout & Retest - Technical confirmation ✓
✅ Bullish Momentum Building - The spring is coiling for the next leg up
🎯 The Thief's Game Plan
Entry Strategy: The Layered Approach 🪜
You've got two options here, fellow thieves:
Option 1: Simple Entry
→ Any current price level works if you're confident in the setup
Option 2: The Thief's Layered Entry 🧠
This is where we get tactical. Use multiple limit orders to ladder into the position:
Layer 1: $780
Layer 2: $800
Layer 3: $820
Layer 4: $840
You can add more layers based on your capital and risk tolerance. This approach averages your entry and reduces timing risk.
🛑 Risk Management: The Escape Hatch
Stop Loss: $760
⚠️ Important Note: This is MY stop loss level based on my risk tolerance and analysis. You are the captain of your own ship! Set your SL based on YOUR risk appetite. Make money, take money - but do it at your own risk. 🎲
💰 Target: The Vault 🏦
Take Profit: $920
Here's the situation: The ATR line is sitting at $920 acting like a police barricade 🚔. This is a strong resistance zone where:
Overbought conditions likely
Potential trap zone for late entries
Natural profit-taking area
🎯 My Advice: When you reach the vault, grab the cash and RUN! Don't get greedy.
⚠️ Another Important Note: This is MY target. You make your own rules. Scale out, hold longer, take profits earlier - whatever fits YOUR trading plan. This is your heist, not mine! 💼
📈 Related Pairs to Watch
Keep these on your radar for correlation and broader market context:
Healthcare/Pharma Sector:
NYSE:JNJ (Johnson & Johnson) - Healthcare bellwether, moves often correlate
NYSE:UNH (UnitedHealth Group) - Health sector leader, shows sector strength
NYSE:PFE (Pfizer) - Direct pharma competitor, industry sentiment gauge
NYSE:ABBV (AbbVie) - Biopharmaceutical peer, similar market dynamics
Market Context:
AMEX:SPY (S&P 500 ETF) - Overall market direction matters
AMEX:XLV (Health Care Select Sector SPDR) - Sector health indicator
Key Correlation Points:
LLY often leads pharma sector during strong diabetes/obesity drug cycles
Watch NYSE:JNJ for defensive rotation signals
AMEX:SPY correlation increases during risk-on markets
AMEX:XLV breakouts often precede individual pharma stock runs
🎭 The Thief's Philosophy
This setup combines patience (layered entries), discipline (clear stop loss), and calculated risk-taking (defined target). We're not gambling - we're executing a well-planned heist with multiple contingencies.
The market is the vault. The chart is the blueprint. Your risk management is your getaway car. 🚗💨
Remember: The best thieves know when to strike AND when to walk away. Don't fall in love with a position. Take your profits and live to steal another day! 😎
✨ If you find value in my analysis, a 👍 and 🚀 boost is much appreciated — it helps me share more setups with the community!
#LLY #EliLilly #SwingTrading #StockMarket #TechnicalAnalysis #NYSE #PharmaStocks #BullishSetup #TradingStrategy #ThiefStyle #LayeredEntry #RiskManagement #PriceAction #MovingAverage #AccumulationZone #HealthcareStocks #TradingIdeas #StockTrading #ChartAnalysis #MarketHeist
Can Ethereum’s Capital Flow Blueprint Target 4600 Next?🎯 ETH/USD "The Liquidity Thief" Strategy 💰
Weighted MA Pullback + Manipulation Grab Blueprint
📊 TRADE SETUP OVERVIEW
Asset: ETH/USD (Ethereum vs USD) | Timeframe: Swing Trade
Market Structure: Bullish Confirmation with WMA Pullback Recovery
Strategy Type: Multi-Layer Accumulation (Thief-Style Entry Method)
🎪 THE GAMEPLAN
Bias: 🟢 BULLISH — Confirmed via:
Weighted Moving Average (WMA) acting as dynamic support
Liquidity pool identification on pullback zones
Institutional accumulation patterns detected
This setup thrives on pullback retracements where smart money accumulates before the next leg up. We're essentially "stealing" liquidity at discount prices during these inefficiency windows.
🚀 MULTI-LAYER ENTRY STRATEGY (The Thief Approach)
Instead of FOMO market orders, we deploy calculated limit order layers at strategic support zones:
Entry Levels (Layer-by-Layer Accumulation):
Layer 1: $3,700 USD
Layer 2: $3,800 USD
Layer 3: $3,900 USD
(Pro Tip: Scale these layers based on your risk tolerance and account size. Tighter layers = more fills; wider layers = better average price)
Position Building: Fill partial positions at each layer, building your total exposure gradually. This reduces average entry cost and maximizes probability of initial profit.
🛑 STOP LOSS (Risk Management)
Hard Stop: $3,500 USD
⚠️ Important Disclaimer: This is YOUR trading decision. No strategy guarantees profits. Position sizing and risk management are YOUR responsibility. Never risk capital you can't afford to lose.
🎯 TARGET & EXIT STRATEGY
Primary Target: $4,600 USD
Exit Rationale:
Strong resistance zone confluence
RSI/Stochastic overbought divergence
Liquidity trap zone (potential reversal catalyst)
💡 Golden Rule: Lock in profits at $4,600 or take partial profits at resistance. Never hold through key resistance on swing trades—greed kills thief traders.
⚠️ Disclosure: Risk management and profit targets are trader-dependent. Adjust based on your strategy framework, market conditions, and account allocation.
📈 CORRELATED PAIRS TO WATCH
Monitor these assets for confluence signals and capital flow indicators:
BITSTAMP:BTCUSD (✅ High Positive Correlation) — Bitcoin sets market sentiment; ETH typically follows in lockstep. When BTC rallies, altcoins like ETH amplify the move upward.
BINANCE:ETHBTC (⚖️ Relative Strength) — ETH strength against BTC equals altseason confirmation. Rising ETHBTC ratio means Ethereum is outperforming Bitcoin—bullish for our setup.
$SPY/ IG:NASDAQ (📊 Risk Appetite) — Traditional equity weakness creates crypto pullback risk. If stocks dump, crypto usually follows. Monitor US market opens for confirmation signals.
TVC:DXY (Dollar Index) (⚖️ Inverse Correlation) — Strong dollar = crypto headwind; weak dollar = tailwind for ETH. A declining DXY supports crypto rally scenarios.
COINBASE:USDTUSD (🔒 Stablecoin Flow) — USDT accumulation signals capital waiting for entry. Rising USDT on exchanges = dry powder ready to deploy into altcoins like ETH.
Capital Flow Blueprint: When BTC holds above support AND USDT shows inflow, altcoins like ETH enter "hunter mode."
🔑 KEY TRADING PRINCIPLES (Thief OG Edition)
✨ Patience — Wait for pullback confirmation before layering in
✨ Position Sizing — Risk only 1-2% per trade; 3% absolute maximum
✨ Confluence — Entry + Support + Volume + Correlation = Green Light
✨ Discipline — Exit at target or stop loss; no emotional HODL mode
✨ Adaptation — Markets evolve; update bias if structure breaks
If you find value in my analysis, a 👍 and 🚀 boost is much appreciated — it helps me share more setups with the community!
#ETH #ETHUSD #Ethereum #CryptoTrading #TechnicalAnalysis #SwingTrading #CryptoDCA #TradingStrategy #LayerEntry #LiquidityZones #AltSeason #CryptoAnalysis #TradeSetup #RiskManagement #Thief #CommunityDriven

ETEHREUM WEEKLY CHART AND PERSPECTIVE ETHEREUM on weekly time frame rejected 3,483.80 ,the break and close of the level would have been a buy confirmation and another opening to long,the failure to bridge 3483.80 will confront the next line of support at 2,812.42 on weekly TF.
On the weekly floor we have a consolidated demand floor in 2,532.04 from our weekly line chart close .
The crypto market will close the year on sell caution and 2132.64-2000 zone demand floor will be my psychological demand floor which has held price action active since Jan 2022 running actively.
the break of weekly 2132.64 will confront 1,554.78 April 2025 low on my weekly line chart close and the wicks rejection buy floor will be 1,401.36 which has a descending trendline acting as dynamic support on weekly TF as illustrated on the chart with description .
my buy confirmation will be on the break and close 3483.80 on weekly tf.but for now ,buyers are on hold as the year comes to an end .
i predict a sell spray based on the weekly rejection candle and general ecosystem sentiment.
#ethusdt #ethereum.


Polygon (POL): Looking For Confirmational Breakout For EntryPOL is still based near the lows after a strong sell-off. Price is holding the local bottom, but buyers are still capped below the 100 EMA and the local high. That area is the key for any bullish continuation.
If buyers manage to break and hold above the 100 EMA and take the local high, then a good opportunity starts shaping up toward the first target, with the bigger gap above acting as a magnet. Until that break happens, the game plan remains the same—wait for confirmation, not a full send yet.
Swallow Academy

EURUSD Bullish Continuation Key Support Holding Target 1.18000.EURUSD is currently trading near 1.17481, maintaining a bullish structure above key support levels. Price action suggests buyers remain in control as long as the market holds above the highlighted demand zone.
Key Levels
Support: 1.17198
Resistance: 1.17629
Bullish Target: 1.18000
Technical Outlook
Price is respecting support at 1.17198, indicating strong buying interest on pullbacks.
A sustained break and close above 1.17629 will confirm bullish continuation.
Momentum favors the upside, and higher-low formation supports further bullish pressure.
As long as price stays above support, the bias remains bullish toward 1.18000.
Trading Plan
Bullish Scenario:
Buy on pullbacks above 1.17198 or on a confirmed breakout above 1.17629
🎯 Target: 1.18000
Invalidation:
A strong close below 1.17198 may weaken the bullish setup.
Conclusion
EURUSD remains bullish above 1.17198, with buyers aiming to push price toward the 1.18000 psychological level. Traders should watch for confirmation near resistance before entering new positions.
Regards: Chart Analyst Pro.
#EURUSD #ForexTrading #TechnicalAnalysis #PriceAction #FX #BullishBias #TradingView

The Day Ahead Monday, December 15 – Trading Day Summary
Markets head into the new week with a heavy data calendar and a couple of Fed speakers to digest, which could drive some early volatility across rates and FX.
In the US, the December Empire Manufacturing Index will offer a timely read on regional activity, while the NAHB Housing Market Index should give further insight into how higher mortgage rates are affecting builder sentiment. Later on, existing home sales and housing starts will be watched closely for confirmation of any slowdown or stabilisation in the housing sector. Canadian markets will also be active, with November CPI the key release, alongside housing starts and October manufacturing sales, all of which will feed into BoC rate expectations.
In Europe, attention will be on Eurozone October industrial production for signs of cyclical momentum, while Germany’s November wholesale price index will be monitored for pipeline inflation pressures. Italy’s October general government debt data may attract some peripheral spread focus, though market impact is usually limited unless there is a surprise.
In China, November retail sales, industrial production, fixed asset investment and home price data form a major data dump, providing an important update on domestic demand, the property sector and the effectiveness of recent policy support measures. These releases could set the tone for Asian risk sentiment and commodities.
From central banks, comments from Fed officials Miran and Williams will be parsed for any guidance on the policy outlook following last week’s FOMC meeting, particularly around the timing and pace of future rate cuts.
Overall, today’s trading is likely to be driven by macro data surprises, with housing and inflation themes in focus, while any deviation in tone from Fed speakers could influence front-end rates and the dollar.
This communication is for informational purposes only and should not be viewed as any form of recommendation as to a particular course of action or as investment advice. It is not intended as an offer or solicitation for the purchase or sale of any financial instrument or as an official confirmation of any transaction. Opinions, estimates and assumptions expressed herein are made as of the date of this communication and are subject to change without notice. This communication has been prepared based upon information, including market prices, data and other information, believed to be reliable; however, Trade Nation does not warrant its completeness or accuracy. All market prices and market data contained in or attached to this communication are indicative and subject to change without notice.

USOIL: 15/12 daily analysisMiddle Eastern oil markets have weakened in recent weeks as rising regional and global supply has increasingly outpaced demand, reinforcing a broader narrative of oversupply. Producers in the region have added barrels at the same time as output continues to grow in the Americas, leaving Asian refiners with abundant alternatives and reducing pricing power for Middle Eastern grades. This has pushed key regional price differentials lower, leading Saudi Aramco to cut prices for its main Asian-bound crude to the lowest level in five years. Forecasts indicate that the imbalance will persist, with global supply growth expected to significantly exceed demand next year and production likely to remain above consumption through 2026. Faster unwinding of OPEC+ supply cuts, combined with rising inventories, is expected to keep pressure on prices and the forward curve in the months ahead.
On the technical side, the crude oil price has been in a bearish trend for the past couple of months, and it's currently testing the support of the lower boundary of the Bollinger Bands. The Stochastic oscillator is in extreme oversold levels, suggesting a potential bullish correction in the upcoming sessions, while the Bollinger Bands are sufficiently expanded, indicating that there is volatility to support any short-term sharp moves. The moving averages are also validating the overall bearish trend; however, there may be some bullish action for this week. If the bullish correction plays out, the first area of potential resistance may be seen around $60, which is both a psychological resistance level and the 38.2% Fibonacci retracement level of the weekly range.
Disclaimer: The opinions in this article are personal to the writer and do not reflect those of Exness

US100 trade ideaUS100 in bullish trend, After bull back and fib 0.38 level retract back toward its bullish direction.

REFEX INDUSTRIES LTD S/Rsanthosh
Support and Resistance Levels:
Support Levels: These are price points (green line/shade) where a downward trend may be halted due to a concentration of buying interest. Imagine them as a safety net where buyers step in, preventing further decline.
Resistance Levels: Conversely, resistance levels (red line/shade) are where upward trends might stall due to increased selling interest. They act like a ceiling where sellers come in to push prices down.
Breakouts:
Bullish Breakout: When the price moves above resistance, it often indicates strong buying interest and the potential for a continued uptrend. Traders may view this as a signal to buy or hold.
Bearish Breakout: When the price falls below support, it can signal strong selling interest and the potential for a continued downtrend. Traders might see this as a cue to sell or avoid buying.
MA Ribbon (EMA 20, EMA 50, EMA 100, EMA 200) :
Above EMA: If the stock price is above the EMA, it suggests a potential uptrend or bullish momentum.
Below EMA: If the stock price is below the EMA, it indicates a potential downtrend or bearish momentum.
Trendline: A trendline is a straight line drawn on a chart to represent the general direction of a data point set.
Uptrend Line: Drawn by connecting the lows in an upward trend. Indicates that the price is moving higher over time. Acts as a support level, where prices tend to bounce upward.
Downtrend Line: Drawn by connecting the highs in a downward trend. Indicates that the price is moving lower over time. It acts as a resistance level, where prices tend to drop.
Disclaimer:
I am not SEBI registered. The information provided here is for learning purposes only and should not be interpreted as financial advice. Consider the broader market context and consult with a qualified financial advisor before making investment decisions.

EUR-JPYThe important area for entry needs to be broken.
So keep an eye on the chart below and enter after it breaks.

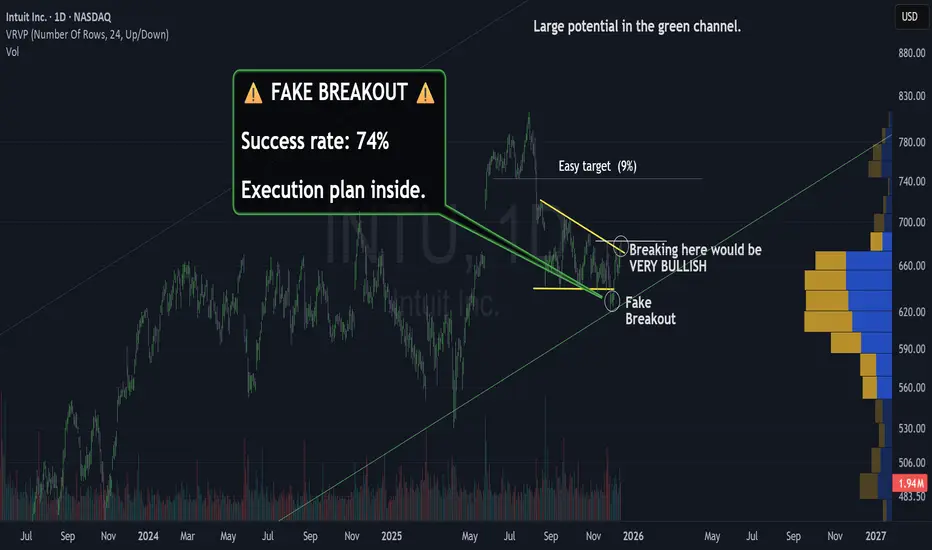
Intuit: Ready to Change the RulesIntuit: Ready to Change the Rules
Hello team,
Today I've been fascinated by the development on the chart of Intuit Inc. $NASDAQ:INTU.
When we look at the markets, we often search for chaos, but sometimes, the price action paints a picture of clarity and opportunity.
If we take a step back and observe the long-term trend , Intuit has formed what appears to be a classic Cup & Handle or an Ascending Triangle. While these patterns differ slightly in shape, they sing the same song: Continuation.
After a strong run, the stock is currently in a healthy pullback phase.
In the Daily Time frame, we recently witnessed a short squeeze that served as a wake-up call, creating a crystal-clear trend reversal pattern.
The Fake Breakout to the downside (visible on the chart) was quickly bought up, showing that buyers are eagerly defending these levels.
💡 But… Why that happened?
If you look at that violent U-turn on November 21st for NASDAQ:INTU , NASDAQ:ADBE or NYSE:CRM , it wasn’t a coincidence.
It was the day the market received the Proof of Life for the Software sector.
Here is the story behind the charts:
Until that week, the Wall Street fear was:
“AI is great for Nvidia (Hardware), but it will kill Software (SaaS) by replacing human seats.”
On November 21st, that fear died, because of a Triple Confirmation that happened in less than 24 hours:
1. Snowflake ( NYSE:SNOW ) crushed earnings and sent a clear message: Corporate spending is back. Companies aren’t cutting software, they are organizing their data to build AI agents.
2. Intuit ( NASDAQ:INTU ) Intuit proved that AI features (like “Intuit Assist”) aren’t just hype, they are actually generating new revenue.
3. A Fundamental Short Squeeze Suddenly, investors realized AI isn’t the enemy of Software, it is the growth engine. Thousands of traders who were betting against these stocks got trapped. They all rushed to the exit at the same time, triggering those explosive vertical green candles you saw.
Price doesn’t just move on numbers, it moves when a story changes. And on Nov 21 , the story changed and the charts are showing it to us clearly.
⚔️ My Battle Plan
We do not predict, we react to critical levels. Here is the roadmap for the coming weeks:
Entry point: We are waiting for a decisive breakout above the $683 level. This is the resistance that must be cleared with volume to confirm the move.
🛡️ Stop Loss inside the pattern, around 3-4%.
🎯 First Target (Short Term): Once $683 is broken, the chart suggests an easy target of approximately 9% to the upside.
🎯 The Green Channel (Long Term): If the bullish momentum sustains and we travel toward the upper boundary of the long-term channel, we could be looking at highly attractive returns of up to 30%.
Let the market come to you. Patience is the trader's greatest edge.
🎁 Let’s make a simple deal.
I will handle the heavy lifting to find the top 1% of setups like this, and you just HIT the 🚀 Rocket, Follow and Enjoy.
🤝 Deal?