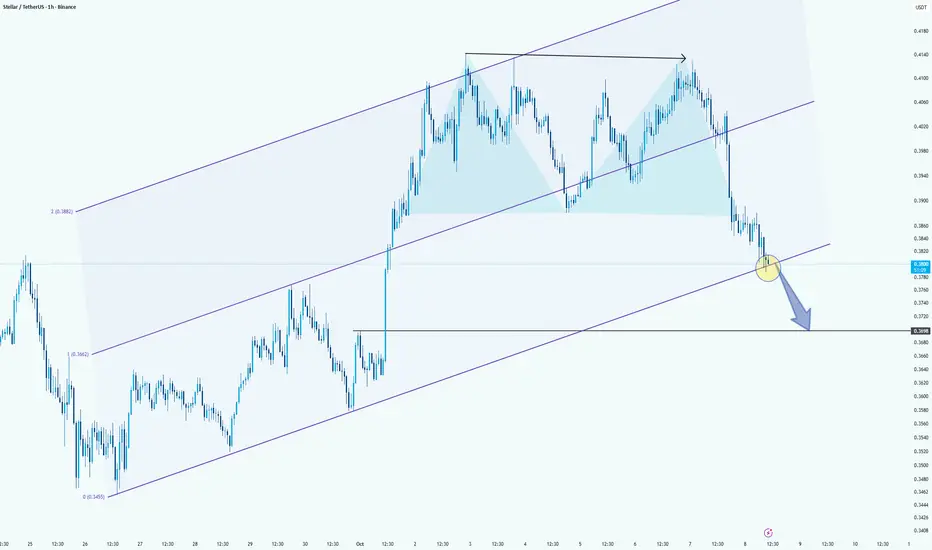
XLMUSD — Bullish Continuation Valid While Red B HoldsFrom the top-down view, XLM completed a deep corrective structure that bottomed inside the previous WCL (blue box). The current sequence builds a new bullish cycle , with the red ABC wave mapping cleanly against both structural and liquidity geometry.
Price reacted strongly from the red BC demand zone , producing a local yellow ABC micro-sequence. The setup anticipates continuation toward the upper WCL region (0.38 – 0.42) .
The re-entry area sits near the mid-trend retest—confirmation required via MSS + FVG displacement.
Invalidation:
This idea remains bullish until the red B low is broken . Violation of that pivot voids the wave count and resumes the broader correction.
Strengths: – Multi-timeframe alignment (macro + micro)
– BC demand reaction with displacement
– Defined invalidation under red B (lowest-risk logical stop)
Weaknesses:
– Correlation drag if majors retrace
– Shallow pullbacks may induce premature MSS signals
Summary:
Bulls control the rhythm while red B stands. Break B — and the music stops.
XLMUSD

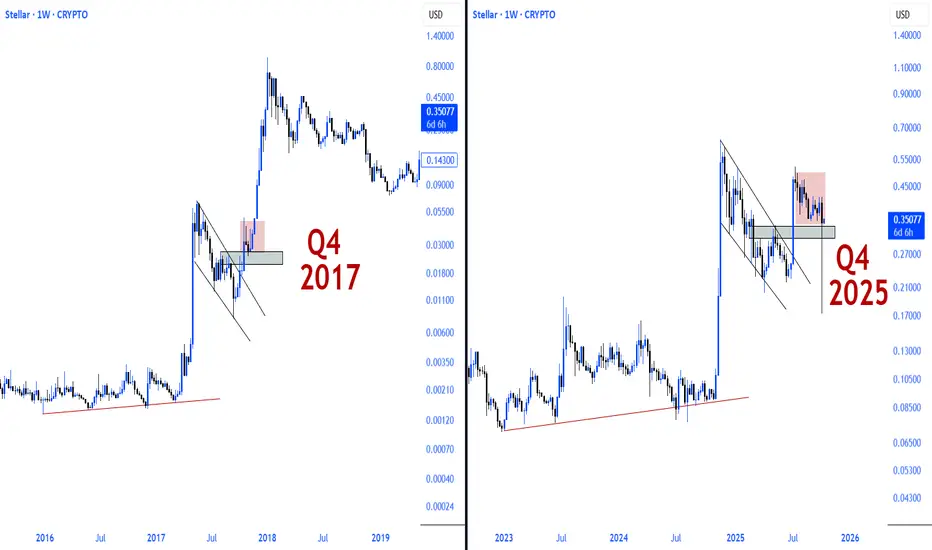
$XLM History Rhymes Again. Stellar once again mirrors its 2017 Wyckoff structure, deep accumulation, silent re-accumulation… and then the eruption.
Structure is set, momentum is brewing, only one phase left.
Parabolic Expansion.
Share if you like it 🤝

XLM/USDT — A Tense Standoff Between Bulls and Bears!XLM is currently sitting at a critical inflection point after a sharp mid-year rally, followed by a structured descending corrective channel. This setup signals that while bearish pressure remains dominant, quiet buying activity is emerging in the background.
Price is now consolidating right above the major support block around 0.29 – 0.32 USDT (yellow zone) — the same area that sparked a massive vertical breakout back in July. This zone has once again become a battleground between buyers and sellers.
In recent weeks, every dip into this region has triggered quick buy reactions, suggesting potential accumulation by larger players. However, the upper boundary of the descending channel continues to act as dynamic resistance, keeping the market in a tense balance awaiting a decisive move.
---
Key Technical Structure
Pattern: Descending Parallel Channel (structured correction after impulse move)
Major Support Zone: 0.29 – 0.32 USDT
Crucial Resistance: 0.351 USDT
Upside Targets if Breakout: 0.408 / 0.452 / 0.497 / 0.561 / 0.633 USDT
Downside Targets if Breakdown: 0.235 and 0.21 USDT
---
Bullish Scenario — “The Silent Accumulation Play”
If XLM successfully defends the 0.29–0.32 support zone and breaks above 0.351 with convincing daily volume, it could signal the start of a trend reversal.
A breakout from this descending channel could ignite a local short squeeze, pushing price toward 0.408 – 0.497, and potentially up to 0.63 USDT if bullish momentum strengthens.
Such a move would confirm the end of the corrective phase and mark the beginning of a new impulsive wave for XLM.
> “As long as this support holds, the potential for a reversal remains quietly alive.”
---
Bearish Scenario — “Break the Floor”
Conversely, if the demand block at 0.29–0.32 fails to hold, XLM could enter another capitulation leg, targeting 0.235 – 0.21 USDT.
This would confirm the continuation of the downtrend, with the descending channel acting not as a correction, but as a bearish continuation pattern.
Losing this critical support would give full control to sellers and expose the price to thin liquidity areas not revisited since early 2025.
---
Strategic Conclusion
XLM is standing at a make-or-break zone.
The longer the price holds above the yellow block, the stronger the case for a potential reversal wave. But one decisive daily close below 0.29 would likely shift the entire market structure back into a dominant downtrend.
> This quiet phase is where the next big move is being decided.
Don’t react — anticipate.
---
Analyst Notes
Volume remains muted, signaling potential accumulation.
RSI shows a mild bullish divergence (early signs of momentum shift).
Price structure is still locked within the channel; direction will be confirmed only upon a daily breakout.
---
#XLM #Stellar #CryptoAnalysis #TechnicalOutlook #CryptoMarket #Altcoins #CryptoTrading #TechnicalAnalysis #BreakoutSetup #SupportZone

$XLM Fractal $8.00Looking at fractal from the 2017 Era we can see there is a chance the parabolic movement at the end of the pattern will occur again. 1×10^-27

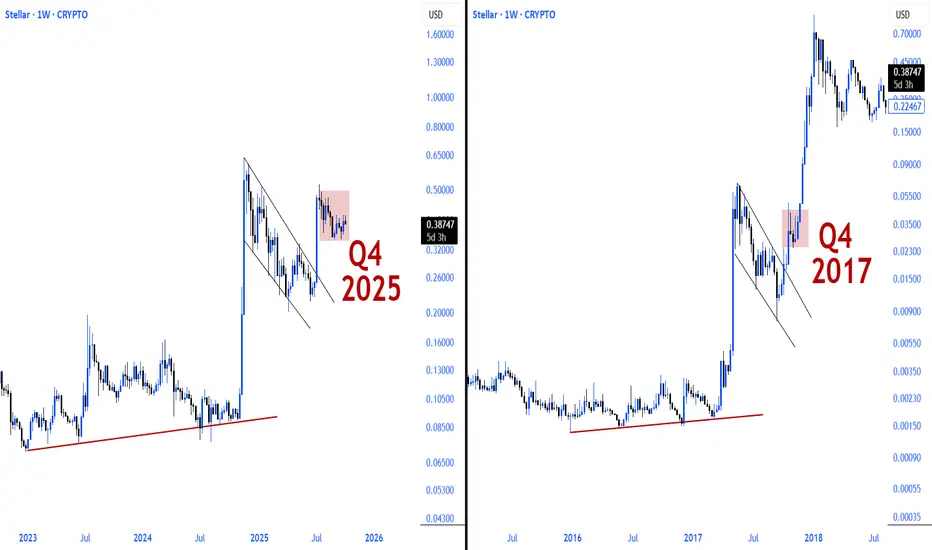
The 2017 and 2025 $XLM structures are strikingly similar.The 2017 and 2025 CRYPTOCAP:XLM structures are strikingly similar.
In 2017, a breakout occurred following a prolonged descending wedge formation, which then began a parabolic run after a brief accumulation phase above the demand zone.
The 2025 structure also forms a similar technical foundation.
Technical reflections of historical cycles.
Same structure, different cycle. However, market psychology and price behavior are shaped similarly.
While times may change, the recurrence of technical patterns is the clearest indicator of cyclical nature.
Dynamics that worked in the past are returning to the scene in the new cycle.
XLM is once again recapturing its historical rhythm.
XLM is the inseparable shadow of XRP.
If XRP runs, XLM will surely follow.
XLM/USDT Technical AnalysisHello guys!
It looks like a clear double top has formed on the chart, signaling potential bearish pressure. The neckline of this pattern has already been broken to the downside, confirming the reversal structure and adding weight to a potential move lower.
Currently, the price is sitting right on the lower boundary of the ascending channel. This is a key decision area, as long as the channel support holds, there’s still a chance for a short-term bounce. However, if this bottom trendline gives way, it would likely trigger a continuation of the bearish momentum that started after the double top confirmation.
If the breakdown happens, the next logical target sits around 0.3698 , which aligns with previous structure support. A sustained move below that level could open the door for further downside, possibly toward the 0.3450–0.3500 zone.
In short:
✅ Double top confirmed → neckline broken
⚠️ Price testing channel support
🔻 Break below = potential short setup toward 0.3698 and lower
$XLM \ Stellar running itThe 2017 and 2025 structures on XLM weekly chart are strikingly similar.
In both periods, a breakout occurred after a prolonged descending wedge formation.
The breakout in 2017 was followed by an aggressive rally. The 2025 structure is forming a similar technical foundation.
Technical reflections of historical cycles.
Stellar Eyes 22% Rally From Support Toward 0.44$Hello✌️
Let’s analyze Stellar’s price action both technically and fundamentally 📈.
🔍Fundamental analysis:
XLM just got its first U.S.-regulated ETF exposure with a small 0.3% share. It adds legitimacy, but big upside likely needs larger future ETFs.
📊Technical analysis:
BINANCE:XLMUSDT is approaching a key daily support and a trusted trendline, holding which could set up a 22% rally toward 0.44$. Traders should watch this level closely for a potential bounce. 📈🔍
📈Using My Analysis to Open Your Position:
You can use my fundamental and technical insights along with the chart. The red and green arrows on the left help you set entry, take-profit, and stop-loss levels, serving as clear signals for your trades.⚡️ Also, please review the TradingView disclaimer carefully.🛡
✨We put love into every post!
Your support inspires us 💛 Drop a comment we’d love to hear from you! Thanks, Mad Whale

XLMUSD getting ready for an explosive break-out.Stellar (XLMUSD) has been trading within a Descending Triangle since the July 18 High and currently is ranging within its Support level and the 1D MA50 (blue trend-line).
A similar Ascending Triangle back in May - June, rallied aggressively to its 2.0 Fibonacci extension (the July 18 High) after breaking above both its Lower Highs trend-line and the 1D MA50. Even the 1D RSI sequences among the two fractals are similar.
As a result, if the price breaks above the 1D MA50 - Lower Highs trend-line, we will turn bullish, targeting 0.78000 (Fib 2.0 ext).
-------------------------------------------------------------------------------
** Please LIKE 👍, FOLLOW ✅, SHARE 🙌 and COMMENT ✍ if you enjoy this idea! Also share your ideas and charts in the comments section below! This is best way to keep it relevant, support us, keep the content here free and allow the idea to reach as many people as possible. **
-------------------------------------------------------------------------------
💸💸💸💸💸💸
👇 👇 👇 👇 👇 👇

XLM/USDT | Falling WedgeBINANCE:XLMUSDT is forming a falling wedge pattern, and I’ve marked the breakout point.
Once it breaks out, I’d expect it to sequentially test the horizontal resistance levels.

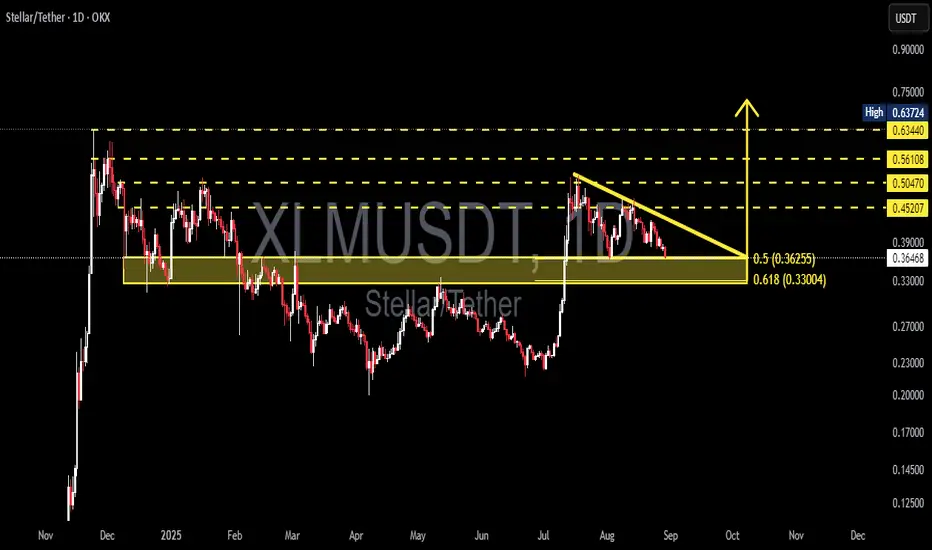
XLM/USDT — Critical Decision Zone at the Golden Confluence!XLM is currently trading at a make-or-break level. The daily chart shows the formation of a descending triangle, with sellers consistently pushing down the highs (lower highs) while buyers are defending a horizontal support zone between 0.3618 – 0.3295 USDT.
This zone acts as a “battle ground” due to several strong confluences:
Fibonacci 0.5 (0.3618) and 0.618 (0.3295) — the golden retracement area.
A historical demand zone (yellow box) that previously triggered strong rallies.
Multiple rejection wicks indicating buyers are still active around this level.
On the other hand, persistent lower highs reflect continuous seller pressure, shaping the descending triangle pattern which typically signals bearish continuation — unless a breakout occurs.
---
🔼 Bullish Scenario
If XLM manages to break above the descending trendline and daily close above 0.4052 USDT with strong volume, it will be a major bullish signal. Potential upside targets:
0.4520 USDT (first resistance / TP1)
0.5047 USDT (TP2)
0.5610 USDT (TP3)
0.634 – 0.637 USDT (psychological resistance, extended target)
Such a breakout could confirm the end of the accumulation phase and open the door for a stronger bullish trend.
---
🔽 Bearish Scenario
Conversely, if price fails to hold and we get a daily close below 0.3295 USDT, the descending triangle would be validated as a bearish continuation pattern. Downside targets include:
0.3295 USDT (first support at Fib 0.618)
0.2190 USDT (measured move projection of the triangle)
0.1997 USDT (historical low, last key support)
A breakdown below this golden pocket would suggest buyers are losing control and XLM may enter a deeper distribution phase.
---
📌 Pattern Summary
Descending Triangle → highlights dominant selling pressure, with buyers holding the base.
Golden Fibonacci Confluence + Demand Zone → makes 0.3618–0.3295 a critical decision zone.
Volume confirmation is key — without strong participation, both breakout and breakdown moves could be false.
---
🎯 Conclusion
XLM is at a crucial crossroads:
Breakout above 0.4052 → potential rally toward 0.452 – 0.505.
Breakdown below 0.3295 → triangle confirmation, targeting 0.22.
Traders should wait for daily close + volume confirmation before entering, and always apply strict risk management with stop-loss placement.
---
#XLM #XLMUSDT #Stellar #CryptoAnalysis #TechnicalAnalysis #Altcoins #CryptoTrading #DescendingTriangle #Fibonacci

Stellar Bullish FlagXLM/USDT formed a bullish falling wedge and is now approaching resistance. Breakout confirmation above 0.4161 opens the path to 0.5155, with potential extension to 0.6087. Wait for the breakout and the retest. Stop loss below 0.3425.
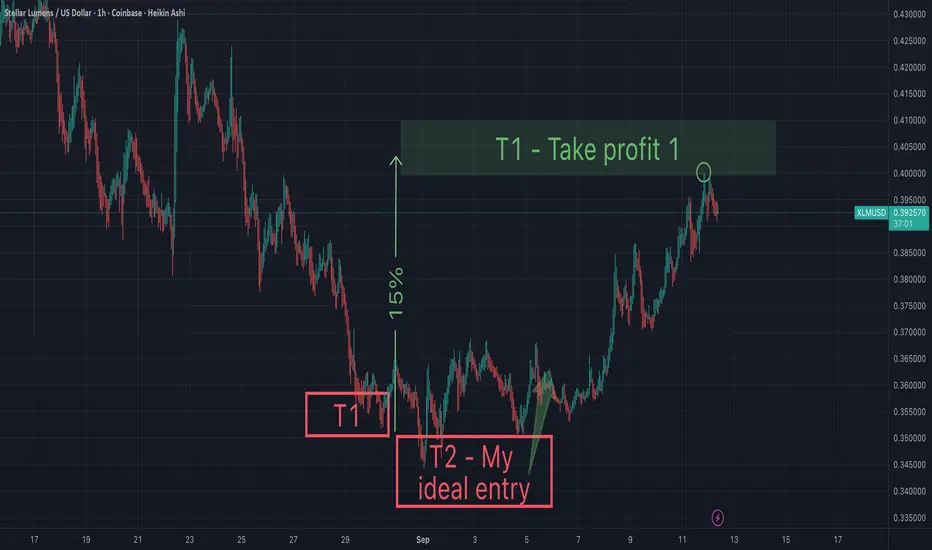
Xlm - Take profit targetI'm anticipating my take profit to be hit this weekend. I bought the bottom last Sunday, and I'm up 14%, so if my target hits, I'm up 20%. Xlm may continue up beyond my take profit target, but I don't want to be greedy. May the trends be with you.

You will ask yourself, "how did he know Xlm would do that"?On Aug 30th I suggested that Xlm would drop lower into my T2, then bounce to my "take profit 1". I am grateful this played out perfectly.
Now the question remains, will we get a pullback or continue up to my T2? What are your thoughts? I'd like to hear from you and get a sense of sentiment.
The Black Hole Swallowing $XLMStellar Lumens is showing clear signs of a bearish structure despite recent volatility. The chart suggests that price action may attempt a relief rally toward the $0.47 zone, but this move looks more like a corrective upswing within a broader downtrend.
Unless CRYPTOCAP:XLM can establish strong support above that level, the probability remains high that it will resume its descent, with a decisive move back below $0.34 on the horizon. In short, the gravitational pull of the broader market trend appears stronger than any short-term bounce.
Patience and risk management are critical here..this is less of a breakout and more of a classic bull trap in the making.

Stellar (XLM) Market Outlook — September 02, 2025Sergio Richi Premium ✅
#Stellar CRYPTOCAP:XLM — Market Outlook — September 02, 2025.
Current price : $0.3620
Charts:
Let’s be real: Stellar isn’t just another alt. It’s got actual utility — fast cross-border payments, cheap fees, and big-name partners (Visa, PayPal, MoneyGram, even Telegram wallets). That’s not meme-coin hype, that’s infrastructure.
Why It Matters
➖ Protocol 23 Upgrade (September 3, 2025): A major network enhancement focusing on scalability for tokenization and RWA use cases, including improved smart contract performance and data handling. This is expected to boost institutional adoption and could drive XLM toward $1.27-$2.39 if bullish momentum holds.
➖ Archax Partnership (August 18, 2025): Collaboration with institutional-grade exchange Archax to accelerate RWA tokenization, including fractional real estate and yield-bearing assets.
➖ PayPal PYUSD Integration (July–August 2025 Impact): PayPal's stablecoin on Stellar triggered a 5% price surge earlier, with ongoing effects into August. PayPal's Digital Currencies SVP joining SDF further strengthens ties.
➖ Telegram Wallet Integration: Enables seamless XLM transfers within chats, boosting mass adoption.
➖ ZARC Stablecoin Launch (Ongoing 2025): TD Markets' South African Rand-pegged asset on Stellar, ideal for remittances.
➖ Visa Stablecoin Settlement Support: Visa added Stellar for settlements with PYUSD, USDG, and EURC, enhancing global payment rails.
➖ UNDP Partnership and SDG Accelerator: Stellar joins for pilots in climate finance and social protection.
➖ RWA and DeFi Milestones: Q2 2025 saw $4 billion in RWA payments, with tokenized assets rising from $15.2B to $24B. DeFi TVL growth across protocols signals real-world utility.
The Trade
XLM is sitting at $0.36 after a choppy summer. In my book, it’s coiling for the next leg of the global bull run.
🎯 Targets:
➡️ Take Profit 1: $1.27 (+250%)
➡️ Take Profit 2: $2.39 (+560%)
Final Take
Stellar’s building the rails while half the market’s still arguing about ETFs. At these levels, risk/reward screams long.

XLM: Hidden Accumulation Before a Violent Breakout?Yello, Paradisers do you see what’s happening on Stellar right now? While most eyes are turned away, XLM has been quietly carving a base inside a major demand zone, and the setup looks like it could fuel a massive move soon.
💎After weeks of pressure inside a descending channel, #XLMUSDT finally broke out, confirming that sellers are losing strength. For the last several days, XLM has been consolidating right above demand at $0.34–$0.35, holding firm despite repeated retests. This zone remains the line in the sand: as long as it’s defended, buyers keep the upper hand.
💎The breakout area around $0.37 is crucial now. A sustained close above it can trigger momentum toward the $0.42 minor resistance, and eventually even $0.48 where strong supply waits. On the flip side, failure to hold the demand zone could open the door for a deeper flush down into the invalidation area near $0.28, a level that would completely shift the outlook back to bearish.
💎Momentum indicators are already hinting at early accumulation, with signs of buyers stepping in at each retest of support. If this continues, #XLM could deliver a sharp vertical move that catches most of the market unprepared.
🎖Strive for consistency, not quick profits. Treat the market as a businessman, not as a gambler.
MyCryptoParadise
iFeel the success🌴

Is $XRP ready for another leg higher? After breaking out of a 6 month consolidation, XRP broke out from 2.4 and hit 3.6 in late July - is it ready to test the 3.6 level again after consolidating for about 40 days? 2.85 appears to be a good entry with a stop loss of 2.6. Best of luck if you are following.

The XLM chart looks STELLARSince making a High in January of 2018 at just shy of a dollar.
This Asset has made subsequent higher lows during the following two bear markets for #Altcoins. Suggesting strong accumulation from "smart" money.
The last bear was an extended bear for alts. Which allowed for even more time to accumulate this asset.
Leading to a pressure cooker situation with a clear level that will mark the explosion.
The horizontal level at around 52 cents is clear level for which this asset must close to ignite what could possible be a substantial rally!

XLM — Stellar Lumens: AI x RWA, Real Utility, Real Momentum⭐️ XLM — Stellar Lumens: AI x RWA, Real Utility, Real Momentum
Buy/Hold bias aiming for $0.75 🎯; reload zone ~ $0.25 🔁.
Thesis rests on tokenization (RWA) traction, US gov data on-chain, and 2025 scaling roadmap (5k TPS target, faster blocks) + AI tooling around Soroban. If thesis plays out, upside case ≈ +200% from reload—not financial advice.
________________________________________
🔥 Why now (meaningful catalysts)
• US Dept. of Commerce → GDP on Stellar
First time ever: the Commerce Department is putting official GDP data on-chain (hash) on Stellar, creating an immutable, public record—big signal for gov-grade data + DeFi oracles. (Stellar)
• RWA push: new partners & capital-market pipes
SDF’s 2025 goal: $3B RWA value & $110B volume; continuing integrations with Franklin Templeton, Paxos, Ondo, SG Forge. Recent Archax investment targets regulated tokenization rails. (CoinDesk, Stellar)
• Scaling roadmap → utility unlocks
Targeting ~5,000 TPS, 2.5s blocks, OpenZeppelin token standards, and 100× payout capacity (Merkle trees). These hit the exact pain points for enterprise/RWA and payments at scale. (Stellar)
________________________________________
🤖 The AI angle (pipeline + tools)
• Official roadmap AI
o Stella AI Assistant (enhanced) → a more capable agent interface for builders.
o Contract Copilot → AI-assisted smart-contract generation, linting & testing.
These live on SDF’s 2025 roadmap. (Stellar)
• Community AI on Soroban
o AI Agent Kit: lets AI agents interact with Stellar accounts & Soroban contracts.
o SoroBuilder: AI-driven in-browser Soroban contract builder/auditor.
o AI Transparency Token (AITT): compliance attestations on-chain. (Stellar Community Fund)
Net: AI lowers dev friction (faster dApp iteration) and expands use cases (agents, audits, compliance)—a pull for builders who need programmable money + verifiable data.
________________________________________
🧱 Building blocks already in place
• Smart contracts live (Soroban via Protocol 20) → programmable RWA/DeFi. (Oodles Blockchain)
• Freighter wallet upgrades + RPC/ETL improvements → smoother infra & analytics for apps. (Stellar)
• Stablecoin/RWA breadth (e.g., Franklin’s BENJI, Ondo USDY coming to Stellar) → liquidity primitives that institutions recognize. (Stellar)
________________________________________
📣 Recent social buzz (signal, not noise)
• SDF amplified the GDP-on-chain milestone across socials, triggering wider crypto media pickup.
See SDF’s X post and summary thread references. (X (formerly Twitter))
________________________________________
🧭 Levels & plan (author’s framework)
• Primary target: $0.75 🎯 if catalysts execute (RWA flow + scaling).
• Reload zone: $0.25 🔁 (where bulls re-accumulate in my playbook).
• Positioning: Buy/Hold bias for asymmetric upside tied to execution (RWA + AI-tooling + throughput).
• Risk: headline/regulatory risk on RWAs, roadmap slip, crypto beta. Size accordingly.
Note: A +200% outcome reflects upside math from reload zone to target; it’s not a guarantee. Do your own research.
________________________________________
🗓 What to watch next
• Roadmap drops through Q4-2025:
o 2.5s block times target,
o OpenZeppelin token standards for assets/RWAs,
o Freighter mobile & advanced auth,
o Payouts 100× capacity. (Stellar)
• RWA onboarding flow: progress with Archax, Paxos, Ondo, and Franklin—TVL/volume & issuer announcements. (CoinDesk, Stellar)
• Gov/enterprise data on-chain follow-ups after Commerce/GDP—possible spillover into on-chain data feeds for DeFi. (Stellar

Xlm - Support and resistance & take profitsXlm - Support and resistance & take profits. T1 was hit yesterday, but there is a strong possibility we go lower into T2 (my ideal buy zone- for a short term bounce to green T1).
May the trends be with you.

XLM/USDT — Descending Triangle at a Key Fibonacci Zone!🔎 Market Overview
Currently, XLM/USDT (Daily, OKX) is trading around 0.3645, testing the golden support zone between 0.3625 (0.5 Fib) and 0.3300 (0.618 Fib).
This area is highly significant because:
It has acted as a historical demand zone, repeatedly holding the price.
It aligns with the Fibonacci golden pocket (0.5 & 0.618 levels), often watched by institutional traders.
Price action forms a descending triangle, where sellers create consistent lower highs while buyers defend a horizontal floor.
In short, we are at a make-or-break decision point: will XLM break down further, or will buyers trigger a strong breakout against the classic bearish setup?
---
📐 Structure & Technical Context
Pattern: Descending Triangle → statistically bearish continuation, but strong support zones often trigger bullish fakeouts.
Lower Highs: indicate steady selling pressure.
Horizontal Support: strong cluster around 0.33 – 0.3625, coinciding with golden pocket Fib levels.
Key Resistances Above:
0.4520
0.5047
0.5610
0.6340 – 0.6370 (major supply zone).
A breakout above could flip the triangle into a bear trap and spark a mid-term rally.
---
🚀 Bullish Scenario
Main condition: price must break above the descending trendline with a convincing daily close + high volume.
Conservative entry: wait for breakout + retest (price breaks the trendline, then retests as support).
Upside Targets:
TP1 = 0.4520
TP2 = 0.5047
TP3 = 0.5610
TP4 = 0.6340 – 0.6370 (major resistance zone).
Invalidation: daily close below 0.33 (breakdown confirmed).
📊 Example Risk/Reward:
Entry = 0.3645
Stop = 0.33
TP1 = 0.4520
→ Risk = 0.0345 | Reward = 0.0875 → R:R ≈ 2.5 : 1
---
🩸 Bearish Scenario
If support breaks:
Trigger: daily close < 0.33 (0.618 Fib).
Downside Targets:
First = 0.27
Next = 0.23
Extended = 0.17 (historical swing low).
Strategy: short on breakdown + retest (support turned resistance).
Invalidation: price reclaims trendline & closes above 0.4520.
---
📊 Trading Plan Summary
The 0.33–0.3625 zone is the golden decision point:
Holding → potential bullish rally.
Breaking → deeper bearish continuation.
The descending triangle clearly shows where pressure is building.
Always manage risk tightly, as this pattern often creates false breakouts before the real move.
---
XLM is sitting at a critical crossroads. A descending triangle has formed exactly on the golden pocket Fibonacci (0.33–0.3625). A breakout could trigger upside targets at 0.45 / 0.50 / 0.56, while a breakdown could lead to 0.27 / 0.23. Wait for daily close + volume confirmation. This golden zone will decide XLM’s next big move.
#XLM #Stellar #XLMUSDT #CryptoAnalysis #Altcoin #DescendingTriangle #SupportResistance #Fibonacci #Breakout #BearishOrBullish #SwingTrade
XLM Breakout Watch | How Global Markets Are Setting the StageIn this update, I break down XLM’s mid-term outlook and why the $0.65 level is a key breakout zone to confirm further upside. Based on current patterns, I’m targeting a potential move into the $100–$138 range over the mid-term.
While Bitcoin still influences XLM, the backdrop of massive money printing since 2018 has created conditions for meaningful accumulation, setting the stage for higher prices. Add to that an environment of rising interest rates, Fed interventions, and volatility cycles, and it’s clear we’re only at the beginning of what could be a period of outsized returns.
Stellar’s role in a shifting economic system also can’t be ignored. As fiat currencies face structural limits, crypto offers a framework that breaks those shackles, with altcoins like XLM poised to outperform Bitcoin in the next cycle.
Markets will continue to follow their familiar pump-and-dump patterns, but each cycle brings diminishing returns for central bank interventions—leaving room for crypto markets to step in and restore balance.
Stay tuned for the charts and insights that put these patterns into perspective.
