XTZ Major Resistance Ahead — Breakout or Rejection?XTZUSDT remains in a long-term downtrend, characterized by a *Descending Trendline* connecting a series of progressively lower price peaks (*lower highs*).
After experiencing significant selling pressure and reaching a low of approximately $0.1914, the price has started to recover, moving toward the $0.3312 area.
Currently, the price is testing a critical zone around the descending trendline. This area could determine XTZ's next move: will the price break through dynamic resistance and initiat
Xtzusdsignals
XTZ at a Critical Resistance — Breakout or Rejection?📊 Technical Analysis — CRYPTOCAP:XTZ
⏳ Time Frame: 3D
📍 Current Price: ± $0.2717
📐 Pattern: Descending Trendline
🎯 Key Resistance: $0.3400 → $0.4000 → $0.4400 → $0.6000
🛡️ Major Support: $0.2200 → $0.1915
---
📐 PATTERN ANALYSIS — DESCENDING TRENDLINE
🔻 A Descending Trendline forms when price consistently creates Lower Highs (LH) and remains below a declining trendline.
On the XTZ/USDT 3D chart, the yellow line represents dynamic resistance that has been suppressing price for an extended p
$XTZ Long-Term Accumulation AnalysisSEED_DONKEYDAN_MARKET_CAP:XTZ Long-Term Accumulation Analysis
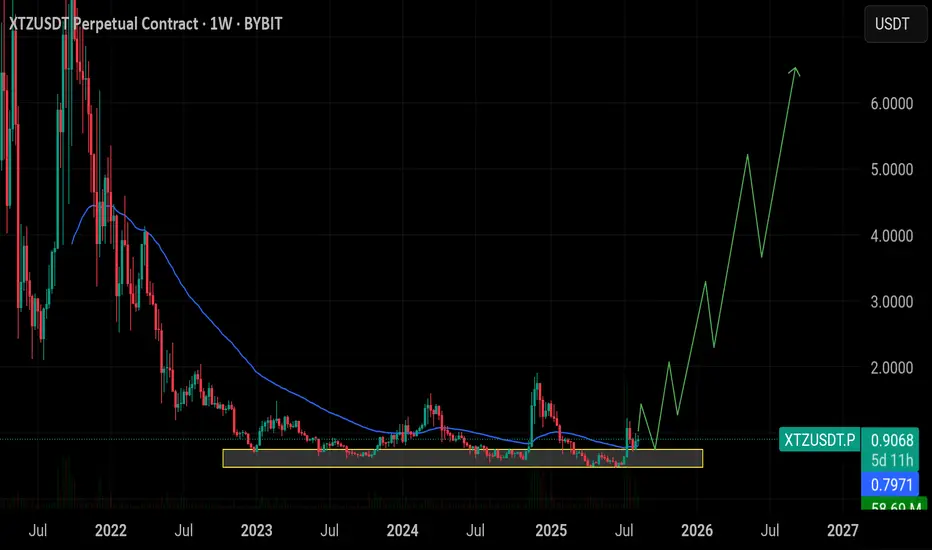
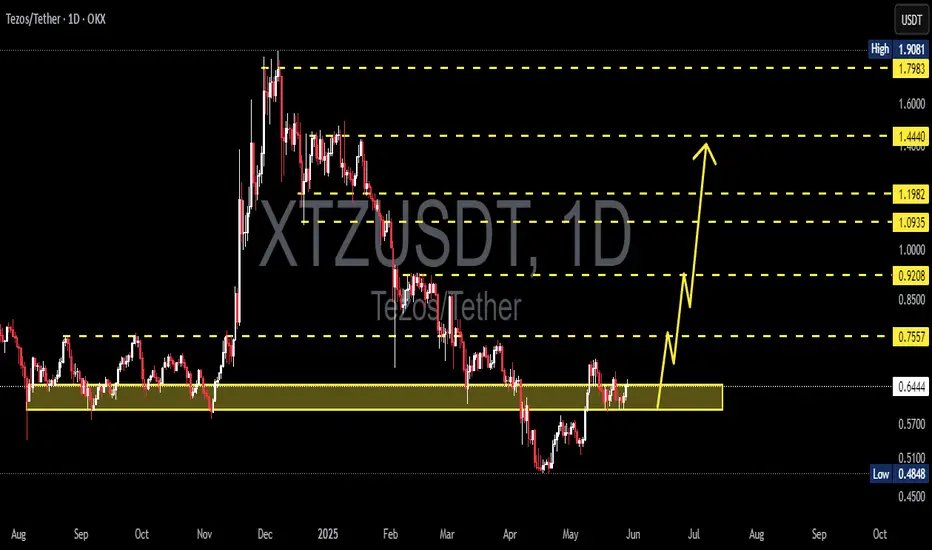
🔸XTZ has been consolidating in a major accumulation zone between $0.50 – $0.76 for a long period, showing strong demand at lower levels. Current price is above this range, suggesting patience is needed for the bulk of entries — but partial exposure can be taken now to avoid missing upside.
🔸 Smart Entry Zone:
Primary accumulation entries remain between $0.50 – $0.76. Wait for a pullback into this range to add larger positions, but
XTZ Is Waking Up – Next Stop $2.25?SEED_DONKEYDAN_MARKET_CAP:XTZ is currently bouncing from the lower boundary of a broadening wedge pattern on the weekly chart, signaling a potential trend reversal. This structure, characterized by widening price swings, has been developing since mid-2022.
The recent bullish move has pushed the price above a key resistance zone, with rising volume supporting the momentum. The upper boundary of the wedge aligns with the next major target zone near $2.25.
Resistance 1: $1.00
Resistance 2: $1.4
XTZUSDT: Buyers Could Step In Here! XTZUSDT: Buyers Could Step In Here! 🔥
This blue box marks a critical level where buyers might become active from multiple perspectives.
Key Confirmation Factors:
CDV spikes, lower timeframe upward structure breaks, buyer dominance on volume profile, and liquidation heatmaps showing fresh liquidity above.
Reactions here could be pivotal. Keep your strategy sharp and always confirm your entries.
Don’t just watch! Act! Boost, comment, and follow for more killer insights! 🚀
Let me
XTZ/USD: Strong Bearish Case Building – Technical AnalysisLooking at the XTZ/USD daily chart, multiple technical indicators and price action are aligning to present a compelling bearish case. Here's why I'm convinced we're heading lower:
Key Bearish Evidence:
MACD Structure
The MACD indicator is showing textbook bearish signals:
Clear bearish crossover on the daily timeframe
Histogram bars turning increasingly negative
Momentum clearly shifting downward
This suggests strong selling pressure and weakening buying interest.
RSI Confirmation
The RSI t
XTZUSDT Analysis: Is a Big Move on the Horizon?Yello Paradisers! Ready for another deep dive into the #XTZUSDT action? Let's uncover what's brewing and how you can navigate the market like a pro.
💎Currently, SEED_DONKEYDAN_MARKET_CAP:XTZ is sitting pretty within a crucial support zone at $0.740. This position hints at a potential upward swing, provided it maintains its current momentum. A breakthrough from this level could see it breach a major supply zone.
💎Reflecting on recent performance, SEED_DONKEYDAN_MARKET_CAP:XTZ has shown res
XTZUSD Extinct crypto starting to move?Tezos (XTZUSD), a long forgotten market favorite, is posting today the strongest 1D green candle since February 22 2023. This is backed up by a long 1D RSI Bullish Divergence. As long as the 0.6300 Support holds, we expect XTZ to target first the Lower Highs 2 (dashed) trend-line and the 1D MA200 (orange trend-line) and finally the strongest long-term Resistance Cluster, the 1W MA50 (red trend-line) along with the 0.92500 Resistance.
Our target is 0.9000. Notice the similarities between the cur
XTZUSDT Idea and AnalysisHI dear traders!
The 200-Day SMA has become a support line for the uptrend and the bullish major channel is still valid.
After price crossing the short-term and downward trend line (The minor trend channel), the price moves bullish towards the daily pivot point.
✅ ✅ Risk warning, disclaimer: the above is a personal market judgment and analysis based on published information and historical chart data on The trading view,
And only some of these analyzes are my actual real trades.
I hope Traders c
#Xtz is in the important Price******* First of all I Should Say Trade with your own Risk*******
XTZ is in the Strong Support Line in 4H Time Frame.
If the Line Support the Price it can goes to the S1,S2,S3
But if it breaks the support Line it can goes deep in the ocean :)
if you see the positive sign you can buy at 6.2 for target 6.6 or 7 in first step.
the RSI Stoch is going to cross from the button.
XTZ/USDT - LONG ----- Welcome, dear followers! -----
- Here is my trading methodology. I trade with a normal system and analysis of resistance and support, as well as price reversal patterns.
- For the record, I do not place a stop loss within my trades. So that I only risk 1.5% of my total capital in order to support the loss due to a price reversal against me.
- If a price reversed against my expectation and touched the drawn line r3, then I transferred targets to the entry point and waited for the price to c
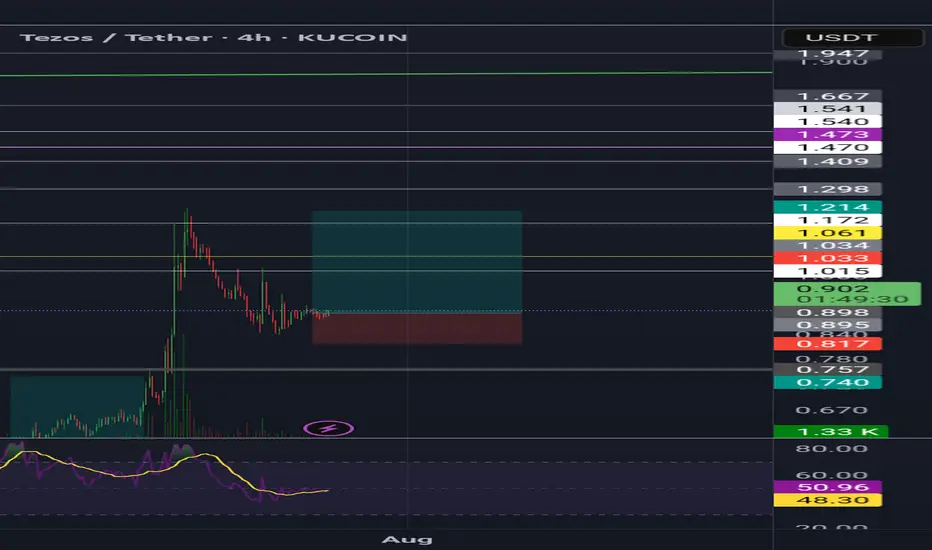
XTZUSDT Long SignalXTZUSDT has made some clear moves in the near-past and it has confirmed the Short term confirmation, which is clearly seen in the chart. It's just a matter of time for it to gain momentum and go sky-rocketing in the upward direction. I am fully bullish on XTZUSDT and currently my setup for $XTZ is as follows:
Entries : 1.21 - 1.40
One time Entry: 1.34
Short Term: 1.42 - 1.52 - 1.60 - 1.72 - 1.85 - 1.94
Mid Term: 2.10 - 2.48 - 2.93 - 3.58 - 4.72 - 6.08
1.08 - 1.02 (Trailing)
Please be
#XTZ/USDT LONG TRADE SETUP #XTZ/USDT LONG TRADE SETUP
LONG ENTRY:-$1.59 - $1.61
STOPLOSS:-$1.56
TARGET:-7% TO 10%
LEVERAGE :-10X TO 20X
Remember:-This is not a piece of financial advice. All investment made by me is at my own risk and I am held responsible for my own profit and losses. So, do your own research before investing in this trade.
Do hit the like button if you like it and share your charts in the comments section.
Thank you.