GBPNZD Long TradeBulls have shown up and I believe we will see a short term uptrend.
Targets are in 1x, 2x and 3x Stop Loss, and coincide with key resistance levels.
🚀 Entry = 2.07745
☠️ SL = 2.06585
🏆 TP =
- 2.08908
- 2.10055
- 2.11221
Forex market

Long positions unlock the Godzilla mode Take your time and study these things until your eyes can see them .1hr analysis. Waiting for the market is key to success

NZDJPY BULLISH TREND REBOUND AREA OF INTERESTThis below is a good area of interest supporting the currently dominant Bullish trend. We have:
1. Fair value Gap
2. 2x break of structure
3. Demand zone
Seeing how price has taken out swing high, we would like to go long if pruce returns here.
KEEP THIS FOR FUTURE REFERENCE ✔️🌟

EURUSD - Long Term analysisI wuold like share my long terms idea on EURUSD.
The cross has broke the channel long after top on 1.115
Probably we are on ABC structure and in a short channel (in red)
IF we are in ABC structure probably we will be in wave C final
From my point of view we have completed the first and second wave of C and for the next week we can have the final 3 and 5 wave with first target target 1.06 and second target 1.03 and final value 1.

Gbpjpy Buy setupAs you can see on the chart. The Big Players are in. We have a momentum candle break out of Structure, an order block and FVG.
We will share the account end of week📈 Goodluck.

[EDU-Bite Sized Mini Series] When to trade for best bang for $$?Hello fellow traders , my regular and new friends!
Welcome and thanks for dropping by my post.
Okay, let's get started on today's topic. Knowing when to trade and when NOT to trade is very important. This is the "timing" element which is also a crucial part of trading. And, this is especially important if you are looking to trade on a lower timeframe!
Understanding the different trading sessions in the forex market and identifying the best times and days to trade can significantly improve trading success. Here's a breakdown of the major forex trading sessions and their characteristics:
Asian Session (Tokyo/Singapore/Hong Kong):
The Asian session begins with the opening of the Tokyo market, though the AUD and NZD starts trading earlier than it. It's known for lower volatility compared to other sessions, with currency pairs like USD/JPY and AUD/USD often experiencing increased activity.At times, if there's a important news release such as FED interest rate release or Non- farm payroll on a Friday. The preceding Asian Session could have "spill over" activity and increased in volatility in the FX market.
European Session (London):
The European session, centered around London, is considered the most active session (besides the US). It often sees high liquidity and volatility, making it ideal for day traders. Major currency pairs like EUR/USD, GBP/USD, and EUR/GBP typically exhibit significant movements during this session.
3. North American Session (New York):
The North American session overlaps with the end of the European session, creating a period of increased activity. Day traders loved the volatility during this period of time, more over key news releases could be catalyst for further volatility. It's characterized by liquidity from both European and American traders. Currency pairs involving the USD, such as EUR/USD, USD/JPY, and GBP/USD, are particularly active.
4. Best Times to Trade:
To be specific, the best times to trade forex are typically during the overlap of multiple trading sessions when liquidity and volatility are highest. This occurs during the overlap of the European and North American sessions, known as the "London-New York" overlap, which occurs from 8:00 AM to 12:00 PM EST. Another optimal period is during the overlap of the Asian and European sessions.
Best Days to Trade
While forex markets are open 24 hours a day, five days a week, certain days tend to offer more trading opportunities. Tuesday, Wednesday, and Thursday are generally considered the best days to trade, as they typically see higher volatility and more significant price movements compared to Mondays and Fridays.
By understanding the characteristics of each trading session and identifying the optimal times and days to trade, you can enhance your trading strategies and capitalize on the most favorable market conditions.
Do check out my recorded video (in trading ideas) for the week to have more explanation in place.
Do Like and Boost if you have learnt something and enjoyed the content, thank you!
-- Get the right tools and an experienced Guide, you WILL navigate your way out of this "Dangerous Jungle"! --
*********************************************************************
Disclaimers:
The analysis shared through this channel are purely for educational and entertainment purposes only. They are by no means professional advice for individual/s to enter trades for investment or trading purposes.
*********************************************************************

GBP/CAD BEARS ARE GAINING STRENGTH|SHORT
Hello,Friends!
GBP/CAD pair is in the uptrend because previous week’s candle is green, while the price is obviously rising on the 9H timeframe. And after the retest of the resistance line above I believe we will see a move down towards the target below at 1.721 because the pair overbought due to its proximity to the upper BB band and a bearish correction is likely.
✅LIKE AND COMMENT MY IDEAS✅

GBP/AUD SELLERS WILL DOMINATE THE MARKET|SHORT
Hello,Friends!
GBP/AUD pair is trading in a local uptrend which we know by looking at the previous 1W candle which is green. On the 2H timeframe the pair is going up too. The pair is overbought because the price is close to the upper band of the BB indicator. So we are looking to sell the pair with the upper BB line acting as resistance. The next target is 1.904 area.
✅LIKE AND COMMENT MY IDEAS✅

EUR/AUD BEARS WILL DOMINATE THE MARKET|SHORT
Hello,Friends!
EUR-AUD uptrend evident from the last 1W green candle makes short trades more risky, but the current set-up targeting 1.627 area still presents a good opportunity for us to sell the pair because the resistance line is nearby and the BB upper band is close which indicates the overbought state of the EUR/AUD pair.
✅LIKE AND COMMENT MY IDEAS✅

EUR/NZD SHORT FROM RESISTANCE
Hello,Friends!
Previous week’s green candle means that for us the EUR/NZD pair is in the uptrend. And the current movement leg was also up but the resistance line will be hit soon and upper BB band proximity will signal an overbought condition so we will go for a counter-trend short trade with the target being at 1.770.
✅LIKE AND COMMENT MY IDEAS✅

[EDU-Bite Sized Mini Series]All you need for Order types in FX Hello fellow traders , my regular and new friends!
Welcome and thanks for dropping by my post.
Understanding the various order types in forex trading is essential for navigating the market efficiently and executing trades effectively. Here's a concise overview of some common order types:
1. Market Order:
This order is executed immediately at the current market price. It is used when a trader wants to enter or exit a trade quickly.
More of for Day Trading - A trader might use market orders to quickly enter and exit positions based on real-time news events or technical signals.
Live example
> A trader sees a positive European's news release and expects a quick upward move in the EUR/USD pair. They use a market order to buy EUR/USD at the current price of 1.1950, aiming to sell it later in the day at a higher price based on the expected market reaction.
2. Limit Order:
A limit order allows traders to specify the price at which they want to enter or exit a trade. It's used to buy below the current market price or sell above it, ensuring entry or exit at a specific price level or better.
For example for Swing Trading - A trader might place a buy limit order at a support level, expecting the price to bounce back up, or a sell limit order at a resistance level, expecting the price to fall.
Live Example
> A trader identifies strong support for USD/JPY at 110.50 and places a buy limit order at this price, expecting the price to rebound. When the market price dips to 110.50, the order is executed, and the trader aims to sell at 111.50.
3. Stop Order(Stop-Loss Order):
A stop order becomes a market order once a specified price level is reached. It's commonly used to limit losses or protect profits by triggering a trade when the market moves in a certain direction.
This, in my opinion should be used as Risk Management for all traders - A trader sets a stop-loss order below the entry price for a long position or above the entry price for a short position to limit potential losses if the market moves against their position.
Live Example
> A trader buys GBP/USD at 1.3500, anticipating a rise. To protect against unexpected drops, they place a stop-loss order at 1.3450. If the price falls to 1.3450, the order executes, limiting the trader's loss to 50 pips.
4. Stop-Limit Order:
A stop-limit order combines features of both stop and limit orders. It triggers a limit order to buy or sell at a specified price once the stop price is reached, offering more control over entry and exit prices.
More of for Advanced Trading - A trader might use a stop-limit order to ensure they enter a position only if the price reaches a certain level but still want to control the maximum price they are willing to pay.
Live Example:
A trader wants to buy EUR/GBP only if it breaks above 0.8500 but not pay more than 0.8520. They place a stop-limit order with a stop price of 0.8500 and a limit price of 0.8520. If the price hits 0.8500, the order becomes a limit order, executing only if the price is 0.8520 or lower.
5. Trailing Stop Order: A trailing stop order is a dynamic stop-loss order that adjusts automatically as the market price moves in the trader's favor. It helps lock in profits while allowing for potential further gains.
For Trend Following - A trader might use a trailing stop order to lock in profits as the price moves in their favor, allowing the stop price to trail the market price and protect gains if the market reverses.
A trader buys USD/CAD at 1.3000 and sets a trailing stop order with a 50-pip trail. As the price rises to 1.3100, the trailing stop adjusts to 1.3050. If the price then falls to 1.3050, the order executes, locking in a 50-pip profit.
Hopefully these explanations on the various Trading Orders open you up to more strategies that you can applied in the market for you to trade more efficiently and profitably!
Do check out my recorded video (in trading ideas) for the week to have more explanation in place.
Do Like and Boost if you have learnt something and enjoyed the content, thank you!
-- Get the right tools and an experienced Guide, you WILL navigate your way out of this "Dangerous Jungle"! --
*********************************************************************
Disclaimers:
The analysis shared through this channel are purely for educational and entertainment purposes only. They are by no means professional advice for individual/s to enter trades for investment or trading purposes.
*********************************************************************

NZDUSD MAY GO BULLISH FROM 0.61035 LEVELIf price is offered at 0.61035, a buy opportunity is envisaged .
Price is currently falling to our buy price at 0.61035 level where we look forward to going long.

AUDUSD IN UPTRENDAUDUSD after consolidation know in uptrend currently testing trend line, buying at current level can be a good trade .

EURUSD potential swing sellUSD gained some ground this week. Let's see if it's going to keep holding up.
FOMC minutes might be a catalyst for this trade

Professional analysis strategy, hope to help you!Eurusd is expected to consolidate until we reach the bullish marker area.
You can also expect a smaller pullback, and then the bulls.

USDJPY May 22, 2024 Will the rising wave continue?Hello everyone, DEEKOP is ready to bring the most accurate signals and assessments to everyone.
Financial freedom is true freedom.
Looking at the H1 chart with the current wave counting method we see
The correction process has formed 3 waves abc
- Currently, the price continues to increase following the trend of large wave 3
- We have the main confirmation threshold at 156,554, this is the confirmation area that the temporary adjustment process has ended.
- Once the price maintains above the 156.554 area, the price will develop very quickly because wave 3 moves quickly and sharply.
Note: Sufficient TP, SL to be safe and win the market‼ ️Change data plan will be updated later.
Deekop's analysis is only a personal opinion with a desire to share its views with the community. I'm not always right. But my analysis always reflects my meticulous evaluation of what is best for an investment.

NZDJPY NZDJPY is going down due to massive bearish divergence , we have to enter in market as sell stop and ride the trend
ENTRY PRICE
SELL STOP 95.02
STOP LOSS 96.13
TAKE PROFIT 93.60

check the trend According to the behavior of the price in the current resistance range, possible scenarios have been identified.
It is expected that the continuation of the upward trend will be formed until the specified resistance level

check the trend According to the behavior of the price in the current resistance range, possible scenarios have been identified.
As long as the price fluctuates above the support range, the continuation of the upward trend is likely.
Otherwise, with the breaking of the support range, it will be possible to start a downward trend

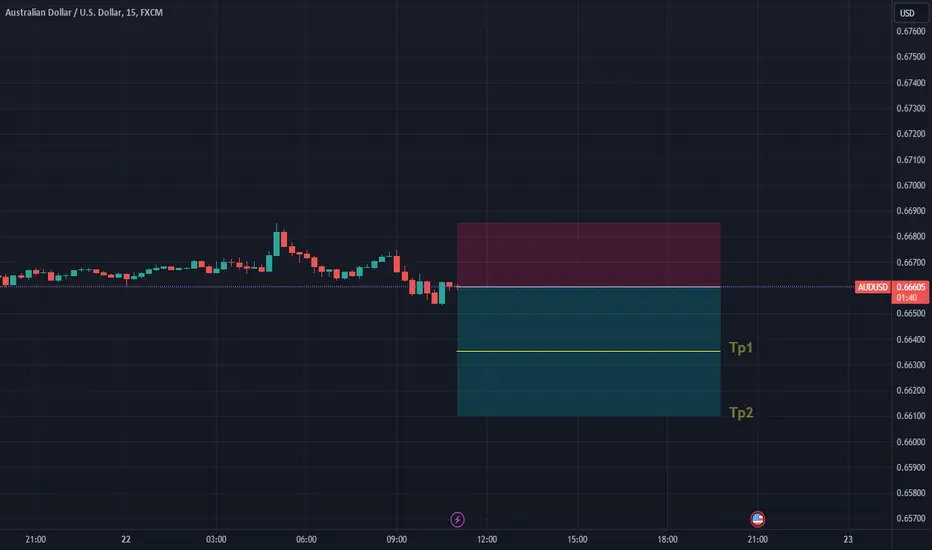
AUDUSD BEARISH -MAY 22📢 Signal: SELL AUDUSD 📉
Entry Point: 0.66603 🔍
TP1: 0.66353 🎯 (25 pip TP)
TP2: 0.66603 🎯 (50 pip TP)
SL: 0.66853 ⛔️ (25 pip SL)
Ensure proper risk management when following signals! 💡
@Mr_Bombastic_Signal
GBPUSD falls back into prior trading range as USD maintains bidPOUND STERLING ANALYSIS
- Sterling in focus ahead of lower anticipated UK inflation – BoE up Next
- OANDA:GBPUSD falls back into prior trading range as USD maintains bid
STERLING IN FOCUS AHEAD OF LOWER ANTICIPATED UK INFLATION – BOE UP NEXT
UK inflation, expected to drop before the Bank of England's monetary policy update, is crucial for achieving the target of 2% inflation. Services inflation remains high with limited progress. The Monetary Policy Committee is unlikely to change their stance even if inflation exceeds estimates. Market expectations favor a rate cut in August, while current rates at 5.25% have strengthened the pound.
The committee's vote split will be closely monitored if the hawks decide to join those calling for a hold on interest rates. The Fed will provide an update on its monetary policy and new economic projections. The dot plot, showing where officials see interest rates at the end of 2024, will be crucial for the market. Both Powell and Bailey are expected to maintain a consistent message.
The image below provides the year-to-date performance of various currencies against the dollar:
OANDA:GBPUSD FALLS BACK INTO PRIOR TRADING RANGE AS USD MAINTAINS BID
In March, GBP/USD broke out of its trading channel and reached a new high. However, the recent rise in US inflation has strengthened the dollar against several G7 currencies. The GBP/USD pair is now testing the previous high as support. Price action may be volatile due to upcoming central bank meetings, with the Bank of Japan being the only likely mover.
The 50-day simple moving average (SMA) is the next dynamic level of support followed by the bottom of the trading range at 1.2585. Topside resistance appears at 1.2800 followed by the high 1.2893

Gbpusd buysIm anticipating orice to continue to push bullish back to the key level marked, following the CPI data release which was positive for GBP

GBPUSD 1H Long Trade - 1:3 RRRSL: 1.26505
TP: 1.28380
In this trading strategy, I present a compelling opportunity for a long position on the GBPUSD currency pair, focusing on the 1-hour timeframe. By incorporating key technical indicators such as the Exponential Moving Average (EMA) 200, Moving Average Convergence Divergence (MACD) for trend analysis, and Supertrend for entry signals, traders can aim to achieve a favorable risk-to-reward ratio of 1:3.
Indicators:
EMA200: The EMA200 serves as a critical indicator of the long-term trend direction.
MACD Trend: The MACD indicator helps traders assess the strength and direction of the trend.
Supertrend: The Supertrend indicator acts as a reliable tool for identifying entry points in alignment with the prevailing trend.
