✅EUR_GBP LONG FROM SUPPORT🚀
✅EUR_GBP went down to retest a horizontal support of 0.8530
Which makes me locally bullish biased
And I think that a move up
From the level is to be expected
Towards the target above at 0.8547
LONG🚀
✅Like and subscribe to never miss a new idea!✅
Forex market

EURUSD trade ideaHello again with EURUSD!
EURUSD 15m time frame chart which I anticipate well break the low after supply mitigation.
we can target swing low for our short trade.
Good luck!

EURUSD - waiting for confirmation-------------EURUSD SHORT-------------
Do not jump in yet! Wait for confirmation of the reversal a.k.a. lower lows. I do think there is a high probability this will do down but we cannot be certain as of now. Be careful and trade only the clear setups. No guessing!
Regards,
Sz

✅AUD_USD WILL GO UP|LONG🚀
✅AUD_USD is trading in an uptrend
With the pair set to retest
The rising support line
From where I think the growth will continue
LONG🚀
✅Like and subscribe to never miss a new idea!✅

EUR USDLooking at the current market structure we, have not broken the 4 hour swing high and we far from the swing low. I expect for the EURUSD to continue on a HTF uptrend it will need to first draw on liquidity below my demand, and then rally up. However due to fomc tomorrow we could see that demand zone get mashed through and it could try to break my send 4 hour demand zone which is also at my swing low. If it does break the swing low could expect a change of direction for EURUSD
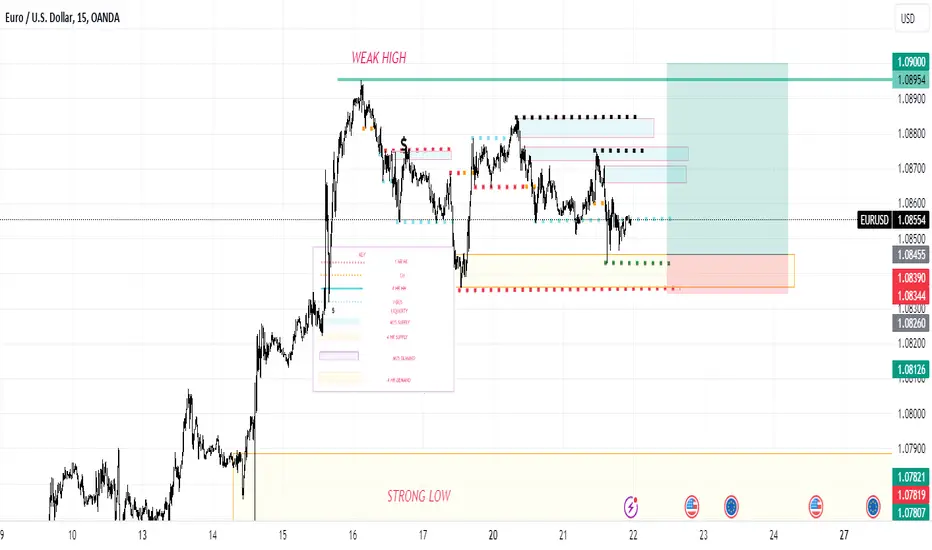
CHART BREAKDOWN EURUSD: Key Levels, Targets and Thoughts!🎯Brief Description🖊️:
The chart provides insights into critical market levels, emphasizing an essential demand zone (low-risk buy zone) spanning from 1.07900 to 1.07835. Additionally, medium-risk buy zone between 1.08300-1.08230 respectively, are highlighted.
Things I Have Seen👀:
Important Demand Zone🟢: Identified between 1.07900 and 1.07835, serving as a low-risk buy.
Medium-Risk Buy Zone🟠: Positioned between 1.08300 and 1.08230, suggesting another area with moderate risk for potential buying positions.
Bullish Targets📈:
1.08130: Possible retracement area.
1.08230: Possible retracement area.
1.08400: Possible retracement area.
1.08950: Liquidity area.
What's Important Now❗
Currently, the crucial approach is to wait and observe the price action at this level. We need to assess how the market reacts before considering any decisive moves. Stay observant and responsive to real-time developments in the market.

CHART BREAKDOWN GBPUSD: Key Levels, Targets and Thoughts!🎯Brief Description🖊️:
The chart provides insights into critical market levels, emphasizing an essential demand zone (low-risk buy zone) spanning from 1.25450 to 1.25350. Additionally, medium-risk buy zone between 1.26000-1.25900, respectively, are highlighted.
Things I Have Seen👀:
Important Demand Zone🟢: Identified between 1.25450 and 1.25350, serving as a low-risk buy.
Medium-Risk Buy Zone🟠: Noted between 1.26000 and 1.25900, suggesting another area with moderate risk for potential buying positions.
Bullish Targets📈:
1.25500: Possible retracement area.
1.25900: Possible retracement area.
1.26200: Possible retracement area.
1.26750: Significant supply zone.
1.27000: Liquidity area.
What's Important Now❗
Currently, the crucial approach is to wait and observe the price action at this level. We need to assess how the market reacts before considering any decisive moves. Stay observant and responsive to real-time developments in the market.

EURHUF to the upside vol.2-------------EURHUF LONG-------------
I added two more long positions. I still think this course will take off from these levels.

An ideal position may develop for GBPUSDIf the price can rise up to 1.27484 to 1.27686, based on the following analysis, it can have a good return:
1- Elliott wave analysis which includes 5 complete waves.
2- Fibonacci retracement point analysis.
3- The stock is in the overbought area.
4- Trend line in daily time.
This is my analysis that you can see in the chart. Good luck.

✅GBP_NZD BEARISH SETUP|SHORT🔥
✅GBP_NZD is going up now
But a strong resistance level is ahead at 2.090
Thus I am expecting a pullback
And a move down towards the target at 2.080
SHORT🔥
✅Like and subscribe to never miss a new idea!✅

Is a rate cut imminent? Watching incoming UK Inflation data Is a rate cut imminent? Watching incoming UK Inflation data
"The next move will be a cut," Bank of England's Andrew Bailey stated in response to a question about the Governors thoughts on interest rates during a speech at the London School of Economics. This does not mean the next decision will immediately be a cut; rather, rates will remain stable until a cut is implemented, effectively ruling out any rate hikes for now. This is an important distinction. The timing for cutting interest rates remains uncertain though. In the last decision, only two of the Committee's nine members voted for a rate cut.
Helping decide when the cut will come will be the revelation of the UK latest inflation data, due very soon. UK inflation could be approaching a huge milestone, with some predicting that a sharp drop in the April figures will bring the headline rate below the Bank of England’s 2% target. This would be a significant decrease from the current rate of 3.2% and could determine whether a June interest rate cut is warranted, according to economists.
On the GBP/USD chart, the previously dominant peak of April has been surpassed by pound bulls. The next challenge is to surpass late March’s surge to 1.2800. If achieved, the next resistance level could be the year-to-date high of 1.2893. However, recent consolidation may indicate a decline in bullish momentum.
For the exact date and time, import the BlackBull Markets Economic Calendar to your email inbox.

GBPCHF Trading IdeaBased on Simple Technical Analysis ( Trendline + Support & Resistance )
Risk Disclaimer:
Please be advised that I am not telling anyone how to spend or invest their money. Take all of my analysis as my own opinion, as entertainment, and at your own risk. I assume no responsibility or liability for any errors or omissions in the content of this page, and they are for educational purposes only. Any action you take on the information in these analysis is strictly at your own risk. There is a very high degree of risk involved in trading. Past results are not indicative of future returns. Good luck :-)

GBPJPY - LONG Trade Call -1h - AB=CD Harmonic PatternOn 1h , AB=CD pattern has been drawn. Since there is no RSI divergence as well, therefore, Bullish Trend is likely to continue till reaching Potential Reversal Zone. Be watchful there for any reversal.
My trade values are depicted on chart. Keeping Risk/Reward ratio to 1 and 2 respectively for two trades.

SHORT NZDJPY
*NZDJPY 2% of your account oo , it is against the trend*
Stop loss: 95.677
SELL: 95.162
TAKE PROFIT: 94.053

NZD-USD Long From Support! Buy!
Hello,Traders!
NZD-USD is approaching
A horizontal support of 0.6078
And as the pair is in the local
Uptrend we will be expecting
A bullish move up
Buy!
Like, comment and subscribe to help us grow!
Check out other forecasts below too!

Alikze »» AUDUSD | PullBack to the previous roofIn time 4H, it is moving in an ascending channel. According to the previous analysis, he made corrections up to the target range of the bottom of the channel.
💎 But now, after the failure of the resupply zone, it has been directed to the floor of the channel, which, if supported in the green box area (the previous ceiling), can continue to move up to the midline of the channel.
💎 Alternative scenario: If the range of the green box is broken, it can continue the modification until the next roof area (the second green box).
»»»«««»»»«««»»»«««
Please support this idea with a LIKE and COMMENT if you find it useful and Click "Follow" on our profile if you'd like these trade ideas delivered straight to your email in the future.
Thanks for your continued support.
Sincerely.❤️
»»»«««»»»«««»»»«««


📈 EUR/CAD Breakout Play on the 4-Hour ChartHey traders, let’s dive into EUR/CAD as we see some intriguing action on the 4-hour timeframe. We’re eyeing a potential breakout, so here’s the scoop:
✅ Breakout Potential: The pair is tightening up, forming what seems to be an ascending triangle pattern, pushing against the yellow resistance line at 1.48185. A decisive breakout above this resistance could set up a nice move. Watch for a solid 4-hour candle close above this level to confirm bullish intent.
🔍 Entry Point: If we get our breakout, the entry would be just above the 1.48185 mark, post-confirmation.
🛑 Stop-Loss: To keep things tight, consider placing a stop-loss just below the most recent swing low at around 1.47717 to minimize risk.
🎯 Take Profit: Initial profit targets might look towards the next significant resistance level marked at 1.48590. If the momentum holds, the upper yellow line could be the next stop.
📉 Market Sentiment: Keep an eye on overall market sentiment and any news affecting the Euro or Canadian Dollar, as these could influence price action significantly.

EURCAD: One More Bullish Confirmation 🇪🇺🇨🇦
I have already shared a very bullish forecast for EURCAD,
after a breakout of a key daily resistance.
Today we see one more intraday bullish confirmation
- a bullish breakout of the resistance line of a symmetrical triangle on a 4H time frame.
I believe that the market will reach at least 1.485 level soon.
❤️Please, support my work with like, thank you!❤️

EURUSD: The time to sell is now.EURUSD is bullish on its 1D technical outlook (RSI = 61.508, MACD = 0.003, ADX = 33.468) but is on the 4th day of descend, which is a natural reaction as it almost hit the top of the 5-month Channel Down. In the meantime the 1D RSI almost hit the top of its own 5-month Rectangle. We are still on the ideal level to short. Our Target is intact just over the 1.236 Fibonacci extension (TP = 1.05550).
## If you like our free content follow our profile to get more daily ideas. ##
## Comments and likes are greatly appreciated. ##

AUDUSD: Pullback From Support 🇦🇺🇺🇸
AUDUSD looks bullish to me after a test of a key intraday structure support.
I see 2 strong bullish confirmations:
- double bottom formation and a breakout of its neckline
- falling channel and a breakout of its resistance.
I expect a bullish movement now at least to 0.669
❤️Please, support my work with like, thank you!❤️

Long GBP/JPY, internal signalBased on their technical analysis, the trader has set the target price for the buy position at 197.00. This target level serves as a strategic target, indicating a substantial upward move from the identified buying area. As the price approaches this target, buyers expect buying interest to increase, which could push the GBP/JPY price closer to the desired level.
The established buy area of 194.70 is a key reference point for traders, guiding them to make entry and exit decisions based on market dynamics and price action. By closely monitoring price movements within the zone, traders aim to optimize the risk-reward ratio and improve the effectiveness of their trading strategies.
