S&P500 ON IT'S WAY TO TEST ALL TIME HIGH!Hey Traders so we are back in action checking out the Stock Indexes again.
From now on my main focus will only be the indexes I feel they are the best markets to trade for trend followers like me. Although I may occasionally make a post about other markets the indexes are my main area of study so with that being said lets dive in!
So Govt Shutdown? Seasonally Strength? Inflation Fears? Interest Rates Cuts/Hikes?
I say if you read all the headlines you will find your self in a whirlwind of ideas of how you could trade this market. But imo forget the headlines and go to what we can trust in my opinion is the charts!
For me I believe trade what I see not what we think, not what we hear, only focus on what we see the charts always have been and always will be at least for me the best guide on how to sail these uncharted waters so what do we actually see?
Well I se a strong uprtrend in place since April and I also see the market has rejected the 6690 level 3 times that tells me without any indicators needed what so ever that the market does not want to move lower than that level for now.
Support and Resistance is all you need imo to see whats happening every trading day tells a story follow the story and you will hopefully get on the right side of the market.
So therefore scenarios for today are...
Bullish- this is market is a buy imo on a pullback to the trendline around 6813. Try to put a stop somewhere out of harms way but give the market breathing room around 6760 ish looks safe. Also November seasonally is a strong month normally for stocks. If the Shutdown ends the market could celebrate and the move could be epic!
Bearish- stay in hibernation for the winter. 😁
No seriously the odds and the probabilites are really against the bears here. I would wait for January where normally market Seasonally weakens till march. Watch for maybe a top or break below support and a break below the trendline on a daily close to be sure. Then consider selling a rally.
Commitment of Traders- no report at this time due to govnt shutdown.
Good Luck & Always use Risk Management!
(Just in we are wrong in our analysis most experts recommend never to risk more than 2% of your account equity on any given trade.)
Hope This Helps Your Trading 😃
Clifford
RISK DISCLOSURE
TRADING IN THE FUTURES AND FOREX MARKET INVOLVES SIGNIFICANT RISK. ALWAYS CONSULT A FINANCIAL ADVISOR AS HIGH RISK ASSET CLASSES MAY NOT BE SUITABLE FOR ALL INVESTORS. THIS IS NOT A RECOMMENDATION TO BUY OR SELL ANY ASSETS. ALL IDEAS ARE MADE FOR EDUCATIONAL PURPOSES. PAST PERFORMANCE DOES NOT GUARANTEE FUTURE RESULTS.
CFTC RULE 4.41 – HYPOTHETICAL OR SIMULATED PERFORMANCE RESULTS HAVE CERTAIN LIMITATIONS. UNLIKE AN ACTUAL PERFORMANCE RECORD, SIMULATED RESULTS DO NOT REPRESENT ACTUAL TRADING.
Futures market

Gold on excellent recoveryTechnical analysis: The Hourly 1 chart's Ascending Channel increases it’s gains towards Overbought levels as #4,152.80 psychological benchmark (so far) is showcasing durability. Both Weekly chart (#1W) and Monthly (#1M) are on encouraging gains (# +4.13% and # +2.48% respectively) and with ranging candles I can't see any rebound possibility before #4,200.80 benchmark test. Yesterday the #4,100.80 benchmark was tested twice and as I mentioned on my remarks balanced MA periods to settle within the #4,122.80 - #4,132.80 range. More and more Buying signs are appearing as I am confident in my Bullish model. Trade accordingly.
My position: As I spotted #4,100.80 benchmark test, I started Buying Gold on each dip towards #4,116.80 first Resistance. On another #4,106.80 Support sweep, I engaged strong Buying orders towards #4,127.80 extension last night. I will continue Buying every dip on Gold from my key entry points. That is my practical suggestion.

XAG/USD Set for Decline After Finishing Wave YSilver has completed a clear 5-wave upward move, ending near the 51.23 zone, which likely marks the completion of Wave C of the corrective structure. Price action shows rejection from the upper trendline, signaling that buying momentum is fading. This suggests the start of a new A–B–C corrective decline, where Silver could first drop toward 48–47 levels before any temporary bounce. The overall structure remains bearish in the short term unless the price breaks above the 52.76 invalidation zone. In simple terms: rally looks complete → downside correction likely ahead.
Stay tuned!
@Money_Dictators
Thank you :)

GOLD Best Places To Buy And Sell Cleared , 500 Pips Waiting !Here is m y opinion on GOLD On 15 Mins T.F , We have a Huge movement To Upside since Last 2 weeks , and we have a range now for 2 days started between 4100.00 to 4148.00 so we can buy and sell Gold This Week from 2 areas , 4100.00 will be the best place for Buy and 4148.00 will be the best place for Sell , now the price very near buy area so we can wait the price to retest the support area and then enter a buy trade and targeting 4148.00 and when the price touch it and give us a good bearish P.A , we can enter a sell trade and targeting 4100.00 , It`s All Depend On Price action . I`m Sure that the main direction now is buy so i`m interesting to buy gold from 4100.00 but the best place for me will be 4060.00 cuz the price didn`t retest it until now . if we have a daily closure below our support then this idea will not be valid anymore .
Entry Reasons :
1- Highest Level The Price Touch It
2- Broken Res
3- New Support Created .
4- Clear Price Action .
5- Clear Support & Res .
6- Price Range Cleared .

Gold at a Turning Point — The Final Breath of Wave (ii)?Following our previous Gold analyses, where we perfectly anticipated the major drop, it now appears that the corrective wave (ii) is nearing completion.
Although a small push higher could still occur, the current price zone is extremely risky for long positions, and it’s time to start looking for sell setups instead. 📉
Based on the Elliott Wave structure and Fibonacci projections, once this correction ends, the market is likely to enter wave (iii) to the downside — typically the strongest and most aggressive part of the entire sequence.
At this stage, patience and disciplined risk management are key, as the main bearish trend may soon reclaim full control of the market. ⚔️
-----------------------------------------------------------------------------------------------
🚀 Who am I?
I'm Mahdi, a prop firm trader with 7+ years of experience in technical analysis, mainly focusing on Smart Money Concepts and Elliott Wave theory.
I specialize in delivering high-quality trading signals, market insights, and educational content tailored for serious traders and investors.
📊 My Tools: SMC, Elliott Wave, Fibonacci, Liquidity Grabs, Order Blocks
💼 Prop Challenge Passed: Yes | Funded Account: In Progress
🔗 Follow for consistent updates and trading insights.

From Gold to Silver — The Next Big Move on XAGUSD Following our previous series of Gold analyses, where that massive drop unfolded exactly as projected,
this time we’re turning our focus to Silver (XAGUSD) ⚡️
After completing a clear five-wave decline, Silver has been forming a corrective rally as wave (ii) —and it now seems to be in the final subwaves of this correction.
The market looks ready to kick off wave (iii) to the downside, which is often the most powerful and impulsive leg in the entire sequence! 🔥
📍The current zone is where we expect the correction to end and the main bearish trend to take control once again.
As always, patience and precision matter most here — the next move could define the market’s direction for the coming weeks.
--------------------------------------------------------------------------------------------
🚀 Who am I?
I'm Mahdi, a prop firm trader with 7+ years of experience in technical analysis, mainly focusing on Smart Money Concepts and Elliott Wave theory.
I specialize in delivering high-quality trading signals, market insights, and educational content tailored for serious traders and investors.
📊 My Tools: SMC, Elliott Wave, Fibonacci, Liquidity Grabs, Order Blocks
💼 Prop Challenge Passed: Yes | Funded Account: In Progress
🔗 Follow for consistent updates and trading insights.

How to Trade Crude Oil with Smart Money Concepts SMC Explained
Smart Money Concepts is one of the most reliable techniques for trading WTI Crude Oil.
In this article, I will teach you a profitable SMC strategy for analysing and trading USOIL futures and CFD.
This simple strategy is based on an important event every SMC trader should know - a break of structure BoS.
In a bullish trend, the best break of structure will be based on a violation and a candle close above a current higher high.
It will signify a highly probable bullish continuation and provides a great opportunity to buy
Though you can spot a bullish break of structure on any time frame, the most reliable one is a daily.
After a formation of a new high, I suggest waiting for a short term intraday correctional movement.
With a high probability, the market will retest a recently broken structure and smart money will manipulate the market, pushing the price below that, making buyers close their positions.
Once the market starts retracing, analyze an hourly time frame. The price will need to establish an i ntraday minor bearish trend.
In this bearish trend, 2 trend lines should connect lower highs and lower lows composing an expanding, parallel or contracting channel - a bullish flag pattern.
Your best signal will be a breakout of a resistance line of the flag and a violation of the level of the last lower high - a bullish change of character of a liquidity grab.
It will confirm a completion of a correction.
Buy the market on a retest of the level of the last higher low, it will be your best entry.
Set your stop loss at least below a trend line and aim at the next strong daily resistance.
That will be a perfect model for trading break of structure on WTI Crude Oil.
We spotted such a setup in my trading academy on one of the live streams with my students.
WTI Crude Oil was trading in an uptrend on a daily time frame.
A bullish violation of the last Higher High and a candle close above that confirmed a Break of Structure BoS.
The price started a correctional movement then, and we spotted a bullish flag pattern on an hourly time frame.
The market completed a correction after grabbing a liquidity below a broken structure.
A bullish movement started then, and the price violated a resistance line of the flag and the level of the last lower high.
These 2 breakouts confirmed a completion of a correction and a resumption of a bullish trend.
We opened a buy position immediately on a retest of a broken level of the last lower high.
Stop loss was below a trend line, take profit was based on the closest key daily resistance.
And the price went straight to the target.
Break of Structure BoS will be useful for analysis, forecasting and trading WTI Crude Oil.
Combining that with top-down analysis and lower time frames confirmations will provide accurate signals and profitable trading setups.
Integrate a price model that I shared in your strategy, and good luck to you trading USOIL!
❤️Please, support my work with like, thank you!❤️
I am part of Trade Nation's Influencer program and receive a monthly fee for using their TradingView charts in my analysis.
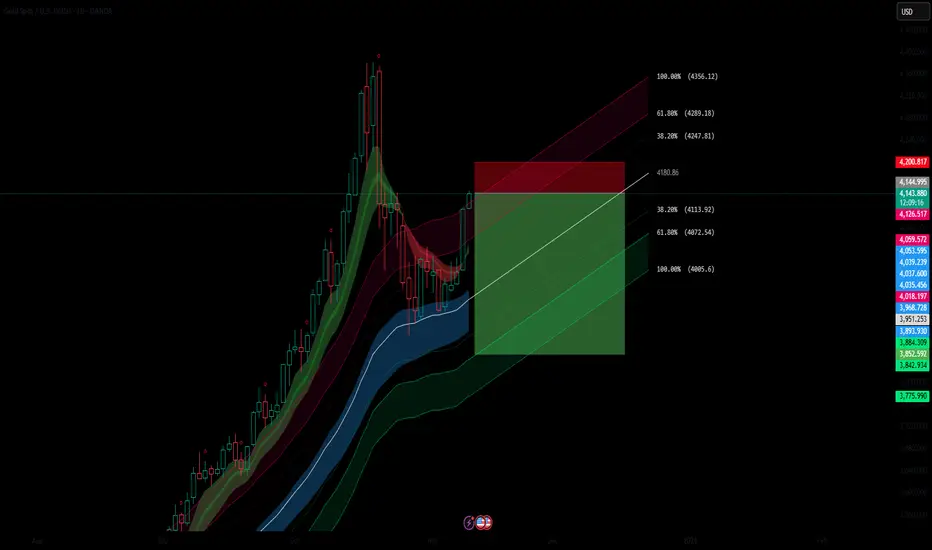
Golden Trap: Massive XAU/USD Sell OpportunityGold (XAU/USD) recently hit resistance near 4180–4200, a zone aligned with previous structural highs and a key Fib retracement zone (38.2%) from the recent swing top. The price has lost bullish momentum after a sharp rally, showing rejection wicks and fading volume. The multi-color ribbon EMA suggests early signs of a bearish crossover — indicating potential for a deeper correction.
Bearish Confluences:
Rejection at Fib Cluster (4180–4200) — aligns with both the local swing high and the 38.2% retracement level.
EMA Ribbon Curling Down — shorter EMAs are turning bearish, suggesting momentum exhaustion.
Bearish Market Structure Shift — lower highs forming after a parabolic rise, often preceding deeper retracements.
Overextended RSI / Momentum Divergence — previous highs not supported by equal strength on indicators.
Psychological Round Number Pressure (4200 zone) — historically a strong reaction level for gold.
🎯 Fibonacci Downside Targets (retracement from swing low to swing high):
Target 1 (38.2%) → $4,114 — Minor support, potential short-term bounce zone.
Target 2 (61.8%) → $4,072 — Golden ratio target and major structural support.
Target 3 (100%) → $4,005 — Full retracement zone and confluence with previous breakout
GOLD SELL WITH LIMIT ORDER!!!!!!Gold completed +350pips from my last analysis predictions on sell we have a strong sell zone 4,142 after my inducement liquidity zone am setting a sell limit from that zone selling till price arrives my target at 4,074....

Opportunities are plentiful; what's lacking is patience.Gold Technical Analysis: On Wednesday, a large bullish candlestick broke through the 4150 resistance level during the US session, ending the recent sideways consolidation. The price reached a high of around 4210. As we repeatedly emphasized on Wednesday, after consolidation, further upward movement was expected, opening a new upward channel. The market has largely lived up to expectations. The key focus now is on the sustainability of this upward move. Structurally, with this strong rally, all timeframes are in a bullish alignment. The immediate resistance levels to watch are around the 4-hour upper Bollinger Band at 4215, and the 0.786 Fibonacci retracement level, around 4275. These two levels are expected to provide some temporary resistance for the bulls. As the price has risen, the support level has gradually moved higher. The primary support level to watch in the short term is 4150. This level is a previous resistance zone that has repeatedly faced downward pressure and is currently a top-to-bottom reversal point. As long as the gold price holds above this level, the bullish trend will continue. The important support level is around 4100. As long as the price stays above this level, the upward trend will not change. Therefore, for the end of the week, we will continue to be bullish with 4150 and 4100 as support levels.
Gold prices have broken through the previous resistance zone around 4150 on the 4-hour chart. Both bulls and bears have made substantial profits over the past few trading days. If the price can hold above 4150, it is highly likely to reach 4250-4270 tomorrow. At the end of the trading day, pay attention to whether there will be a pullback followed by a second upward move. Also, watch for support around 4160-4150 in the final minutes of the trading day. The upward momentum after the recent breakout should continue, although the deviation in the smaller timeframes is slightly large. We should watch for any short-term corrections. On the hourly chart, watch the low of 4097 from Tuesday's pullback. The US session saw a rapid rise above 4150, indicating a low probability of a significant drop; at most, it will only be a pullback. Short-term focus should be on buying on dips, using the 4150 level (a previous support/resistance level) as support, and also looking for opportunities to buy at the 0.5 Fibonacci retracement level. In summary, today's gold trading strategy should prioritize buying on dips, with selling on rallies as a secondary approach. Key resistance levels to watch are 4250-4275, and key support levels are 4150-4170. Please stay on track.

Gold Regains Its Shine as Buyers Take Control of the Market!Hello traders,
After days of consolidation, gold surged sharply during the Asian session , reclaiming the key psychological level of $4,000/oz. The weakness of the U.S. dollar, combined with expectations that the Federal Reserve may cut interest rates in December , has reignited investor optimism. Meanwhile, efforts by the U.S. Congress to end the government shutdown have further strengthened gold’s position as a safe-haven asset.
On the chart, gold is showing a strong rebound from the $4,000 support zone , where buyers previously stepped in with significant volume. The potential scenario suggests that price may pull back slightly toward $4,000 before continuing its climb toward the $4,200 resistance area, which aligns with the previous swing high and a key supply zone.
If price breaks above $4,200, the bullish momentum could extend further , targeting the $4,300 area in the medium term. Market sentiment remains firmly in favor of the bulls, and gold appears ready for a fresh breakout this week .
Wishing you all successful trades!

XAUUSD_5M_BuyShort-term gold analysis The market can enter an upward correction by completing five down waves The most important number for the up wave is $4,100 and only by maintaining this number can the market become bullish.

XAUUSD Trade Setup: Gold at Resistance, Here's my Trade PlanXAUUSD Gold has seen a strong rally recently, pushing into a key resistance zone 🧱. With capital currently rotating out of safe-haven assets like gold and flowing into the stock markets, we could see a potential pullback from this level. 📉
At the moment, I’m avoiding buying at a premium price. Instead, I’ll be watching for a retracement back into equilibrium — around the 50% level of the recent swing range ⚖️.
If price pulls back, then breaks market structure to the upside, that could confirm renewed bullish momentum, and I’ll be looking for a long entry setup from that point. 🚀
⚠️ This analysis is for educational purposes only and not financial advice.

USOIL: Q4/2025 Q1 2026 Action PlansSentiment:
- The broader market is cautious in a risk-off environment, which typically translates to concerns about demand and the strength of the US dollar. However, the market is not in a state of panic as the Fear Index is at around 30, opening room for either direction.
- Social Media (X/Twitter): The current tone is positive, as participants expect USOil to rise within the range of 57.50-65.00 in the near term, anticipating an upcoming upward breakout.
- The COT report shows extremely bearish sentiment regarding the latest data from 26/9 (following the US government shutdown), so we can only have a snapshot of more than a month ago. Although the current sentiment may or may not be as extreme (we need to wait for the latest data), it still reflects the state of market positioning.
- I think that Retail is unaware of positioning extremes and is more focused on technical breakout. It may lead to a sentiment shift as a result of a technical breakout and changes in the fundamental narrative.
Fundamental:
A. OPEC+ Production Shift:
- Narrative: OPEC+ has pivoted to MORE cautious supply management. After nine consecutive monthly increases, the group is now implementing only a modest 137k bpd increase for Dec 2025, followed by a production pause for the entire first quarter of 2026.
- Rationale: Healthy market fundamentals, low inventory levels, seasonal demand
- It means more supportive than what we observed earlier in 2025. Q1 2026 pause suggests OPEC+ acknowledges oversupply risks and is being disciplined. One more thing to note is that the current price is also not entirely factored into this narrative.
B. Geopolitical Risk Premium Returning:
- Narrative: Recent US/EU sanctions on Russian energy companies and escalating tension in oil-producing regions are providing price support.
- Market impact: This narrative provides a fundamental floor for price at least till the end of this year.
C. Bearish Fundamentals - Oversupply into 2026:
- Narrative: Despite the OPEC+ pause, global oil inventories are expected to rise through 2026 on weak demand growth and non-OPEC supply increases (such as the US production)
- Factors: global inventories forecast to rise through 2026, weak demand from China, tariff uncertainties and US production at record levels.
- Market impact: Bearish medium-term outlook for Q1-Q2 2026.
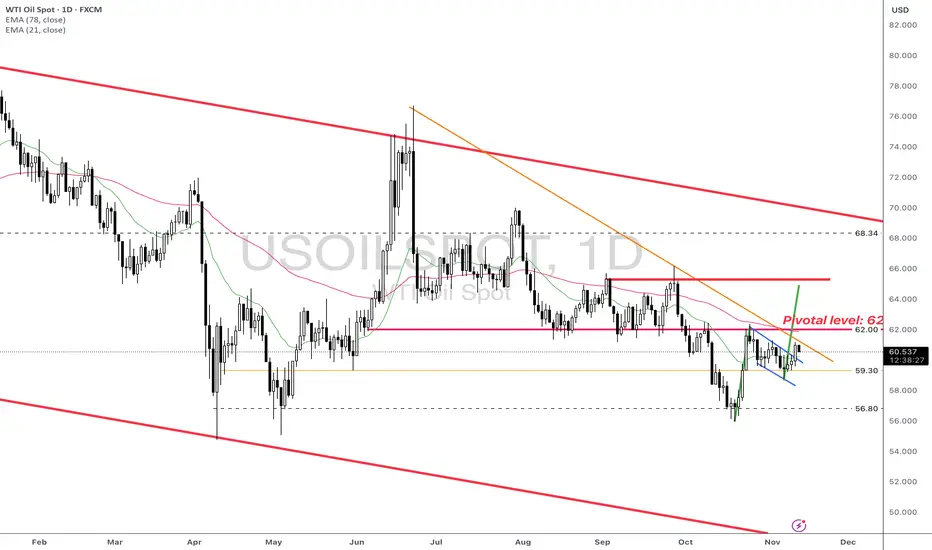
Technical:
- USOIL broke the small blue channel and is expected to reach the measured level at around 65, confluence with the Sep resistances.
- If USOIL can hold above 60 (retest the broken channel), it may resume its momentum to retest the key resistance at 62 first, then 65, as measured by the move upon breaking.
- Conversely, closing below the support at 59.30 may invalidate the short-term upward view and open the door for further decline, potentially retesting the swing low at 56.80.
Conclusion:
- Despite a short-term upward momentum until year-end, the prospect for USOIL in 2026 is not as promising.
- Therefore, a range of 65-70 is possible for the short term upward plan; however, any surge bejond that may open another opportunity for counter-trade setups in Q1-Q2 2026.
Analysis by: Dat Tong, Senior Financial Markets Strategist at Exness
Gold. About the time for 5400 pips. 12/Nov/25Xauusd is timing boom for 5400 not just 5300 pips drop as previous ideas..

Gold on excellent recoveryTechnical analysis: The Hourly 1 chart's Ascending Channel increases it’s gains towards Overbought levels as #4,152.80 psychological benchmark (so far) is showcasing durability. Both Weekly chart (#1W) and Monthly (#1M) are on encouraging gains (# +4.13% and # +2.48% respectively) and with ranging candles I can't see any rebound possibility before #4,200.80 benchmark test. Yesterday the #4,100.80 benchmark was tested twice and as I mentioned on my remarks balanced MA periods to settle within the #4,122.80 - #4,132.80 range. More and more Buying signs are appearing as I am confident in my Bullish model. Trade accordingly.
My position: As I spotted #4,100.80 benchmark test, I started Buying Gold on each dip towards #4,116.80 first Resistance. On another #4,106.80 Support sweep, I engaged strong Buying orders towards #4,127.80 extension last night. I will continue Buying every dip on Gold from my key entry points. That is my practical suggestion.

Monitoring AI Valuation - Precision on Upcoming CorrectionThese are the three largest market-cap listed companies on the Nasdaq.
If we are concerned about an AI bubble, I’m going to show you how I perform a quick glance at some top companies and their index to determine the likelihood of an upcoming short-, mid-, or long-term correction.
In 2017, Microsoft’s P/E reached its highest at 45 — and it continued to rise after that.
In 2023, Nvidia’s P/E reached its highest at 147 — and it continued to rise after that.
In 2024, Apple’s P/E reached its highest at 40 — and it continued to rise after that.
Micro E-mini Nasdaq-100 Index
Ticker: MNQ
Minimum fluctuation:
0.25 index points = $0.50
Disclaimer:
• What presented here is not a recommendation, please consult your licensed broker.
• Our mission is to create lateral thinking skills for every investor and trader, knowing when to take a calculated risk with market uncertainty and a bolder risk when opportunity arises.
CME Real-time Market Data help identify trading set-ups in real-time and express my market views. If you have futures in your trading portfolio, you can check out on CME Group data plans available that suit your trading needs www.tradingview.com

Gold sell setup This trade based on Daily TF and and deply analyzed on 6h TF
Gold has broken a strong supply level yesterday on aisa & london sessions and kept the momentum all the way to to 21 Oct and 23 Oct swing high but NY session rejected and engulfed the previous session at the swing high with high volume . After the breakout structure has to be retested , with all those confirmation there is a high probability market will retest 4050 .

GOLD GOES " ̶T̶R̶I̶P̶L̶E̶ ̶V̶O̶D̶K̶A̶" TRIPLE TOP PATTERNGold has recently exhibited strong technical momentum, rebounding from its $3,900 support and surpassing the 50-day moving average, which marks a bullish reversal after a late-October dip.
Immediate support is at $4100 per ounce.
The Relative Strength Index (RSI) is rising, confirming buyers have regained control in the short-term and signaling the possibility for further upside.
BUY THE DIP SCENARIO
Current trading strategies suggest buying near support and targeting resistance upward, demonstrating an underlying “buy on dips” scenario as gold consolidates above $4100.
WHAT IS " ̶T̶R̶I̶P̶L̶E̶ ̶V̶O̶D̶K̶A̶" TRIPLE TOP PATTERN
The triple top pattern is a bearish reversal technical chart pattern signaling the potential end of an uptrend and the beginning of a downtrend.
It forms after an asset price hits the same resistance level three times but fails to break above it, creating three distinct peaks at roughly the same price level. Between these peaks are pullbacks or troughs, forming support levels. The pattern is confirmed only when the price breaks below the support (neckline) formed by these troughs.
The psychology behind this pattern shows weakening buying power as the price fails to surpass the resistance level on three attempts. Each peak typically has declining volume, reflecting decreased buying enthusiasm. After the third peak, sellers could gain control, and the price could falls below support with increased volume, confirming the reversal.
CONCLUSION
Traders use the triple top to anticipate the exhaustion of bullish momentum, signaling caution and opportunities to enter short positions or exit longs.
The pattern reflects supply overwhelming demand after repeated failed rallies, indicating a shift from bullish to bearish sentiment. It is considered a reliable indicator after a sustained uptrend and is used with risk management strategies to navigate market turns effectively.
TECHNICAL SUMMARY
Just simply take a look at history of Gold. It says: " ̶T̶R̶I̶P̶L̶E̶ ̶V̶O̶D̶K̶A̶" TRIPLE TOP.
--
Best wishes,
@PandorraResearch Team

SILVER (XAGUSD) | 100-Year Setup Bracing for $3,382 Surge🥈 SILVER | The Supercycle Unfolding — Eyeing $243, Then $3,382 ⚡
Silver has been following a textbook Elliott Wave Supercycle since the 1970s. Wave 1 topped in 1980 near $50, Wave 2 bottomed in 1991 with a deep 0.786 retracement , and since then, we’ve been in a massive Wave 3 that’s still playing out.
Within this ongoing Supercycle Wave 3, we’ve seen five major macro waves:
Wave 1 (1991–1998) – the first impulsive leg.
Wave 2 (1998–2001) – retraced 0.786.
Wave 3 (2001–2011) – the big run to $49.
Wave 4 (2011–2020) – a long 0.5 retracement and re-accumulation phase.
Wave 5 (2020–Now) – the current and final advance of this Supercycle wave.
Inside the current Macro Wave 5 , we’ve already seen Micro 1 top in 2021, Micro 2 bottom in 2022 (0.5 pullback) , and now Micro 3 is underway , targeting the 2.618–3.618 Fib zone ($71–$123) . After that, a Micro 4 correction should follow (around 0.382–0.5), then Micro 5 could push to roughly $243 , which aligns with the 1.618 extension of the entire Supercycle (1)-(2) .
That $243 level may mark the end of Supercycle Wave 3 , setting up for Wave 4 , a long-term correction likely into the $90–$120 rang e (0.382–0.5 retracement). From there, the final Supercycle Wave 5 could begin — a massive impulsive phase aiming for the 2.618 Fibonacci extension near $3,382 🌕
The structure, Fibonacci ratios, and long-term fundamentals all support this roadmap. Industrial demand (solar, EVs, electronics) and ongoing monetary debasement continue to build the fundamental base for a multi-decade silver bull cycle.
📈 We’re in the late stages of Supercycle Wave 3 — and the calm before silver’s next historic acceleration. ⚡
Follow this century-long Silver Supercycle closely — the final wave is unfolding and $3,382 is in sight. Bookmark this idea to track each micro and macro move, and comment your target or thoughts on the Wave 5 breakout. Let’s see who spots the historic setup first!
— Team FIBCOS
#Silver #PreciousMetals #Supercycle #ElliottWave #Fibonacci #MarketStructure #SmartMoneyConcept #LongTermBull #TradingSetup #TechnicalAnalysis #MacroTrend #Commodities

VX1! INDEXPreferably suitable for scalping and accurate as long as you watch carefully the price action with the drawn areas.
With your likes and comments, you give me enough energy to provide the best analysis on an ongoing basis.
And if you needed any analysis that was not on the page, you can ask me with a comment or a personal message.
Enjoy Trading ;)

GOLD BUY ANALYSISLong-Term Buy Opportunity (Wave (V) Impulse)
Buy Zone: $4,080 – $4,090 (completion of minor dip / retest of breakout)
Target (TP1): $4,200
Target (TP2): $4,240 – $4,250 (completion of Wave (V))
Stop Loss: $4,050
Reasoning:
The structure suggests an ongoing bullish channel.
Once Wave (IV) holds, the next upward leg should complete Wave (V), targeting the resistance zone around $4,250.
Notes:
The market structure remains bullish in the medium term.
Watch for confirmation of a bullish breakout from the triangle consolidation.
Manage risk carefully and trail stops once Wave (V) progresses toward resistance.
#Gold #XAUUSD #ElliottWave #Forex #Commodities #WaveAnalysis #TradingSetup #TechnicalAnalysis #BuyTheDip #SwingTrade

Sell Setup GoldHi All,
I hope everyone is doing fine and had good day yesterday and today as well. I am here with buy & sell setup. Whatever triggers first will see.
Note: All information is for only Educational Purposes
Check the screenshot for Sell Setup
Green Pips To All
Amen
