Oracle - This stock is heading higher!🚀Oracle ( NYSE:ORCL ) is heading higher now:
🔎Analysis summary:
Yes, over the course of the past couple of weeks, we witnessed a harsh drop of -50% on Oracle. But looking at the higher timeframe, Oracle is just creating a bullish break and retest. If we see bullish confirmation soon, Oracle will create new all time highs.
📝Levels to watch:
$200
SwingTraderPhil
SwingTrading.Simplified. | Investing.Simplified. | #LONGTERMVISION

FJET - From Private Skies to Public Markets!!Most retail investors never had access to the biggest space winners.🌌
SpaceX went from a private valuation near $46B to over $800B without ever giving the public a chance to participate.
This time, the door is open❗️
Starfighters Space, Inc. AMEX:FJET has officially entered the public markets, giving everyday investors exposure to a real aerospace company… Not a concept, not a slide deck; but one already flying missions out of NASA’s Kennedy Space Center.
📊 Technical Analysis
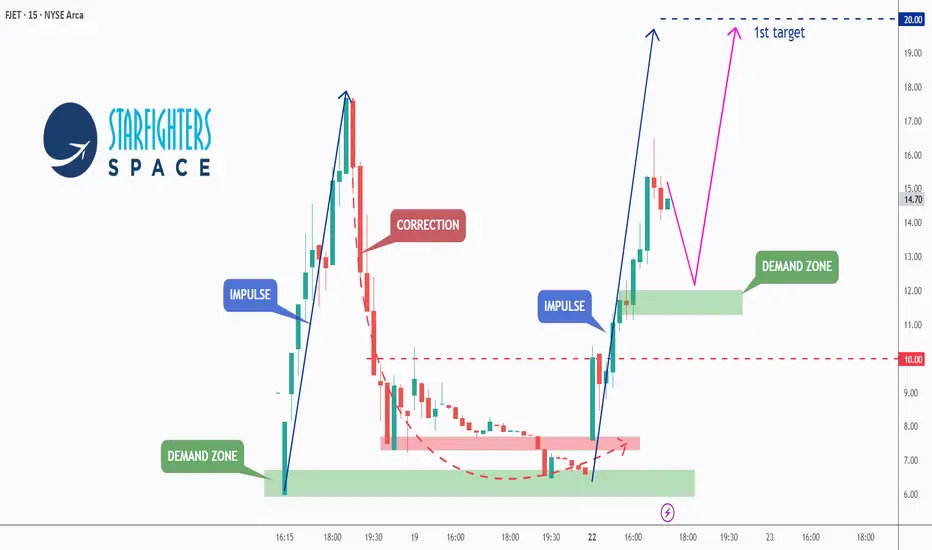
Following its public debut, FJET delivered a strong impulsive move 📈, confirming aggressive buyer interest.
After a healthy correction into demand, buyers stepped in again, keeping the structure intact.
Price has now broken and held above the $10 area , confirming bullish continuation and validating the higher-timeframe structure.
🔁 From here, the expectation is a shallow pullback / consolidation , followed by continuation in line with the scenario marked in purple.
🏹 The $20 zone represents the first target , and upon reaching it, I will be watching for further upside , at which point I’ll post an updated outlook.
💡 Bigger Picture
This isn’t a speculative space idea, it’s an operating aerospace company 💼with rare credentials:
- World’s only commercial Mach 2-capable fleet of Lockheed F-104 Starfighters.
- Operating directly out of NASA’s Kennedy Space Center.
- Strategic validation from NASA, Lockheed Martin, GE, and the U.S. Air Force.🛩
- Pioneering a hypersonic air-launch platform designed to dramatically reduce the cost and timeline of microsatellite deployment.
- Successfully completed a $40M Regulation A+ raise , transitioning from private capital into the public markets.
Recent history shows that real aerospace IPOs tend to move early:
Voyager, Firefly, Karman, and AIRO all saw sharp post-listing expansions.
In this sector, the first phase after going public often matters the most.
📘 Bottom line
FJET offers something rare:
💎Early exposure to a credible aerospace company right after it entered the public markets, before full institutional positioning and before the story became widely crowded.
📡Whether you approach it as a technical setup, a newly public aerospace play, or a longer-term space infrastructure narrative, this is a name worth keeping on the radar.
⚠️ Always do your own research and speak with your financial advisor before investing.
📚 Stick to your trading plan, entry, risk management, and execution.
All strategies are good; if managed properly.
~ Richard Nasr
Disclaimer: I have been paid $800 by CDMG, funded by Starfighters Space, to disseminate this message.
Nvidia (NVDA) Shares Rise On Potential Chip Shipments to ChinaNvidia (NVDA) Shares Rise On Potential Chip Shipments to China
According to Reuters sources, Nvidia has informed Chinese clients of plans to begin shipments of its H200 chips by mid-February 2026. This has been made possible by a recent change in US export policy, which allows the sale of advanced technologies provided a special 25% duty is paid.
NVDA shares reacted positively to the news, as the ability to legally sell high-performance chips — which are roughly six times more powerful than the previously approved, cut-down H20 versions — to major players such as Alibaba and ByteDance could significantly boost Nvidia’s revenues.
Technical Analysis of Nvidia (NVDA)
In November, we identified an ascending price channel, which remains intact.
Today, the NVDA chart shows clear signs of demand dominance:
→ the price reversed higher (as indicated by the arrow) before reaching the lower boundary of the channel, with the $170 level acting as support;
→ bullish gaps were formed at the open of the last two sessions.
Particular attention should be paid to the candle of 19 December:
→ trading volumes were exceptionally high;
→ the candle body was wide, with the session opening at the low and closing at the high.
If the decline from the all-time high is viewed as a corrective “bull flag” pattern (marked in red), it is notable that the price is now testing the upper boundary of that flag. In this context, it is reasonable to assume that if buying pressure remains strong, the price could break out of the correction and move towards the median of the long-term uptrend that has been in place throughout 2025.
This article represents the opinion of the Companies operating under the FXOpen brand only. It is not to be construed as an offer, solicitation, or recommendation with respect to products and services provided by the Companies operating under the FXOpen brand, nor is it to be considered financial advice.

RIOT: Watch out for B waveYearend rally might be afoot. For RIOT, it is at a precarious spot. If this is the start of minor wave 3, then it is most likely in process of just 1 of 3. the move from $12 to $16 is a very short one. This opens up a potential zigzag scenario for a wave B of 2. This is also a good entry with a stop loss at $12.84. If it is indeed a B wave, then we should see an impulse to about $18 - $18.5 then an impulse down. If we see price go above $20 and then stall for a bit, then things could be more bullish. For now, prepping for a worst-case scenario. If a larger C wave is indeed in the cards, then it could be a slower/choppier grind down; but should be 5 waves move down. Will switch to the bullish case if we see 5 waves move to the upside instead. Then will look for a re-entry at the retrace! Right now, staying long for the B wave.

Webull (BULL): Fibonacci Swing Setup Targeting $11.702-hour timeframe to identify potential price targets and reversal zones. Here's the structure:
- **Current Price**: $8.74
- **Volume**: 37.45K (moderate interest)
- **Fibonacci Levels**: 23.6%, 38.2%, 50%, 61.8%, 78.6% retracements used to mark support/resistance zones.
- **Extension Target**: 1.272 Fibonacci extension near **$11.50**, suggesting a bullish breakout potential.
- **Annotated Moves**: Price projections show potential gains of **11.09%**, **21.86%**, and **33.82%** depending on breakout strength.
#### 📈 Trade Setup (Bullish Bias)
| Component | Value / Rule |
|------------------|----------------------------------------|
| **Entry Zone** | $8.70–$8.74 (current consolidation) |
| **Stop-Loss** | Below $8.50 (under recent support) |
| **Target 1** | $9.75 (11.09% move) |
| **Target 2** | $10.65 (21.86% move) |
| **Target 3** | $11.70 (33.82% move, 1.272 extension) |
#### 🧭 Strategy Notes
- Ideal for **swing trading** with 2–5 day horizon.
- Watch for **volume confirmation** on breakout above $8.80.
- Risk-reward improves if entry is closer to $8.70 with tight stop.

NVDA short Trade Setup – POC Reaction and Reversal PotentialPrice has just reacted to the Point of Control (POC), showing signs of absorption and potential exhaustion. I’m anticipating a reversal targeting yesterday’s POC, which aligns with a key round number—adding confluence to the setup.

$LAZR maybeGave a good thought about this one, I´ll put something in to it :
Entry : CMP
TP : 1.10
SL : 0.176
Liquidity zone at 0.18
A few more levels downward...
Be careful!
Financial Disclaimer:
This is not financial advice. This is a technical perspective based on price action and market structure. Always manage risk, do your own research, and never trade solely based on a single chart or scenario.

Repeat of 2 years ago?HIMS may be repeating what it did over 2 years ago, which was the last time the 100 DMA crossed below the 200 DMA. Typically, this is considered bearish; however, as occurred in 2023, when accompanied by an RSI bullish divergence, the move can be a constructive signal. Price is currently oversold. Watching for a positive RSI divergence following an official 100 sub 200 cross.

NVO: Demand volume confirmed!NVO: Demand volume confirmed!
.
Backtest at LPS and go up short view, then.
.
US STOCKS- WALL STREET DREAM- LET'S THE MARKET SPEAK!

SMCI Loss of this Support can result into crash to $10.Supermicro Computer Inc. (SMCI) has been under heavy pressure since its March 2024 ATH and last month hit and held its 1M MA50 (blue trend-line). This is a key Support level, which even though it broke on the November 2024 crash, the price managed to recover and close the month back up above it. In fact, the last time SMCI closed a month below it was in March 2020 during the COVID flash-crash.
As a result, loss of this level can result into an accelerated sell-off, technically the second Bearish Leg of the long-term Channel Up, towards the 1M MA200 (orange trend-line). If it is as strong as the first Bearish Leg, then we should be expecting a -86% decline to $10.00, which would technically make contact with the 1M MA200.
Notice also how similar the current 1M RSI structure is with SMCI's last Channel Down correction in 2015 - 2018.
---
** Please LIKE 👍, FOLLOW ✅, SHARE 🙌 and COMMENT ✍ if you enjoy this idea! Also share your ideas and charts in the comments section below! This is best way to keep it relevant, support us, keep the content here free and allow the idea to reach as many people as possible. **
---
💸💸💸💸💸💸
👇 👇 👇 👇 👇 👇

Novo Nordisk will have first mover advantage with WeygoviNYSE:NVO is now breaking out on very strong news. Novo Nordisk will have first mover advantage with their oral weight loss pill, Weygovi.
Stop $48
Target $70

META: AI Dominance & Institutional Support - The Path to $960As we head into the final weeks of 2025, META remains a top conviction play within the NYSE_techfund framework. Following our strategic entry at $647.4 on Nov 28, the stock has shown resilient strength, establishing a new floor at $661.50.
Fundamental Catalysts: The primary driver remains the "AI-Flywheel" effect. Institutional data indicates that Meta’s AI infrastructure is significantly lowering ad costs while increasing conversion—a "walled garden" that is becoming impenetrable for competitors. The 24-month investment cycle is now transitioning from a cost-burden to a high-margin revenue stream.
Institutional Sentiment (Dec 2025 Updates): Current Wall Street consensus reinforces our bullish bias.
Technical Outlook: The chart confirms a bullish breakout from the November consolidation.
Immediate Support: $647.4 (Entry Zone).
Primary Target: $813.
Secondary Target: $960.
The Bottom Line: The convergence of technical momentum and fundamental maturity suggests further upside. We are staying long as the risk/reward remains skewed to the upside.

Breaking: Novo Nordisk A/S (NVO) Set For 80% BreakoutShares in Novo Nordisk surged over 7% Tuesday premarket after the Wegovy maker secured approval of its GLP-1 pill — a world first.
The U.S. Food and Drug Administration’s approval of Novo Nordisk’s GLP-1 pill gives the Danish pharmaceutical giant a head start over U.S. rival Eli Lilly
The pill’s starting dose of 1.5 milligrams will be available in pharmacies and via select telehealth providers with savings offers for $149 per month in early January, the firm said.
Cash-paying patients can access it for the same price via President Donald Trump’s direct-to-consumer website, TrumpRx, according to the deal Novo Nordisk struck with his administration last month. Drug pricing has been top of mind this year as the U.S. looks to reduce the costs paid by consumers.
The approval caps a turbulent year for Novo, which has been marked by board drama, supply chain shortages, a bidding war against Pfizer, and criticisms over the execution of its U.S. strategy.
Technically, NYSE:NVO stock is gearing for a 80% breakout as the asset is set to break above the symmetrical triangle pattern amidst the FDA approval news bid.
About NVO
Novo Nordisk A/S, together with its subsidiaries, engages in the research and development, manufacture, and distribution of pharmaceutical products in Europe, the Middle East, Africa, Mainland China, Hong Kong, Taiwan, North America, and internationally. It operates in two segments, Diabetes and Obesity Care, and Rare Disease. The Diabetes and Obesity care segment provides products for diabetes, obesity, cardiovascular, and other emerging therapy areas.

RDW - Buckle up for a rideRDW has the heaviest volume lately when it bottomed, that's a very good sign.
I've been building long position here, few at a time.
Target 1- 10 - Toughest area to beat, heaviest overhead supply. Notice the VWAPs converging here. Even if it takes time to cross this area, just wait patiently.
Target 2- 16 - Next supply zone after 10
Target 3- 24
Stop loss - 4

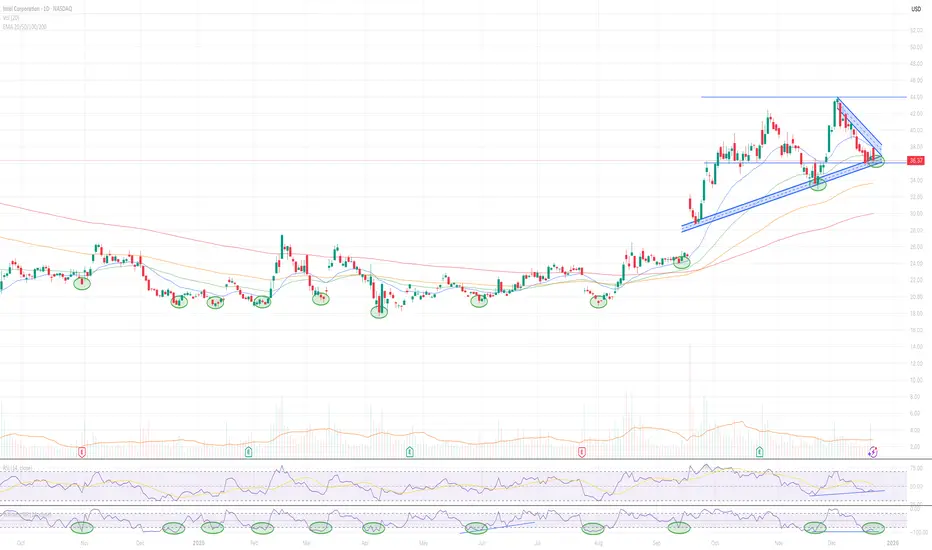
$INTC Is Extremely Oversold ... and frustrating
- Every time that Intel is oversold on Williams indicator, meaning -80 to -100 (current is -91.62 - extremely oversold), it bounces hard
- I have highlighted every instance since November 2024, where the momentum indicator was at oversold levels - and every single time came a massive bounce / rally
- It has been a frustrating downtrend, but every single indicator is showing bullish momentum
-- In fact, the 100 and 200 day moving averages are still rising, and has maintained the golden cross since late September
-RSI-based MA is going to converge with RSI levels over the next 2 weeks, as RSI rises - looking for volume buyers
The market is great at convincing you that "it's over". Until it isn't. Price moves sentiment.
Inevitable that Intel will bounce on this uptrend I have highlighted.
INCOMING BULL RUN ON ORACLE CORPORATION STOCK PRICEOracle stock is about to hit ATH as it is currently bouncing off from discount prices and supported by the monthly GAP.

NVDA Showing StrengthNASDAQ:NVDA finally showing strength. It's trying to break into the cloud today and the daily bands are finally starting to expand.

Palantir - TGT 223The Stock is showing exceptional performance and expected to hit higher levels.
Stock expected to hit the levels of 223.
It might see the levels of 180 -172 before flying higher.

Live trading on Amazon stock.Live trading on Amazon stock.
Price is at the bottom of its channel and sitting in a strong demand zone.
Follow proper risk and money management.
This is just my personal view, so please trade based on your own strategy and trading system.
Follow me on TradingView for more analyses and live stock trades.
NASDAQ:AMZN

NVDA reversed on the weekly chart. Here are my long scenarios.Last Friday closed with a strong green candle and a clear volume spike, which may confirm a structural shift to the upside.
Market today is up almost 1.5%, and price is gravitating toward the previous weekly high around the $188 area.
At this point, today’s session is unlikely to offer a clean entry with a good risk-to-reward ratio. However, if we get a pullback, I would consider a long setup.
Primary target:
Not just the $188 level, but the broader $198–200 zone, which offers roughly 9–10% upside from a pullback entry.
Extension scenario:
If price consolidates or pulls back again after that move, an additional entry could target the $212 area, adding another 7–8% upside.
Invalidation:
For this week, last Friday’s low is my invalidation level. If price breaks below it and holds there on the daily chart, the bullish structure is invalidated.

D- Best Wave Quantum No. III ^.^^D Wave III wave is coming back! 20% up in one day.
Out performed any other Shares. Thanks for the Shorts and Puts which give more fuel.
The company forms U.S. Government Business Unit Led by Jack Sears Jr
It also provides services to Amazon customers.
Webush starts covering D- Wave.
Technicals are favouring this stock.
Stock Price is reaching $32
large Green bar over comes 60 MA
5/10/20 MAs are lined up for another big run.
Large Vol shows significant investors interest.
MACD : Green bar with Golden Crossed above 0
Market still loves D Wave.
It might break previous high as it gains momentum.
Target next $30 - $45 or More.
2026 is a good year for D-Wave.

UNITED HEALTH on its 2009 Support. Can it be saved or $175 is neUnited Health (UNH) almost hit in August its 1M MA200 (orange trend-line), a Support level that is intact since March 2009 and the aftermath of the 2008 U.S. Housing Crisis.
Since the Dotcom Crash, the stock has been trading within a multi-year Channel Up and the recent correction since the November 2024 All Time High (ATH), is technically its second Bearish Leg since the 2008 Housing Crisis.
The latter eventually dipped below the 1M MA200 and bottomed a little after on the 1M MA200 (red trend-line). Based on the 1M RSI, which hit the 30.00 oversold level and rebounded, the market may be in levels similar to July - August 2008. As a result, there is a high chance of breaking again below the 1M MA200 and if that happens, expect a bottom on the 1M MA200 again at $175, which would also be a -75.80% correction from the ATH, similar to the 2008 Bear Cycle. Only a break above the 1M MA50 (blue trend-line) can restore the bullish trend, which has been intact non-stop from October 2010 to April 2025.
---
** Please LIKE 👍, FOLLOW ✅, SHARE 🙌 and COMMENT ✍ if you enjoy this idea! Also share your ideas and charts in the comments section below! This is best way to keep it relevant, support us, keep the content here free and allow the idea to reach as many people as possible. **
---
💸💸💸💸💸💸
👇 👇 👇 👇 👇 👇

TESLA: Bullish Continuation Pattern: Eyes on 482 → 550 → 600TESLA: Bullish Continuation Pattern: Eyes on 482 → 550 → 600
TSLA is forming another bullish continuation pattern after a series of higher-low triangle formations. The structure suggests strong trend continuation potential if buyers reclaim momentum.
A confirmed breakout above the current resistance zone could open the path toward 482 and beyond.
Key Levels & Targets:
• 482 Quick target if resistance breaks
• 550
• 600
• 650
You may find more details in the chart!
Thank you and Good Luck!
❤️PS: Please support with a like or comment if you find this analysis useful for your trading day❤️
