Editors' picksOPEN-SOURCE SCRIPT
VIX Cheat Sheet
Updated
Hello!
This indicator - "VIX Cheat Sheet" - performs several calculations for VIX against the asset on your chart. However, using VIX as a risk proxy or volatility metric often fails beyond large-cap U.S equities. To remedy this, the VixFix indicator is included in the script; you can select whether the script performs calculations for an asset against VIX or against VixFix (i.e. Forex, Crypto)
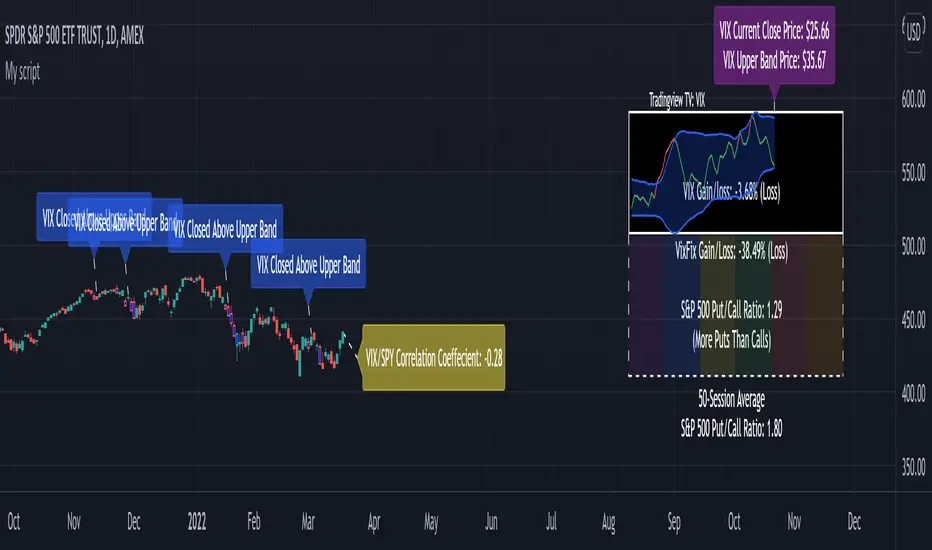
Measured are:VIX correlation to an asset's price fluctuations, the average close-to-close gain/loss subsequent a VIX/VixFix close above the upper Bollinger Band, the average 5-session gain/loss following the same occurrence in addition to the average 10-session gain/loss, all close-to-close, 5 session, and 10-session gains/losses are stored as tooltips for labels on the chart. The current close-to-close percentage gain/loss for VIX and VixFix are displayed on the chart.
Displayed in the example image is a box incorporatingVIX price data alongside an upper Bollinger Band and lower Bollinger Band. The data isn't cast to its own price scale but is helpful for quick interpretation of VIX fluctuations. You can select to plot VixFix data in the box in the user inputs table.

Displayed in the second example image is a semi-transparent blue box encompassing all price moves that occurred whenVIX measured above $40 for at least ten consecutive sessions. The largest percentage close-to-close loss is displayed below the box.
Also illustrated is a red label that appears whenVIX or VixFix closes above the upper Bollinger Band. The indicator will calculate and display the performance of the asset for the subsequent 10 sessions, to which the red label will disappear and all data stored as a tooltip in the blue labels stating "VIX Closed Above Upper Band" or "VixFix Closed Above Upper Band".
To reduce chart clutter, a label and line combination marking allVIX closes above the upper Bollinger Band was not included. Instead, bar color changes were added. When "VIX" is selected in the user inputs table the indicator will mark all sessions in which VIX closed above the upper band as blue, in addition to plotting VIX price data in the dynamic black box. When "VixFix" is selected, the indicator will mark all sessions where VixFix closed above the upper band as purple; the VixFix indicator will be plotted in the black box.
Be sure to hover over labels to access tooltip information; try the indicator with bar replay!
This indicator - "VIX Cheat Sheet" - performs several calculations for
Measured are:
Displayed in the example image is a box incorporating
Displayed in the second example image is a semi-transparent blue box encompassing all price moves that occurred when
Also illustrated is a red label that appears when
To reduce chart clutter, a label and line combination marking all
Be sure to hover over labels to access tooltip information; try the indicator with bar replay!
Release Notes
Quick fix to a bar counting variable!Release Notes
Included "aesthetic" additions!The Vix/VixFix bottom box changes color per session. This setting can be turned off!
Release Notes
Added more "aesthetic" features. Working on additions conducive to successful trading now!
Release Notes
Added two box plots that appear when
Release Notes
Upgraded VIX TV; more to comeRelease Notes
Added: label size option, option to send the VIX/VixFix/ data and S&P 500 put/call ratio data to a table positioned in the bottom right, option to change the TV size, aesthetic changes to the box plot when VIX > 40, and a fun option to change the TV color to black & white. Release Notes
Last color changes, and fixed a date issue Release Notes
Put some data on the chart instead of in a tooltipRelease Notes
Code cleanupRelease Notes
Fixed the referencing length error. Script is good to go on SPX now.Thank you for the swift notify Tradingview community!
Release Notes
Added nameRelease Notes
A user requested that I make the script compatible with second-based intervals. Here it is!
Release Notes
Works on DJIOpen-source script
In true TradingView spirit, the author of this script has published it open-source, so traders can understand and verify it. Cheers to the author! You may use it for free, but reuse of this code in publication is governed by House rules. You can favorite it to use it on a chart.
Want to use this script on a chart?
•Access to Next-Gen Optimization Tools: kiosefftrading.com
•Discord Server: discord.gg/3cKVU28Z9Z
•Discord Server: discord.gg/3cKVU28Z9Z
Disclaimer
The information and publications are not meant to be, and do not constitute, financial, investment, trading, or other types of advice or recommendations supplied or endorsed by TradingView. Read more in the Terms of Use.