OPEN-SOURCE SCRIPT
All in One Strategy
Updated
True improvement over my previous script. This script adds in all of the complementary indicators, makes it truly easy to adjust the inputs, and has produced a real world net gain using the TradingView bots paired with any broker's API that is supported.
It has a selection for which strategy you'd like to use and due to limitations in Pine I cannot program in logic to make sure you only pick one, so you need to make sure you are only picking one.
To tweak the Connors option - it only depends on the RSI length variable, everything else is hard coded and tweaked for Crypto.
To tweak the MACD - play around with the min and max values of the RSI for lookback and the amount of candles to lookback. Then tweak the fast and slow MA lengths. I have found that a fast length of 3 or 4 and a slow length between 6 and 10 will yield the highest gains.
Also, when I was a young Noob I thought using a chart timeframe of 5 minutes was the best...no...no it wasn't. I lost my ass. Don't lose yours. I highly suggest sticking with a 30 minute timeframe, you will minimize losses caused by false triggers, have less trades and higher profits. More is not always better, trades that may sell one day and then buy six days later are normal. Leave it do its magic and you'll be very happy in the end.
Release Notes
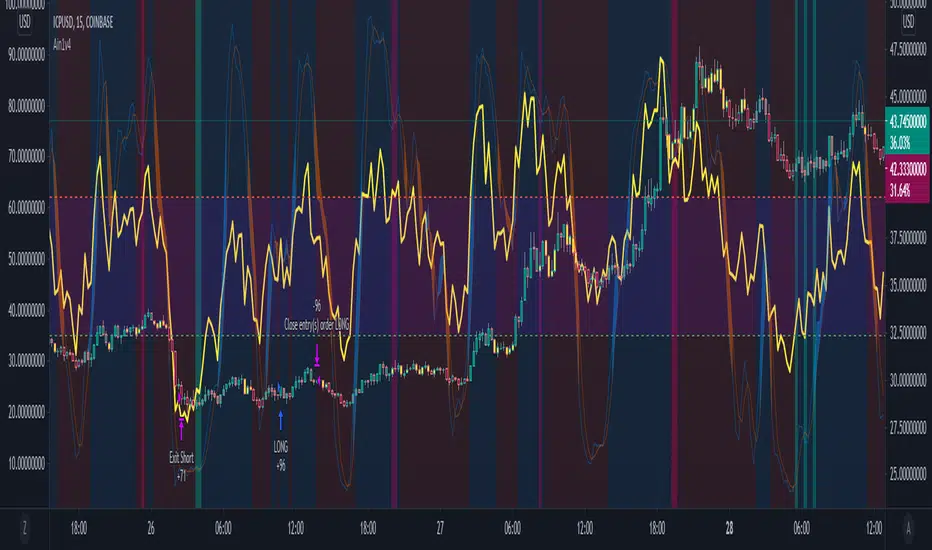
Have you ever wished for a Really Stupid Indicator (RSI) strategy that really worked? Well, alone it will never work. But, when paired with some actual mathematical logic to cross check for a true sell and buy condition it can do wonders. Look no further, with this update I bring you a vastly improved All in One strategy that has the true Holy Grail of RSI strategies built in. I have tweaked it that Long and Short can coexist peacefully within a single strategy to be unleased at the same time without the dumbass overlap you see with other strategies closing a long and starting a short at the same time as if by magic. To prove it works, I tried it with an Alt Coin - EOS. Here are the settings I used to produce these wonderful results. Oh...and NO REDRAWING!!! Of note, this is not for the squeamish and fidgety trader that expects a quick buy and sell to happen instantly as the price rises and falls. The average number of bars that buys and sells occur on is 278 bars at 30 minutes in this example, which amounts to 139 minutes for those that can't math. Backtested on EOSUSD pair on Coinbase.
30 minute chart time.
Initial Capital = 829.92
Start Time = 1 April 2021 00:00
End Time = 31 December 2021 00:00
Trade Type = Long/Short
Stop Loss % = 10
Target Profit % = 52.14
RSI Length = 14
Overbought = 62
Oversold = 35
Overbought Lookback Minimum Value = 51
Overbought Lookback Bars = 25
Oversold Lookback Minimum Value = 42
Oversold Lookback Bars = 35
Max Lookback Period = 5
K = 4
D = 12
Everything else not mentioned is default. The default strategy of this script is RSI, so behold the minimal loss of pennies and it's ability to adapt to changing market conditions via the dynamic RSI calculation built into it.
Release Notes
Fixed some issues reported to me on the EMA function, found the issue in one of the lines of code and apologize to anyone who ran into similar issues. I am still working on the Price Percentage function you see in here, I plan to make another update in the next few days once I have this worked out so it does not impact the function of the rest of the strategy.
I am also working on a guide I'll publish with the next update on how to fully use this strategy.
Release Notes
Added some better risk management techniques to the code due to the market making dookie as opposed to making money. How to use my script: docs.google.com/document/d/1JyQoVj_4EEPWNK__LkqZctrojTIOyacDMycBbaeuxEs/edit?usp=sharing
Release Notes
Found another error in the script for trading long and short together and fixed it. If you are using this script with the default RSI strategy and doing long/short simultaneously, you will need to set your trade equity either at 50% of the fiat or with a fixed number of contracts for the back test results to show the right analysis. Release Notes
Played around with the EMA portion of the strategy and figured out better crosses that didn't lose money like the common approach of fast crossing slow. Open-source script
In true TradingView spirit, the author of this script has published it open-source, so traders can understand and verify it. Cheers to the author! You may use it for free, but reuse of this code in publication is governed by House rules. You can favorite it to use it on a chart.
Performers follow, high performers break from convention.
Disclaimer
The information and publications are not meant to be, and do not constitute, financial, investment, trading, or other types of advice or recommendations supplied or endorsed by TradingView. Read more in the Terms of Use.