Editors' picksOPEN-SOURCE SCRIPT
Stochastic Heat Map
Updated
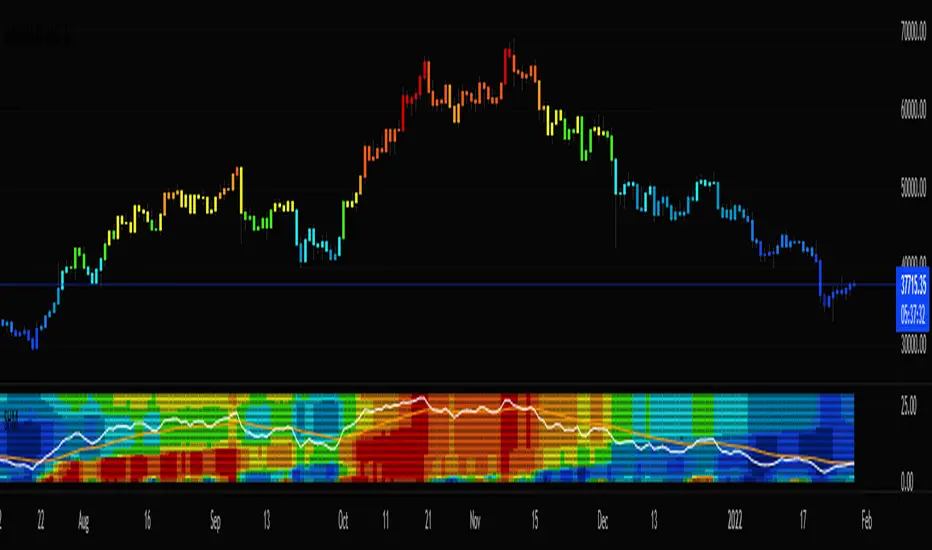
A series of 28 stochastic oscillators plotted horizontally and stacked vertically from bottom to top as the oscillator background.
Each oscillator has been interpreted and the value has been used to colour the lines in.
Lower lines are shorter term stochastics and higher lines are longer term stochastics.
The average of the 28 stochastics has been taken and then used to plot the fast oscillator line, which also has a slow oscillator line to follow.
The oscillator line can be used to colour in the candles.
Inputs:
MA: multiple smoothing methods
Theme: multiple colours
Increment: stochastic length start and increments
Smooth Fast: smooth fast length
Smooth Slow: smooth slow length
Paint Bars: colour candles
Waves: toggle method to weight/increment stochastics
Heat map shows momentum extremes:
Release Notes
Updated legacy code.Release Notes
Updated colours.Release Notes
The number of stochastics plotted in the background can now be controlled with the 'PlotNumber' input. This changes the average calculation and allows more control and precision.Release Notes
Updated fast and slow line width.Release Notes
Updated colours.Release Notes
Updated colours.Release Notes
Updated default settings.Release Notes
Updated colours.Release Notes
Updated.Release Notes
Updated default settings and colours.Release Notes
Updated colours.Open-source script
In true TradingView spirit, the author of this script has published it open-source, so traders can understand and verify it. Cheers to the author! You may use it for free, but reuse of this code in publication is governed by House rules. You can favorite it to use it on a chart.
Want to use this script on a chart?
Disclaimer
The information and publications are not meant to be, and do not constitute, financial, investment, trading, or other types of advice or recommendations supplied or endorsed by TradingView. Read more in the Terms of Use.