OPEN-SOURCE SCRIPT
40 period HMA with volume markers
Updated

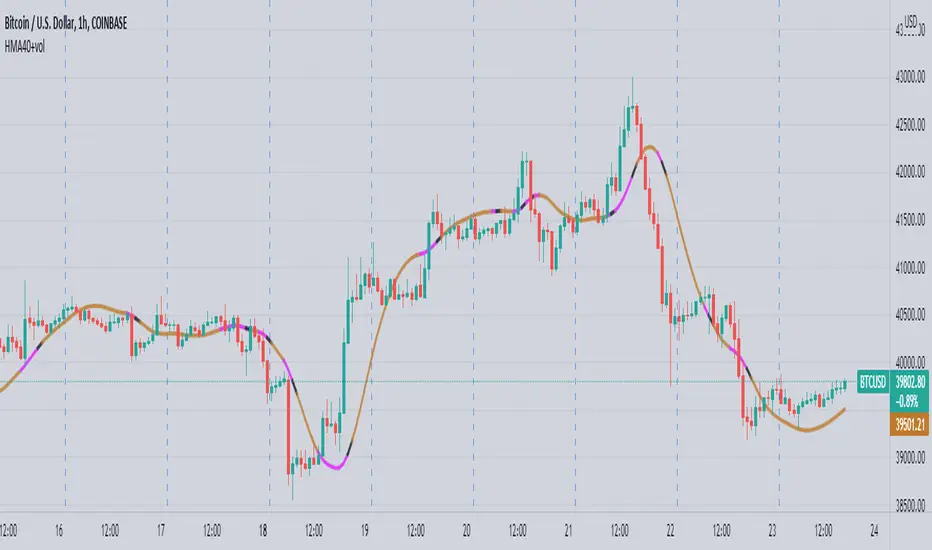
40 period Hull Moving Average with volume markers
This indicator puts a 40 period Hull Moving Average in the chart with the additional feature of colored stretches which mark a volume event, i.e. a rize in volume higher than 150% of the recently normal volume, for which the median volume in the previous 10 periods;
strategy
You can use this indicator in any timeframe. Prices higher than the line predict a coming rise, below the line a drop. The direction of the line points in the direction of the price movements. Tops and bottoms lag about 6 periods. volume events occur often at the beginning or the end of a trend.
Release Notes
added second marker color. stretch to the candle with the volume event gets color fuchsia, color black function as an ending marker. If several consecutive candles have volume event, these are all fuchsia, ends when there is no event. I think that gives more clarity.Release Notes
corrected a spelling errorOpen-source script
In true TradingView spirit, the author of this script has published it open-source, so traders can understand and verify it. Cheers to the author! You may use it for free, but reuse of this code in publication is governed by House rules. You can favorite it to use it on a chart.
Disclaimer
The information and publications are not meant to be, and do not constitute, financial, investment, trading, or other types of advice or recommendations supplied or endorsed by TradingView. Read more in the Terms of Use.