Editors' picksOPEN-SOURCE SCRIPT
RedK Compound Ratio Moving Average (CoRa_Wave)
Updated
Compound Ratio Weighted Average (CoRa_Wave) is a moving average where the weights increase in a "logarithmically linear" way - from the furthest point in the data to the current point - the formula to calculate these weights work in a similar way to how "compound ratio" works - you start with an initial amount, then add a consistent "ratio of the cumulative prior sum" each period until you reach the end amount. The result is, the "step ratio" between the weights is consistent - This is not the case with linear-weights moving average (WMA), or EMA
- for example, if you consider a Weighted Moving Average (WMA) of length 5, the weights will be (from the furthest point towards the most current) 1, 2, 3, 4, 5 -- we can see that the ratio between these weights are inconsistent. in fact, the ratio between the 2 furthest points is 2:1, but the ratio between the most recent points is 5:4 -- the ratio is inconsistent, and in fact, more recent points are not getting the best weights they should/can get to counter-act the lag effect. Using the Compound ratio approach addresses that point.
a key advantage here is that we can significantly reduce the "tail weight" - which is "relatively" large in other MAs and would be main cause for lag - giving more weights to the most recent data points - and in a way that is consistent, reliable and easy to "code"
- the outcome is, a moving average line that suffers very little lag regardless of the length, and that can be relied on to track the price movements and swings closely.
other features:
===============
- An accelerator, or multiplier, has been added to further increase the "aggressiveness" of the moving average line, giving even more weights to the more recent points - the multiplier will have more effect between 1 and 5, then will have a diminishing effect after that - note that a multiplier of 0 (which effectively causes a comp. ratio of 0 to be applied) will produce a Simple Moving Average line :)
- We also added the ability to use an "automatic smoothing" mechanism, that user can over-ride by manually choosing how much smoothing is used. This gives more flexibility to how we can leverage this Moving Average in our charting.
- User can also select the Resolution and Source price for the CoRa_Wave. by default, they will be set to "same as chart" and hlc3
here are the formulas for our Compound Ratio moving average:
Here's how CoRa_Wave compares to other common moving averages all set to the same length (20)
Proposed Usage
- CoRa_Wave can be used for any scenarios where we need a moving average that closely tracks the price, trend, swings with high responsiveness and little lag
- MA Cross-over scenarios - against another CoRa_Wave or any other MA
- below is a quick example scenario for how to utilize 2 CoRa_Wave lines of same length (one for open and one for closing price) to track swings and trends
- get as creative as you need :)
Code is commented - please feel free to leverage or customize further as you need.
👉 if you are interested in other moving averages i posted before, please check out the FiMA and the v_Wave ...
Release Notes
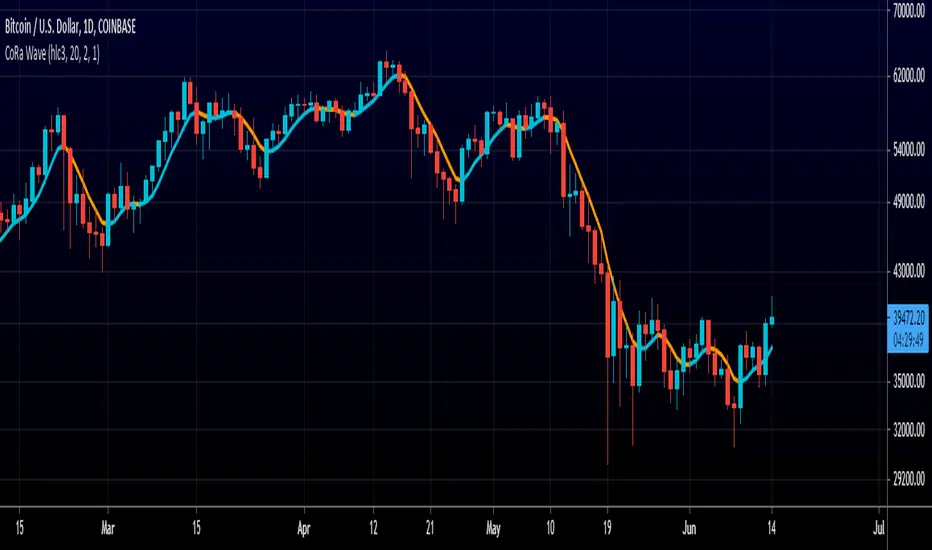
Quick update: CoRa_Wave is now dual color, more suitable for the visually oriented folks, like me!Release Notes
- Restore chartOpen-source script
In true TradingView spirit, the author of this script has published it open-source, so traders can understand and verify it. Cheers to the author! You may use it for free, but reuse of this code in publication is governed by House rules. You can favorite it to use it on a chart.
Want to use this script on a chart?
Disclaimer
The information and publications are not meant to be, and do not constitute, financial, investment, trading, or other types of advice or recommendations supplied or endorsed by TradingView. Read more in the Terms of Use.