Volume Profile Auto POC📌 Overview
Volume Profile Auto POC is a trend-following strategy that uses the automatically calculated Point of Control (POC) from the volume profile, combined with ATR zones, to capture reversals and breakouts.
By basing decisions on volume concentration, it dynamically visualizes the price levels most watched by market participants.
⚠️ This strategy is provided for educational and research purposes only.
Past performance does not guarantee future results.
🎯 Strategy Objectives
Automatically detect the volume concentration area (POC) to improve entry accuracy
Optimize risk management through ATR-based volatility adjustment
Provide early and consistent signals when trends emerge
✨ Key Features
Automatic POC Detection : Updates the volume profile over a defined lookback window in real time
ATR Zone Integration : Defines a POC ± 0.5 ATR zone to clarify potential reversals/breakouts
Visual Support : Plots the POC line and zones on the chart for intuitive decision-making
📊 Trading Rules
Long Entry:
Price breaks above the POC + 0.5 ATR zone
Volume is above average to support the breakout
Short Entry:
Price breaks below the POC - 0.5 ATR zone
Volume is above average to support the downside move
Exit (or Reverse Position):
Price returns to the POC area
Or touches the ATR band
⚙️ Trading Parameters & Considerations
Indicator Name: Volume Profile Auto POC
Parameters:
Lookback Bars: 50
Bins for Volume Profile: 24
ATR Length: 14
ATR Multiplier: 2.0
🖼 Visual Support
POC line plotted in red
POC ± 0.5 ATR zone displayed as a semi-transparent box
ATR bands plotted in blue for confirmation
🔧 Strategy Improvements & Uniqueness
This strategy is inspired by traditional Volume Profile + ATR analysis,
while adding the improvement of a sliding-window mechanism for automatic POC updates.
Compared with conventional trend-following approaches,
its strength lies in combining both price and volume perspectives for decision-making.
✅ Summary
Volume Profile Auto POC automatically extracts key market levels (POC) and combines them with ATR-based zones,
providing a responsive trend-following method.
It balances clarity with practicality, aiming for both usability and reproducibility.
⚠️ This strategy is based on historical data and does not guarantee future profits.
Always use proper risk management when applying it.
Control

RSI with Trend LinesThe RSI with Trend Lines indicator is a tool designed to analyze the behavior of the Relative Strength Index (RSI) combined with dynamic trend lines. This indicator not only provides the standard RSI reading but also identifies pivot points on the RSI and draws bullish and bearish trend lines based on these points. It also includes customizable options for adjusting trend lines, displaying the RSI moving average, and highlighting key levels such as overbought, oversold, and the center line.
This indicator is ideal for finding and identifying clear trends in the RSI and taking advantage of market breakout or consolidation signals. It also includes a table with the POC value, which represents the price level at which the most trading activity has occurred, indicating the highest liquidity and highest trading volume.
Key Features:
1. Basic RSI:
• Calculates the RSI using a configurable period length (default 14).
• Colors the RSI based on its direction (green for rising, red for falling) and its position relative to the center line (50).
2. Key Levels:
• Displays overbought (70 and 80), oversold (20 and 30), and the center line (50) levels for easy visual interpretation.
3. RSI Moving Average:
• Enables and configures an RSI moving average (SMA, EMA, WMA, or ALMA) to smooth out fluctuations and detect clearer trends.
4. Dynamic Trend Lines:
• Identifies pivot points on the RSI and draws bullish and bearish trend lines.
• Trend lines can be extended into the future or limited to the visible range.
• Includes options to display broken lines (trends that are no longer valid) and customize the style (solid or dashed).
5. Pivot Points:
• Displays the high and low pivot points on the chart for a better understanding of trend changes.
6. Advanced Customization:
• Adjust the pivot point period.
• Control the number of pivot points to consider for trend lines.
• Customize the line thickness and style.
How to Use the Indicator:
1. RSI Interpretation:
• Overbought Zone (RSI > 70): Indicates that the asset may be overvalued and could correct downward.
• Oversold Zone (RSI < 30): Suggests that the asset may be undervalued and could rebound.
• Centerline Crossover (50): A cross above 50 indicates bullish strength, while a cross below suggests weakness.
2. Trend Lines:
• Bullish Lines: Drawn when the RSI forms ascending low pivot points. These lines represent dynamic support.
• Bearish Lines: These are drawn when the RSI forms descending high pivot points. These lines represent dynamic resistance.
• Broken Lines: When a trend line becomes invalid (the RSI breaks the line), they are displayed in a dotted style to highlight the breakout.
3. Possible Trading Signals:
• Buy: When the RSI breaks an upward downtrend line.
• Sell: When the RSI breaks a downward uptrend line.
• Trend Confirmation: When the RSI stays within a valid trend line, it suggests that the current trend is strong.
4. A chart with the POC value:
• The point of control is a price level at which the highest trading volume occurs in a given time period. It is a key component of the Volume Profile indicator, which displays volume by price.
• Use of the POC in trading:
• The POC is used to identify areas of high interest and liquidity for trading.
• The POC provides information about the equilibrium point where buyers and sellers are most evenly matched.
• Therefore, it can be considered a zone of interest, meaning it can act as support or resistance.

Volume Profile [ZeroHeroTrading]Volume Profile by ZeroHeroTrading provides Volume Profile information fully leveraging the high/low values associated with the volume. As such, it closely aligns with the price action.
You can change the indicator settings as you see fit to achieve the best results for your use case.
Algorithm Notes
The indicator retrieves high/low/volume data within the set lookback period (number of bars back). It then sorts high/low boundaries, and accumulates the volume within the boundaries. Finally, it draws the Volume Profile as a filled out polyline joining all the boundaries together with the relevant accumulated volume proportion, and the POC as a box between the boundaries with the highest accumulated volume starting from the lookback.
When the lookback period is based on days back (instead of bars back), the indicator first dynamically calculates the number of bars to look back within the set number of days.
Please note that the lookback upper limit is 1000 bars back regardless of the settings. For instance, if the requested number of days results in the calculated bars back count (relative to the chart's timeframe) to be higher than 1000, the effective lookback will be 1000 bars back.
Features
It draws the Volume Profile and POC on the chart.
It allows for setting the number of bars or days to look back for retrieving the volume information.
It allows for setting the length of the Volume Profile being displayed (as a number of bars).
It allows for setting the offset from the last bar for the Volume Profile being displayed (as a number of bars).
It allows for setting the orientation of the Volume Profile being displayed from right to left and vice versa.
It allows for setting the colors for the Volume Profile and POC.
It allows for turning the POC functionality on/off.
Settings
Volume Lookback field: Sets number of bars or days to look back for retrieving the volume information. If the Volume Lookback field is set to 0, the volume data is retrieved for the current day regardless of the Bar(s)/Day(s) selection. Default is 200. Minimum is 0 and maximum is 1000.
Volume Lookback dropdown: If Bar(s) is selected, the volume data is retrieved for the set number of bars back. If Day(s) is selected, the volume data is retrieved for the current day plus the set number of day(s) back. Default is Bar(s).
Profile Bar Length field: Sets length of the Volume Profile being displayed as a number of bars. Default is 50. Minimum is 10 and maximum is 100.
Profile Bar Offset field: Sets offset from the last bar for the Volume Profile being displayed as a number of bars. Default is 10. Minimum is 0 and maximum is 100.
Profile Orientation dropdown: Selects Volume Profile orientation. Left is -right to left- and Right is -left to right-. Default is Left.
Profile Color select: Selects Volume Profile color. Default is blue (100% opacity).
Show POC checkbox: Turns on/off POC. Default is on.
POC Color select: Selects POC color. Default is orange (80% opacity).

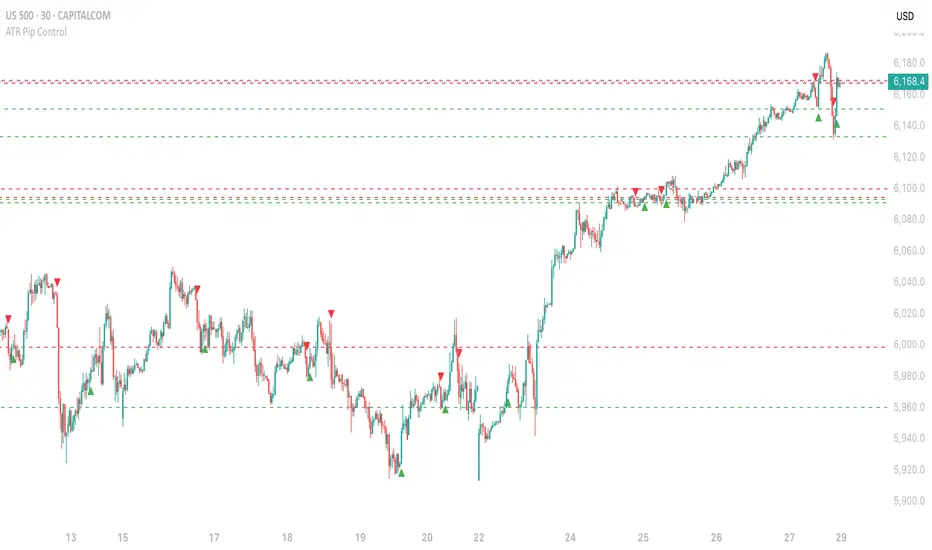
ATR Pip Control█ OVERVIEW
Here is a script based on the ATR but which unlike the traditional ATR using a Multiplier, here we use a signal filter by the Exchange of Prices
between Ticks. The more you increase the value, the more the parasitic signals will be filtered.
█ HOW TO INTERPRET?
• The signals are represented on the chart by "Buy" (Green) and "Sell" (Red) Labels.
• Pip Channel Control : Filters ATR Signals by the Exchange of Prices between Ticks. 0 = Disabled.
• Pip Length : Length of the Pip Channel. Depending on the Markets, the value can differ from 2 to 20 for Futures, Forex, CFD...
(But can go up to 5000 or more for Cryptos.) 0 = Disabled.
• Local High/Low : Local High/Low lines can be used as Stop Loss/Take Profit Zone.
• you have the option to display or not the Unconfirmed Signals on the Chart.
(They will also be displayed with "Buy" and "Sell" Labels but being transparent).
• The indicator works on all Timeframes and all types of markets.
• NO THE INDICATOR DOESN'T REPAINT.
█ ALERTS
Here is the list of Alerts available :
•ATR Buy (Unconfirmed)
•ATR Buy Condition!
•ATR Sell (Unconfirmed)
•ATR Sell Condition!
Please note that it is essential to always choose "Once per bar" (and NOT the "Once per bar close"!) option
whenever you want to place an Alert.
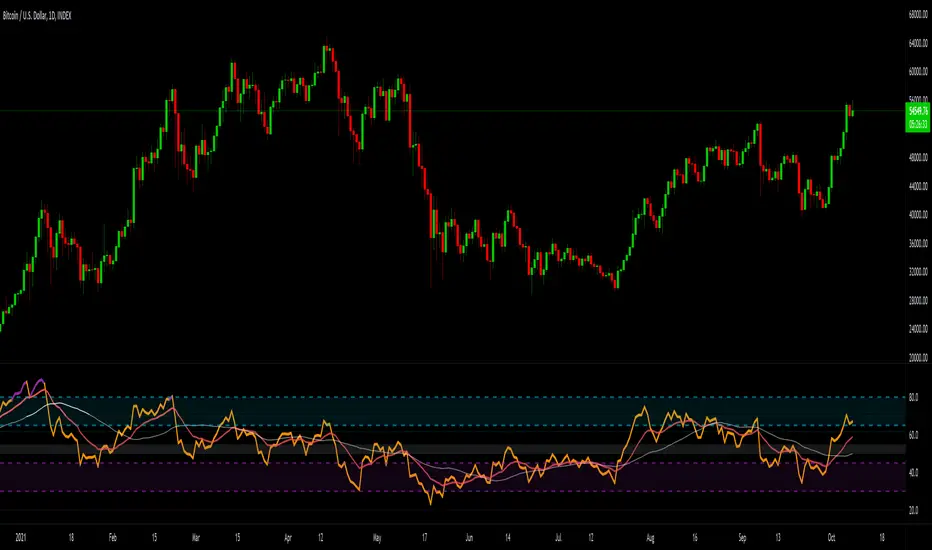
Bitcoin Correlated Market DirectionIdentifies which major market is "controlling" Bitcoin and what direction that market is moving in.
Helps to identify confluence of trend or potential turning points for Bitcoin.
Blue = stocks in control and bullish
Purple = stocks in control and bearish
Orange = gold in control and bullish
Red = gold in control and bearish

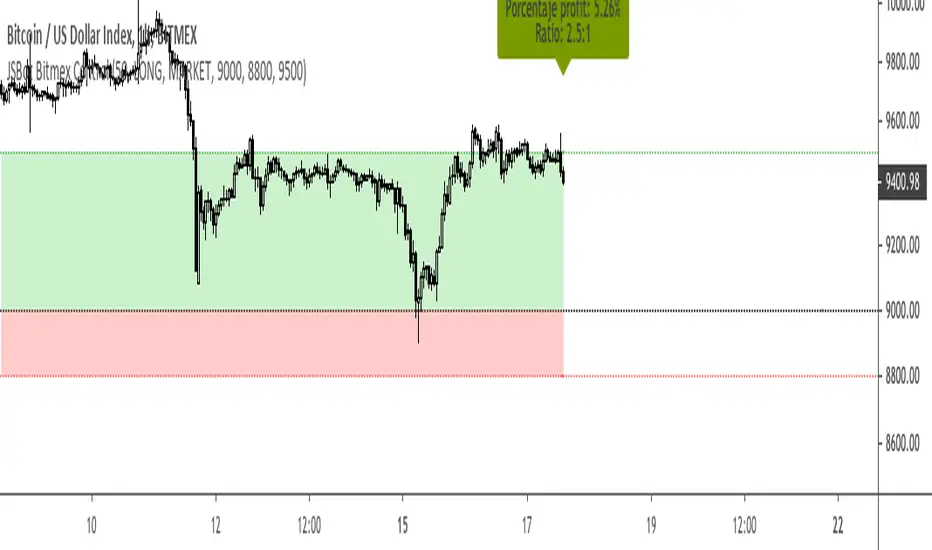
BITMEX TOOL - open/close positions in BITMEX - JSBOTBitmex tool with risk management
- Open positions in Bitmex from tradingview by alerts
- Set order quantity(bitmex account’s percentage), entry P rice, stoploss, takeprofit, trade direction and type order
- The entry price and the stoploss are in the same alert, if you want only open a position without a stoploss you should set it in zero (0)
- Take profit is optional so is in other alert
- If you chose Limit, when the alert is triggered an order will placed at $5 below the entry price in longs positions or $5 above the entry price in short positions (the same with the take profit)
- This indicator works with JSBOT (jsbot.online)
If you need more flexibility use the JSBOTs commands to set any indicator as you want
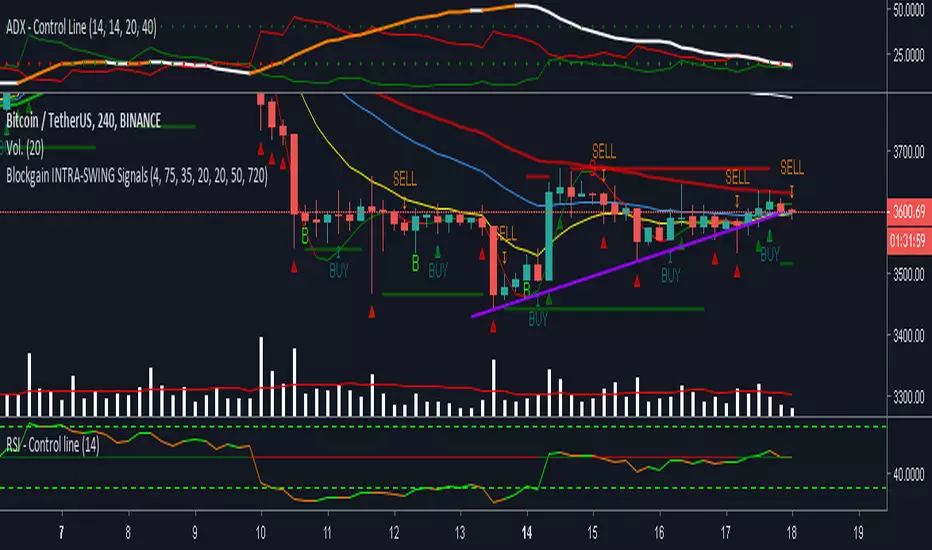
RSI with control linethis line of control represents, if the RSI is greater than the line of 50, the price trend is considered bullish, some people decrease it to 45

ADX with control lineThis line of control represents, if the ADX is greater than the line of 20, the price trend is considered strong, some people increase it to 25
Support & Resistance FilterVisualize support and resistance levels with a high level of user control. Tired of meaningless, tightly clustered, support and resistance lines (shouldn't those just be considered bounces)? Just filter them out with the Bounce Filter. Want to visualize S&R in a crisp, clear new way? Use "Areas of S&R". Want to have a ridiculous amount of control over what counts for support and resistance in the first place? Use the Swing Filter (built-in). Perhaps most interesting... ...want to see support and resistance for (say) Bitfinex-BTC/USD on a Coinbase chart to see how they affect Coinbase candles? Then check out the advanced settings and have fun ;)
Support & Resistance levels are determined by historic pivots (swings). If a price breaks through the first resistance level, it may really take off. If it breaks through the second level, or through all five resistance levels, you might be on your way to the moon (Lambos not included). The inverse is true when the price breaks-down, through support levels.
5 Levels of Support and 5 levels of Resistance are available.
In a very bullish or bearish situation, searching back in time for the next highest Support or Resistance level can become quite demanding on TradingView's server. I've pushed it to the limit:
R2 & S2 look back 1,000 candles
R3 & S3 look back 2,250 candles
R4 & S4 look back 3,500 candles
R5 & S5 look back 4,999 candles
When TradingView's servers are getting a little bogged down, you may get an error about "a loop being longer than 100ms". That just comes with the territory of searching so many candles back. To resolve it, just click "Force Reload" in the settings.
I'd love to post the manual, the instructions for the settings, here in the description, but the publishing policy sets a limit as to how long these descriptions can be. So check the comments for a manual on how to use this indicator. And if you'd like to plug this kind of indicator into your scripts, just contact me for custom work.
~jdhadwin
