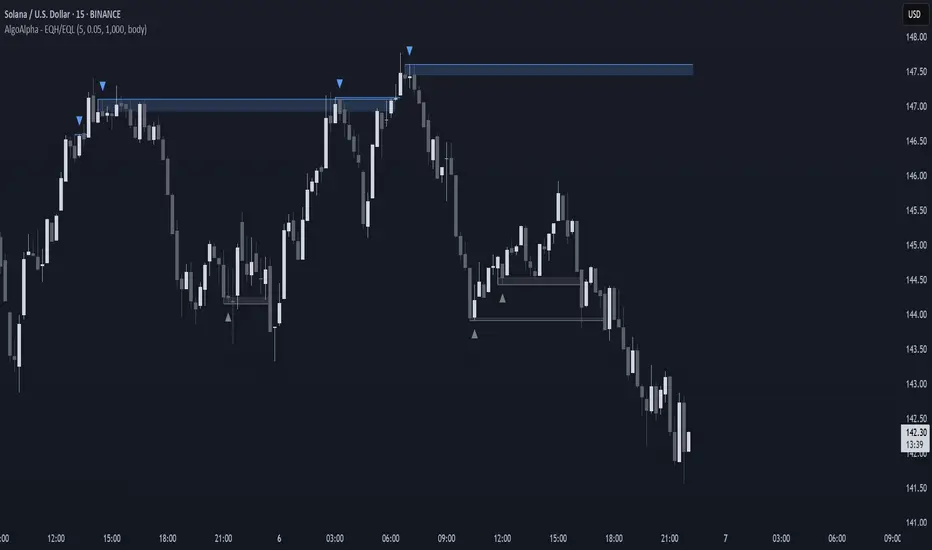
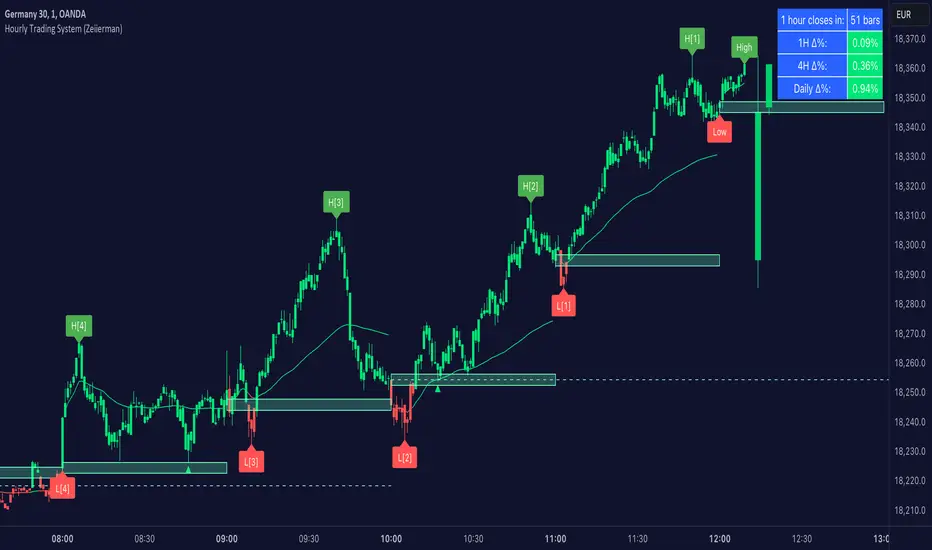
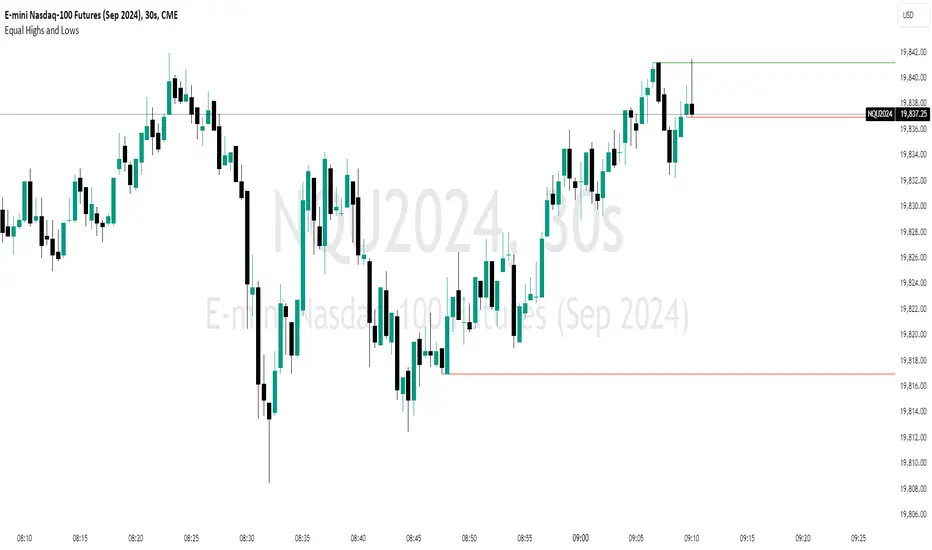
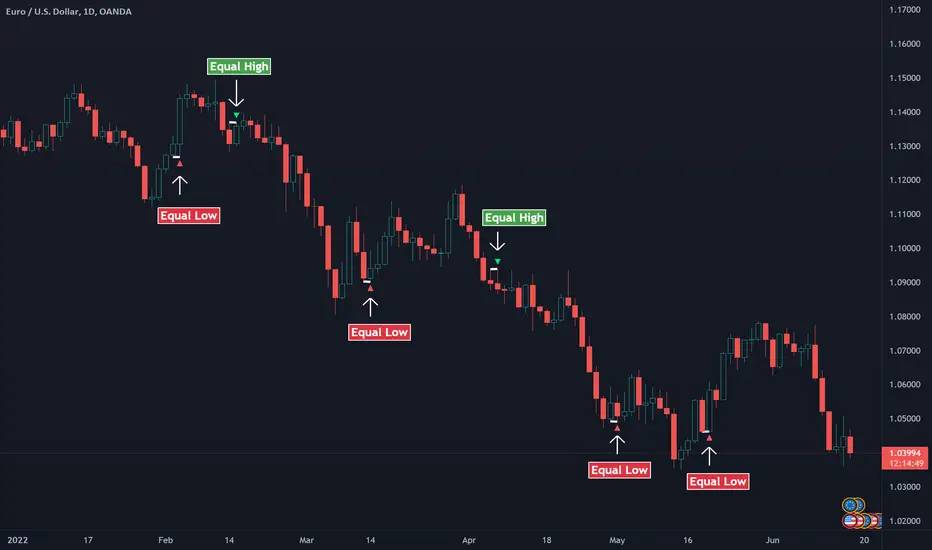
Liquidity Map | SattamLiquidity Map marks the price levels where resting orders are likely to sit, and shows which of them are still untouched. It combines four independent ways of locating that liquidity on one chart, each with its own switch, colors and alerts, plus a dashboard that lists the nearest untouched level above and below price.
All four modules and the dashboard on EURUSD 15m.
1. PIVOT RAYS
A ray starts at every fractal high (tan) and fractal low (green) and extends to the right while price has no
Indicator