Geometric Brownian Motion BandIf you are an option trader, who are constantly searching opportunities to set up inverse iron condor position or other strategies, you must be familiar in estimating the range induced by Geometric Brownian Motion (GBM), or Lognormal distribution someone may call.
The theory behind is adopted in the Black Scholes Option Pricing model, this assumes the asset price follows the GBM, shown below, and estimates the range where the price will fall into on the specific date and probability.
dS = a dt + v dW
Assuming the drift term is zero, this GBM Band applies the same model and helps you to quickly assess the suitable range to set up your option strategies with simple setting:
Length – number of bars covered
Vol Multiple - the z-score of the probability
Default values of the Length and Vol Multiple are set to 20 bars and 2.0 z-score respectively.
You can find an example how the GMB Band work.
You can also applies this GMB Band like how Bollinger's Band does for swing trade or breakaway trade.
If you find this indicator is useful to you, Star it, Follow, Donate, Like and Share.
Your support is a highly motivation for me.
Historical Volatility

Historical Volatility Percentile: Price and VolumeThis is an expansion of the Historical Volatility scripts to include both price and volume volatility.
As Tradingview states :
Historical Volatility is a measure of how much price (and now volume ) deviates from its average in a specific time period that can be set. The more price (or/and volume ) fluctuates, the higher the indicator value. Please note it does not measure the direction of price (and volume ) changes, just how volatile price/ volume has become. There are several reasons to care about volatility but it's mainly a risk measure. As volatility increases, so does risk and uncertainty and vice versa. Traders can use the indicator to flag instruments with high volatility which could point to a trend change. It is often used in combination with other signals.
Example options
Example formats
Link back to some other great ideas:
@Cheatcountry with his prolific sharing , what a great inspiration.
@Picte and his inspired idea .
@Balipour and his great script
Comparing this to other significant HVP indicators

Dexie Indicator v1.0The Dexie Indicator is a Forex indicator system built for the 5 min chart. It is suitable for Forex traders and Nadex users and provides BUY/SELL signals with alerts and comes with a series of 8 custom built Moving Averages designed to reduce the need for chart drawing.
This indicator can be used by beginners out of the box and requires very little trading experience to be successful.
The more advanced trader can work with this tool to greatly increase their success rate and make for a much more enjoyable trading experience.
Please contact for more details.
Dexie Indicator with BUY/SELL signals displayed only:
Dexie Indicator with BUY/SELL signals, Bollinger Bands and custom Moving Averages:
Dexie Indicator with all custom Moving Averages displayed:
Dexie Indicator slower Moving average bull cross example:
Dexie Indicator slower Moving average bear cross example:

Dexie Indicator v1.0The Dexie Indicator is a complete Forex trading system built for the 5 min chart. It is suitable for Nadex users and provides BUY/SELL signals with alerts and comes with a series of 8 custom built Moving Averages designed to reduce the need for chart drawing.
This indicator can be used by beginners out of the box and requires very little trading experience to be successful.
The more advanced trader can work with this tool to greatly increase their success rate and make for a much more enjoyable trading experience.
Please contact for more details.
Dexie Indicator with BUY/SELL signals displayed only:
Dexie Indicator with BUY/SELL signals, Bollinger Bands and custom Moving Averages
Dexie Indicator with all custom Moving Averages displayed

Historical Volatility MOEXIndicator of historical volatility.
The indicator is optimized for hourly bars (1h) and displays - red line - 1 day, yellow line - 3 day, green line - 5 day historical volatility .
The indicator is intended for use on futures of the Moscow Exchange MOEX
White lines - confidence interval HV (normal distribution) for a given sigma and days
Parameters
WindowInput - the number of bars calculating the HV red line
WindowInput2 - number of bars calculating the HV yellow line
WindowInput3 - the number of bars calculating the HV green line
SigmaMultiplicatorInput - set the sigma value for calculating the HV confidence interval
Exp_Day - set the number of days to calculate the confidence interval HV
Индикатор исторической волатильности.
Индикатор оптимизирован под часовые бары и отображает - красная линия - 1 дневная, желтая линия - 3 дневная, зеленая линия - 5 дневная историческая волатильность.
The indicator is intended for use on futures of the Moscow Exchange MOEX
Белые линии - доверительный интервал HV (нормальное распределение) при заданной сигма и дней
Параметры
WindowInput - количество баров расчета HV красная линия
WindowInput2 - количество баров расчета HV желтая линия
WindowInput3 - количество баров расчета HV зеленая линия
SigmaMultiplicatorInput - задаем значение сигма для расчета доверительного интервала HV
Exp_Day - задаем количестве дней для расчета доверительного интервала HV
Use the link below to obtain access to this indicator

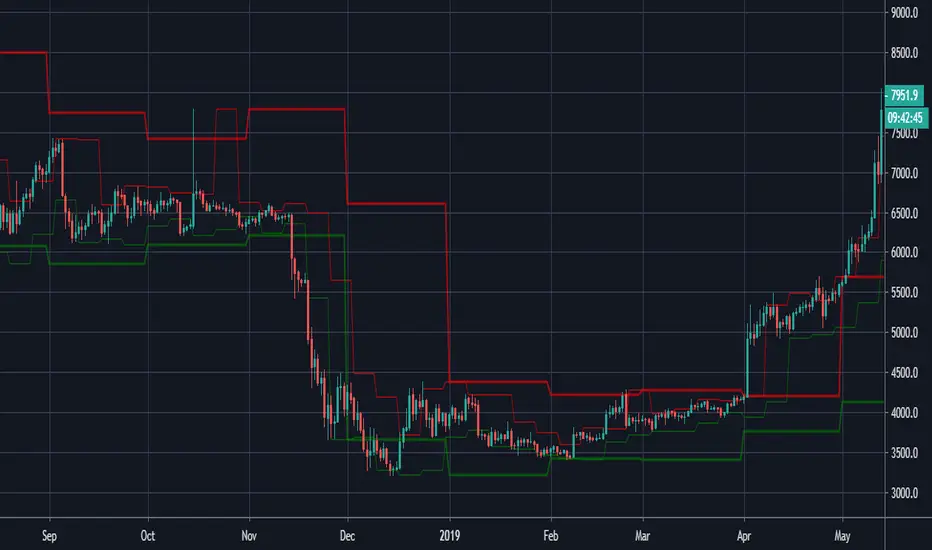
Historical Volatility CMEIndicator of historical volatility.
The indicator is optimized for hourly bars (1h) and displays - red line - 1 day, yellow line - 3 day, green line - 5 day historical volatility .
The indicator is intended for use on futures of the CME NYMEX
White lines - confidence interval HV (normal distribution) for a given sigma and days
Parameters
WindowInput - the number of bars calculating the HV red line
WindowInput2 - number of bars calculating the HV yellow line
WindowInput3 - the number of bars calculating the HV green line
SigmaMultiplicatorInput - set the sigma value for calculating the HV confidence interval
Exp_Day - set the number of days to calculate the confidence interval HV
Индикатор исторической волатильности.
Индикатор оптимизирован под часовые бары и отображает - красная линия - 1 дневная, желтая линия - 3 дневная, зеленая линия - 5 дневная историческая волатильность.
Индикатор предназначен для использования на фьючерсах бирж CME NYMEX
Белые линии - доверительный интервал HV (нормальное распределение) при заданной сигма и дней
Параметры
WindowInput - количество баров расчета HV красная линия
WindowInput2 - количество баров расчета HV желтая линия
WindowInput3 - количество баров расчета HV зеленая линия
SigmaMultiplicatorInput - задаем значение сигма для расчета доверительного интервала HV
Exp_Day - задаем количестве дней для расчета доверительного интервала HV
Use the link below to obtain access to this indicator

Historical Volatility US StoksIndicator of historical volatility.
The indicator is optimized for hourly bars (1h) and displays - red line - 1 day, yellow line - 3 day, green line - 5 day historical volatility .
The indicator is intended for use on U.S. Stocks
White lines - confidence interval HV (normal distribution) for a given sigma and days
Parameters
WindowInput - the number of bars calculating the HV red line
WindowInput2 - number of bars calculating the HV yellow line
WindowInput3 - the number of bars calculating the HV green line
SigmaMultiplicatorInput - set the sigma value for calculating the HV confidence interval
Exp_Day - set the number of days to calculate the confidence interval HV
Индикатор исторической волатильности.
Индикатор оптимизирован под часовые бары и отображает - красная линия - 1 дневная, желтая линия - 3 дневная, зеленая линия - 5 дневная историческая волатильность.
Индикатор предназначен для использования на акциях, ETF , ETN и индексах американских бирж NYSE NASDAQ и др.
Белые линии - доверительный интервал HV (нормальное распределение) при заданной сигма и дней
Параметры
WindowInput - количество баров расчета HV красная линия
WindowInput2 - количество баров расчета HV желтая линия
WindowInput3 - количество баров расчета HV зеленая линия
SigmaMultiplicatorInput - задаем значение сигма для расчета доверительного интервала HV
Exp_Day - задаем количестве дней для расчета доверительного интервала HV
Use the link below to obtain access to this indicator

Historical exponential volatilityIndicator of Historical volatility according to the exponential model with an additional moving average for CME , NYMEX futures
Window - the number of periods for calculating HV
WindowAdg - the number of periods for calculating the moving average for HV
Индикатор исторической волатильности по экспоненциальной модели с дополнительной скользящей средней. Оптимизирован под фьючерсы CME , NYMEX
Window - количество периодов расчета HV
WindowAdg - количество периодов расчета скользящей средней для HV

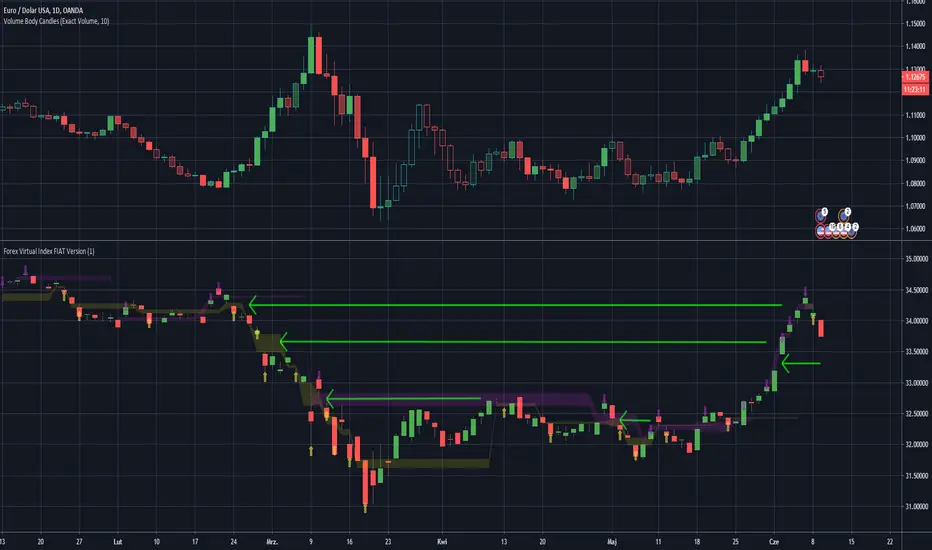
Forex Virtual Index FIAT VersionThis is virtually created FX Fiat pairs index based on OANDAs data.
Pairs are: EUR/USD , AUD/USD , GBP/USD , NZD/USD , AUD/JPY , EUR/JPY , GBP/JPY , USD/JPY , USD/CAD , USD/PLN
Be awared that some pairs like USD/CAD , have reversed correlation to the index.
You may look at the gaps as on standard S/R levels.
ps. Take look inside the scirpt's settings.
ps2. This script is invite-only for the members of our trading group (info in signature, group is free of charge).
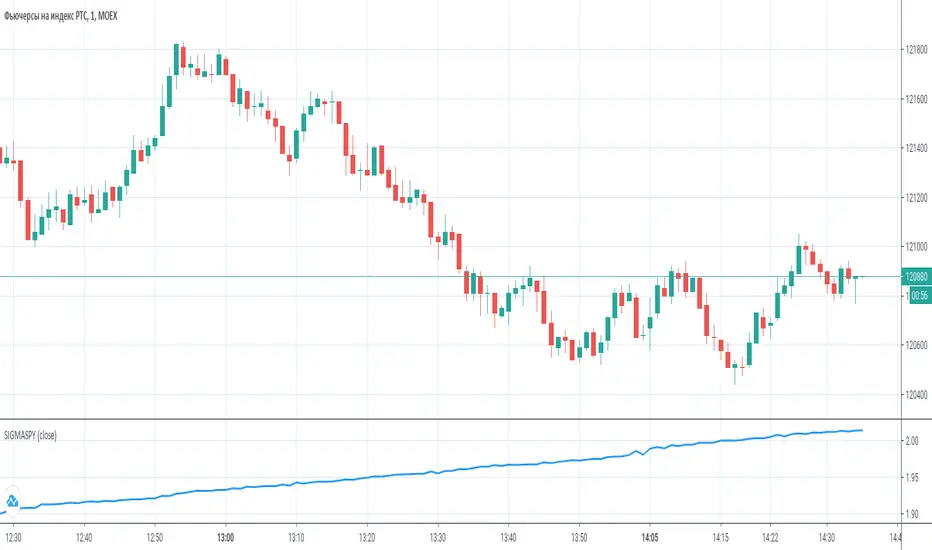
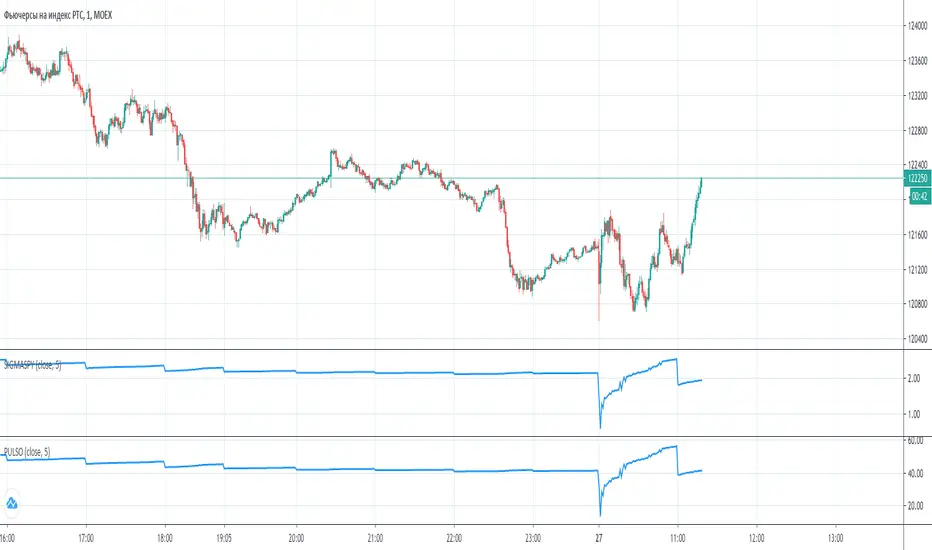
SigmaSpy: intraday deviation calculatorIndicator to estimate intraday price deviation for MOEX Futures, starts calculations each day at 10 a.m Moscow time
PulsoMetr: ongoing volatility estimatorPulsoMetr is ongoing volatility estimator for MOEX Futures. May be a little less exact since it does not consider nights and weekdays. It can not be used to measure on the day of option expiry, please, be careful. In days till expiry we put number of full days till expiry, try it with and without the current started day included in this number
E.B. ReturnWith this script you can calculate a year/week/daily return of 5 stocks. Simply you choose the stocks and you gonna see it on the graph.

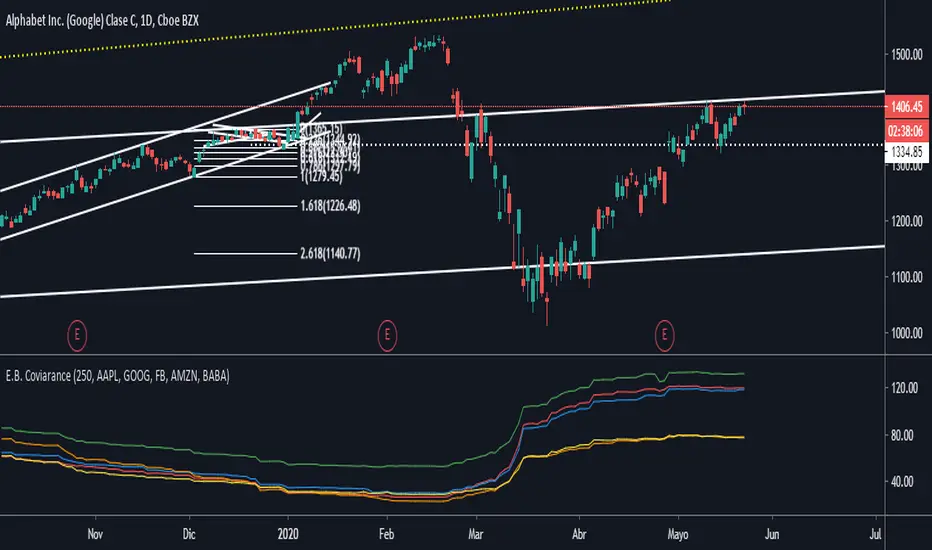
E.B. CoviaranceWith this script you can calculate the coviarance between two stocks. You can select until 5 diferents stocks to do it.
And you can choose the length too. If you want one year, two...
Why could you use it? To make a portfolio basically.
Realized Volatility IIR Filters with BandsDISCLAIMER:
The Following indicator/code IS NOT intended to be a formal investment advice or recommendation by the author, nor should be construed as such. Users will be fully responsible by their use regarding their own trading vehicles/assets.
The following indicator was made for NON LUCRATIVE ACTIVITIES and must remain as is following TradingView's regulations. Use of indicator and their code are published by Invitation Only for work and knowledge sharing. All access granted over it, their use, copy or re-use should mention authorship(s) and origin(s).
WARNING NOTICE!
THE INCLUDED FUNCTION MUST BE CONSIDERED AS TESTING. The models included in the indicator have been taken from open sources on the web and some of them has been modified by the author, problems could occur at diverse data sceneries.
WHAT'S THIS...?
Work derived by previous own research for study:
This is mainly an INFINITE IMPULSE RESPONSE FILTERING INDICATOR , it's purpose is to catch trend given by the nature of lag given by a VOLATILITY ESTIMATION ALGORITHM as it's coefficient. It provides as well an INFINITE IMPULSE RESPONSE DEVIATION FILTER that uses the same coefficients of the main filter to plot deviation bands as an auxiliary tool.
The given Filter based indicator provides my own Multi Volatility-Estimators Function with only 3 models:
ELASTIC VOLUME WEIGHTED VOLATILITY : This is a Modified Daigler & Padungsaksawasdi "Volume Weighted Volatility" as on DOI: 10.1504/IJBAAF.2018.089423 but with Elastic Volume Weighted Moving Average instead of VWAP (intraday) for faster (but inaccurate) calculation. A future version is planned on the way using intra-bar inspection for intraday timeframe as described in original paper.
GARMAN & KLASS / YANG-ZANG EXTENSION : As one of the best range based (OHLC) with open gaps inclusion in a single bar.
PETER MARTIN'S ULCER INDEX : This is a better approach to measure realized volatility than standard deviation of log returns given it's proven convex risk metric for DrawDowns as shown in Chekhlov et al. (2005) . Regarding this particular model, I take a different approach to use it as coefficient feed: Given that the UI only takes in consideration DrawDawns, I code myself the inverse of this to compute Draw-Ups as well and use both of them to filter minimums volatility levels in order to create a SLOW version of the IIR filter, and maximums of both to calculate as FAST variation. This approach can be used as a better proxy instead of any other common moving average given that with NO COMPOUND IN TIME AT ALL (N=1) or only using as long as N=3 bars of compund, the filter can catch a trend easily, making the indicator nearly a NON PARAMETRIC FILTER.
NOTES:
This version DO NOT INCLUDE ALERTS.
This version DO NOT INCLUDE STRATEGY: ALL Feedback welcome.
DERIVED WORK:
Incremental calculation of weighted mean and variance by Tony Finch (fanf2@cam. ac .uk) (dot@dotat.at), 2009.
Volume weighted volatility: empirical evidence for a new realised volatility measure by Chaiyuth Padungsaksawasdi & Robert T. Daigler, 2018.
Basic DSP Tips & Trics by TradingView user @alexgrover
CHEERS!
@XeL_Arjona 2020.

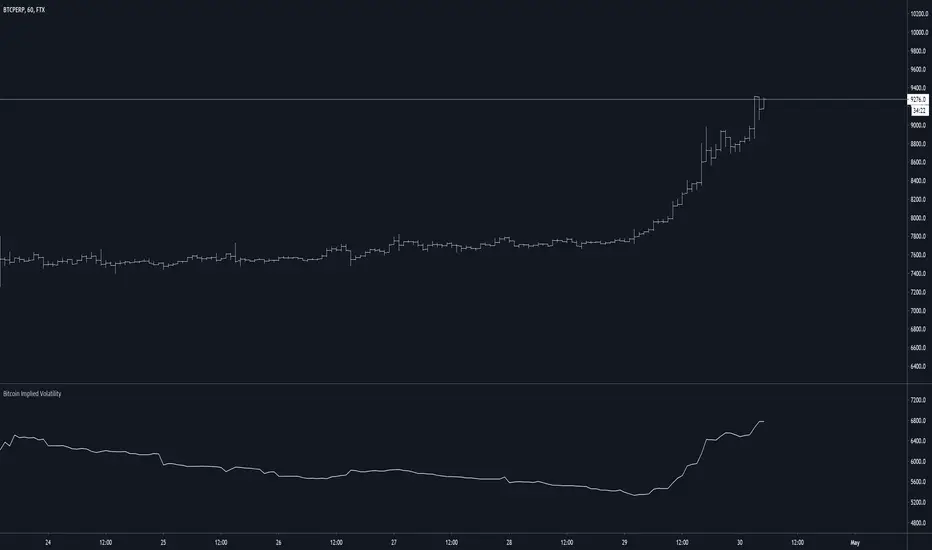
Bitcoin Implied VolatilityThis simple script collects data from FTX:BVOLUSD to plot BTC’s implied volatility as a standalone indicator instead of a chart.
Implied volatility is used to gauge future volatility and often used in options trading.
SPY Expected Move by VIXThis indicator shows 1 and 2 standard deviation price move from the VWAP based on VIX. Implied Volatility (IV) is being used extensively in the Option world to project the Expected Move for the underlying instrument. VIX is used as a proxy for SPY's IV for 30 days.
This indicator is meaningful only for SPY but can be used in any other instrument which has a strong correlation to SPY.

Historical Volatility Percentile + SMAHistorical Volatility Percentile tells you the percentage of the days from the past year (252 trading days) that have lower volatility than the current volatility.
I included a simple moving average as a signal line to show you how volatile the stock is at the moment.
I have included simple colors to let you know when to enter or exit a position.
Buy when price higher than EMA & historical volatility higher than SMA
Sell when price lower than EMA & historical volatility higher than SMA
Please let me know if you would like me to publish any other indicators! I always love to hear from you guys.

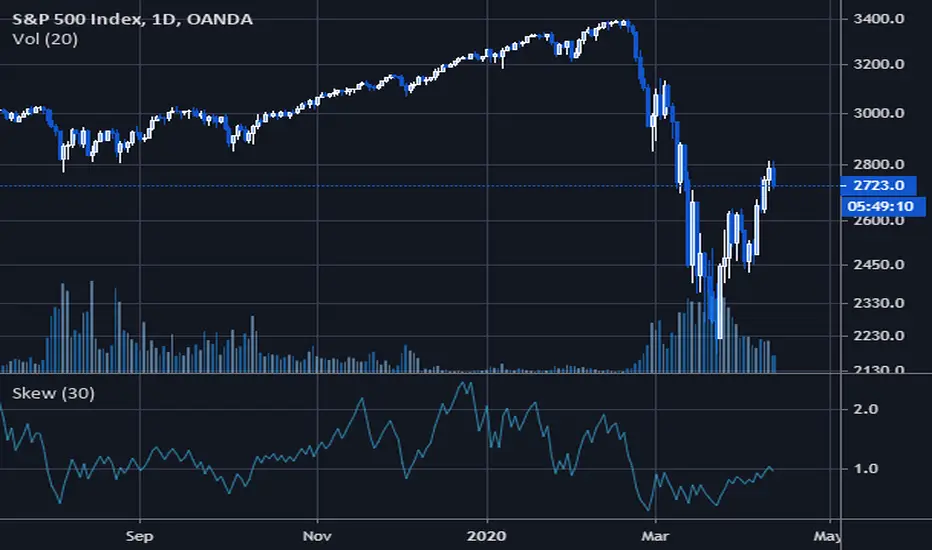
Volatility SkewThis indicator measure the historical skew of actual volatility for an individual security. It measure the volatility of up moves versus down moves over the period and gives a ratio. When the indicator is greater than one, it indicators that volatility is greater to the upside, when it is below 1 it indicates that volatility is skewed to the downside.
This is not comparable to the SKEW index, since that measures the implied volatility across option strikes, rather than using historical volatility.

Moving High & Low (2 Time Frames)===========
Moving High & Low (2 Time Frames)
===========
A simple line set indicator displaying the highs and lows of the previous selected timeframe upon a lower timeframe chart (2 line sets available).
e.g. Displaying the Highs & Lows of the last week and/or month on the 1D chart
-----------
Useful for 2 very different approaches to trading markets -
Finding Breakout Points:
For example - When candlestick closes above or below highs from previous week/month it may be a good time to go long as if the trend continues it may well go on for a long time making lots of pips along the way!
Finding SAR points within a range:
For example - When price starts ranging within horizontal line sets that aren't moving either way too much it may be a good idea to place long/short orders at appropriate key levels dictated by these range extremities, anticipating the price to reach these levels and deflect (Stop & Reverse) back the other way.
Either way we would recommend you NOT use this indicator alone, this is very much a confirmation tool or as an aid to find key levels of support/resistance.
Good Luck and Happy Trading!
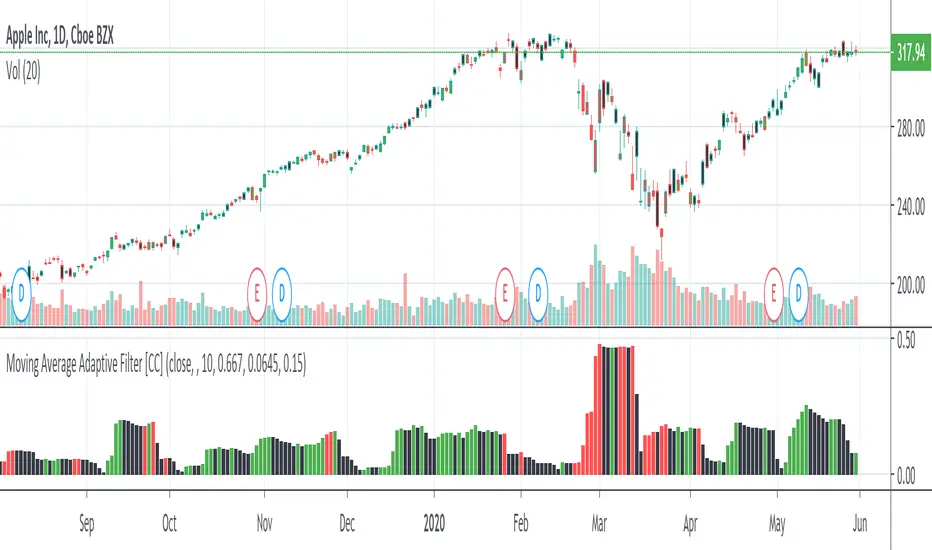
Moving Average Adaptive FilterThe Moving Avg Adaptive Filter (MAAF) was authored by Perry Kaufman in the Stocks and Commodities Magazine 03/1998
This is a volatility based indicator so when this indicator goes up, sell in the direction of how that stock is going. In other words go short when it is rising and the stock price is below the ema or go long when it is rising and the stock price is above the ema. Lower volatility means it is trading sideways or the current price action is about to reverse.
Send me a message and let me know what other indicators you would like to see!
Easy Loot Trailing Stop Bot - (PSAR) StrategyHello World,
Today I am bringing you a Parabolic Stop and Reverse Strategy that uses a 5% trailing stop loss.
Tested the strategy on the 1D timeframe of Bitcoin from the time period starting from 2018 onwards.
As you may know the price in the start of 2018 for Bitcoin was around $11,000 meaning if you bought and HODL'd since then you'd be down a good %, as current price is $8650.
Below is the strategy testing results, up 844% profits in the last two years.
Easy Loot Members Only, contact me if you'd like access to the strategy.
Parabolic Stop and Reverse (PSAR) Strategy
Parabolic SAR is a time and price technical analysis tool primarily used to identify points of potential stops and reverses. In fact, the SAR in Parabolic SAR stands for "Stop and Reverse". The indicator's calculations create a parabola which is located below price during a Bullish Trend and above Price during a Bearish Trend.
Trailing Stop Loss
A trailing stop-loss order is a special type of trade order where the stop-loss price is not set at a single, absolute dollar amount, but instead is set at a certain percentage or a certain dollar amount below the market price.

Standard Deviation Measurement ToolIf you like the script please come back and leave me a comment or find me on the interwebs. I get notified you "liked" it... but I have no idea if you actually use it. So, let me know =)
The script uses the open price as the mean and calculates the standard deviation from the open price on a per candle basis
- Goal: -
To establish a mean based on the Open Price and calculate the standard deviation.
The reason for this is if the Open is the mean, then the Standard deviation implies a standardized distance a given candle can be expected to travel
from the open price
- Edge: -
If you know that there is a 68%/95%/99.7% probability that price will NOT move more than
One Standard Deviation/Two Standard Deviations/Three Standard Deviations from the open price respectively
you can set reasonable price targets that relate to those probabilities in a given timeframe.
e.g. if you're on a 1h chart and your target is 3.5% from the open price, but 1 standard deviation of the hourly candle is equal to 0.78%.
You can make assumptions on either:
- The reasonableness of your target
or
- The holding period likely required for the trade.
Also, Standard Deviation is a function of volatility and this tool provides a unique mechanism for measuring volatility as well on a candle by candle basis
- Customization Options-
- Set 3 independent upper and lower standard deviations.
- Each set of standard deviations are on a switch so you can show 1, 2, or 3 sets of standard deviations
- You can set the distribution width
- Though it's not recommended, you can change the mean source.
- There is a switch to show the standard deviation on only the real-time bar or real-time and historical bars.
- How I Think About This Script -
This strategy is predicated the same principle as Bollinger Bands: the reality that 68% of all data points will fall within one standard deviation of the mean, 96% of all data points will fall within two standard deviations, and 98% of al data points will fall within 3 standard deviations. By understanding the standard deviation, you can possibly infer an edge by understanding the probabilistic range price will be bound to the limits of standard deviation rules according to their probabilistic outcomes for the single candle on any given timeframe. Bollinger Bands are designed to provide this information with the mean being a 20-period moving average and this indicator.
This indicator is designed to provide standard deviation information with the mean being based on the distance price travels away from the open of individual candles in the lookback period.
If you use a strategy where you enter on major candle closes, this can be useful to set targets for those entries based on the intended hold period or at least add/remove validity to other target metrics.
Example:
Your target is at the 1.618 Fibonacci level and your confirmation triggers on the 4h candle close (H4 if that's your thing lol). You set up the indicator based on the standard deviation of price movement in 4h candles over the last week.
Let's say the indicator shows that the 1.618 Fibonacci level is 3 standard deviations away.
This being the case this statistically indicates that within the next 4 hours, you have a very low probability of achieving your target (>2%). This doesn't invalidate your target, but it does indicate a low probability of achieving it in the next 4hrs. With this information, you can infer that you are either going to be (a) really lucky (b) in this trade for a lot longer than 4hrs or (c) your target is unrealistic given your intended hold period.
You can develop a more probabilistically favorable hold period calculation by looking at the standard deviation on a higher time frame (e.g. 1d-1w).
Bonus feature: You'll find that the 2 and 3 standard deviations will often "cluster" and these clusters often provide future S/R levels. That's a pretty sweet feature no one things to look for. But, try it. Find a cluster of 2nd and 3rd stdevs that are in somewhat of a horizontal pattern (usually the result of a range) and you'll find that to be a good s/r area. Even better if you use the 3.2 standard deviation, you'll find that is a fantastic breakout signal!
Summary
So, you can use it for target setting, a confluence test, a reasonableness test, or just a measurement tool.
This was the first TV script I ever wrong.. Got taken down. But, I've re-released it because there are other TV scripts that attempt to do this but are completely wrong.
Please be careful about using other people's scripts. Always validate the math of the script before you use it if possible.
Stay safe out there and I hope all your dreams come true.
