Indicators, Strategies and Libraries
English: This script, RT Ratio shows the ratio between J-REIT(TSE:REIT) and TOPIX(TSE:TOPIX). J-REIT tends to be higher than TOPIX, over 1.0. When J-REIT is lower than TOPIX, below 1.0, J-REIT may be over sold. RT Ratio < 1.0 : J-REIT over sold, a good chance to buy J-REIT. RT Ratio > 1.4-1.5 : Over bought, J-REIT may be too high. Notice: RT Ratio is for a...
This is a % premium vs average BTCUSD price. In other words, how much % more are exchanges selling bitcoin at compared to normal BTCUSD price? Blue: Korea Red: Japan Yellow: China Green: USD Exchanges including Bitfinex, Poloniex, Coinbase, and Bitstamp
Red line is the % premium to buy bitcoin in Japan. Blue is the % premium to buy bitcoin in korea.
Rate of change of most volatile JPY and GBP pairs. All pairs ending in JPY are red except GBPJPY (colored yellow --currently most volatile 7/2016). GBPNZD is blue, the other GBP pairs are green, lime and teal. GBPJPY and GBPNZD are my favorite day trading / swing trading pairs. This script allows me to see the action of the most volatile and liquid pairs on one...
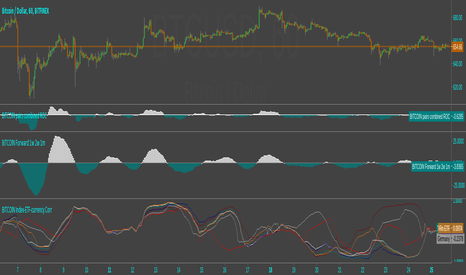
Script plots correlation of chart symbol to a variety of indexes, symbols, equities. ** Original idea was to find Bitcoin correlation, which I did not. Built in correlations are: Nikie, DAX, SPY, AAPL, US Dollar, Gold, EURUSD, USDCNY, EEM, QQQ, XLK, XLF, USDJPY, EURGBP


![Time_Exchanges [SwetSwet] BTCUSD: Time_Exchanges [SwetSwet]](https://s3.tradingview.com/9/9pRs6rNL_mid.png)
