Linear and Logarithmic Fibonacci Levels and FansIntroduction
The Fibonacci Retracement tool is a go-to for traders looking to spot potential support and resistance levels. By measuring the distance between swing highs and lows, you can apply Fibonacci ratios like 0.236, 0.382, and 0.618 to predict key market levels.
Traditionally, these levels are set by dividing this distance into equal parts—known as Linear Levels. A more refined approach, Logarithmic Levels, divides the distance into proportionally equal segments. Plus, this indicator now includes Fibonacci fans, adding another layer of analysis by projecting potential price levels using trendlines based on Fibonacci ratios.
This tool makes it easier to identify both Linear and Logarithmic levels while also leveraging Fibonacci fans for a more complete market view.
Applications
Logarithmic Levels and Fibonacci fans are ideal for volatile markets. In crypto, they’re especially effective for BTCUSDT (check out the wick from January 23, 2024). They also help spot accumulation and distribution patterns in high-volume altcoins like FETUSDT . In traditional markets, they’re useful for tracking stocks like TSLA and NVDA with extreme price swings, as well as indices in inflation-affected markets like XU100 , or recession-hit currency pairs like JPYUSD .
How to Use
This indicator is intuitive and similar to TradingView’s Fibonacci Tool. Select your reference levels (Level 1 and Level 0), then tweak the settings to customize your analysis, including adding Fibonacci fans for extra insights.
Why It’s Different
Unlike TradingView’s tool, which forces you to switch to a logarithmic scale (messing with other indicators and trend lines), this indicator lets you view both Linear and Logarithmic levels—and Fibonacci fans—without changing your chart’s scale. The original Fibonacci Code was derived from zekicanozkanli, modified and upgraded to plot fib fans as well.
Logscale

Linear Regression ChannelLinear Regression Channel with Logarithmic Scale Option
This advanced Linear Regression Channel indicator offers traders a powerful tool for technical analysis, with unique features that set it apart from standard implementations.
Key Features:
Logarithmic Scale Option: One of the most distinctive aspects of this indicator is the ability to switch between classic and logarithmic scales. This feature is particularly valuable for long-term analysis, as it ensures that equal percentage changes are represented equally, regardless of the price level.
Flexible Start Date: Unlike many indicators that rely on a fixed number of periods, this tool allows users to set a specific start date and time. This feature provides precise control over the regression analysis timeframe, enhancing its adaptability to various trading strategies.
Customizable Channel Settings: Users can adjust the upper and lower deviation multipliers, allowing for fine-tuning of the channel width to suit different market conditions and trading styles.
Trend Strength Indicator: An optional feature that displays the strength of the trend based on the Pearson correlation coefficient, offering additional insight into the reliability of the current trend.
Comprehensive Visual Customization: The indicator offers extensive color and style options for the regression line, upper and lower channel lines, and fill areas, allowing traders to create a visually appealing and easy-to-read chart setup.
Extended Line Options: Users can choose to extend the regression lines to the left, right, or both, facilitating projection and analysis of future price movements.
Multiple Alert Conditions: The indicator includes four alert conditions for crossing the upper deviation, lower deviation, and the main regression line in both directions, enhancing its utility for active traders.
Why Choose This Indicator:
The combination of logarithmic scale option and flexible start date setting makes this Linear Regression Channel uniquely suited for both short-term and long-term analysis. The logarithmic scale is particularly beneficial for analyzing assets with significant price changes over time, as it normalizes percentage moves across different price levels. This feature, coupled with the ability to set a precise start date, allows traders to perform more accurate and relevant regression analyses, especially when studying specific market cycles or events.
Moreover, the trend strength indicator and customizable visual elements provide traders with a comprehensive tool that not only identifies potential support and resistance levels but also offers insight into the reliability and strength of the current trend.
In summary, this Linear Regression Channel indicator combines flexibility, precision, and insightful analytics, making it an invaluable tool for traders seeking to enhance their technical analysis capabilities on TradingView.

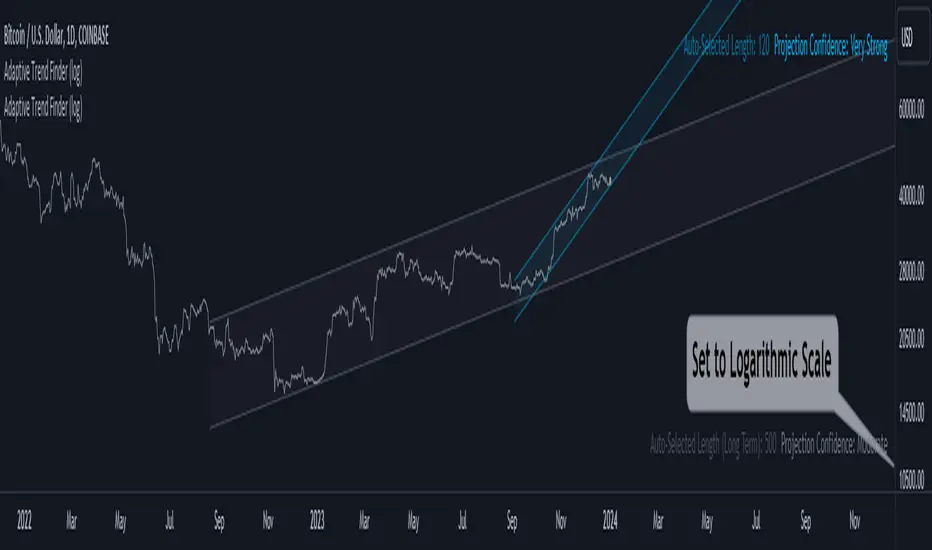
Adaptive Trend Finder (log)In the dynamic landscape of financial markets, the Adaptive Trend Finder (log) stands out as an example of precision and professionalism. This advanced tool, equipped with a unique feature, offers traders a sophisticated approach to market trend analysis: the choice between automatic detection of the long-term or short-term trend channel.
Key Features:
1. Choice Between Long-Term or Short-Term Trend Channel Detection: Positioned first, this distinctive feature of the Adaptive Trend Finder (log) allows traders to customize their analysis by choosing between the automatic detection of the long-term or short-term trend channel. This increased flexibility adapts to individual trading preferences and changing market conditions.
2. Autonomous Trend Channel Detection: Leveraging the robust statistical measure of the Pearson coefficient, the Adaptive Trend Finder (log) excels in autonomously locating the optimal trend channel. This data-driven approach ensures objective trend analysis, reducing subjective biases, and enhancing overall precision.
3. Precision of Logarithmic Scale: A distinctive characteristic of our indicator is its strategic use of the logarithmic scale for regression channels. This approach enables nuanced analysis of linear regression channels, capturing the subtleties of trends while accommodating variations in the amplitude of price movements.
4. Length and Strength Visualization: Traders gain a comprehensive view of the selected trend channel, with the revelation of its length and quantification of trend strength. These dual pieces of information empower traders to make informed decisions, providing insights into both the direction and intensity of the prevailing trend.
In the demanding universe of financial markets, the Adaptive Trend Finder (log) asserts itself as an essential tool for traders, offering an unparalleled combination of precision, professionalism, and customization. Highlighting the choice between automatic detection of the long-term or short-term trend channel in the first position, this indicator uniquely caters to the specific needs of each trader, ensuring informed decision-making in an ever-evolving financial environment.
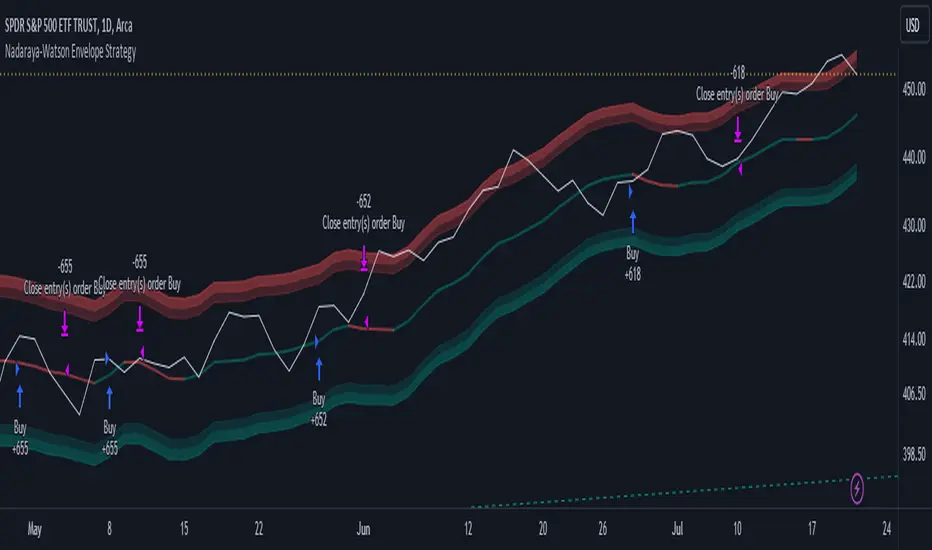
Nadaraya-Watson Envelope Strategy (Non-Repainting) Log ScaleIn the diverse world of trading strategies, the Nadaraya-Watson Envelope Strategy offers a different approach. Grounded in mathematical analysis, this strategy utilizes the Nadaraya-Watson kernel regression, a method traditionally employed for interpreting complex data patterns.
At the core of this strategy lies the concept of 'envelopes', which are essentially dynamic volatility bands formed around the price based on a custom Average True Range (ATR). These envelopes help provide guidance on potential market entry and exit points. The strategy suggests considering a buy when the price crosses the lower envelope and a sell when it crosses the upper envelope.
One distinctive characteristic of the Nadaraya-Watson Envelope Strategy is its use of a logarithmic scale, as opposed to a linear scale. The logarithmic scale can be advantageous when dealing with larger timeframes and assets with wide-ranging price movements.
The strategy is implemented using Pine Script v5, and includes several adjustable parameters such as the lookback window, relative weighting, and the regression start point, providing a level of flexibility.
However, it's important to maintain a balanced view. While the use of mathematical models like the Nadaraya-Watson kernel regression may provide insightful data analysis, no strategy can guarantee success. Thorough backtesting, understanding the mathematical principles involved, and sound risk management are always essential when applying any trading strategy.
The Nadaraya-Watson Envelope Strategy thus offers another tool for traders to consider. As with all strategies, its effectiveness will largely depend on the trader's understanding, application, and the specific market conditions.
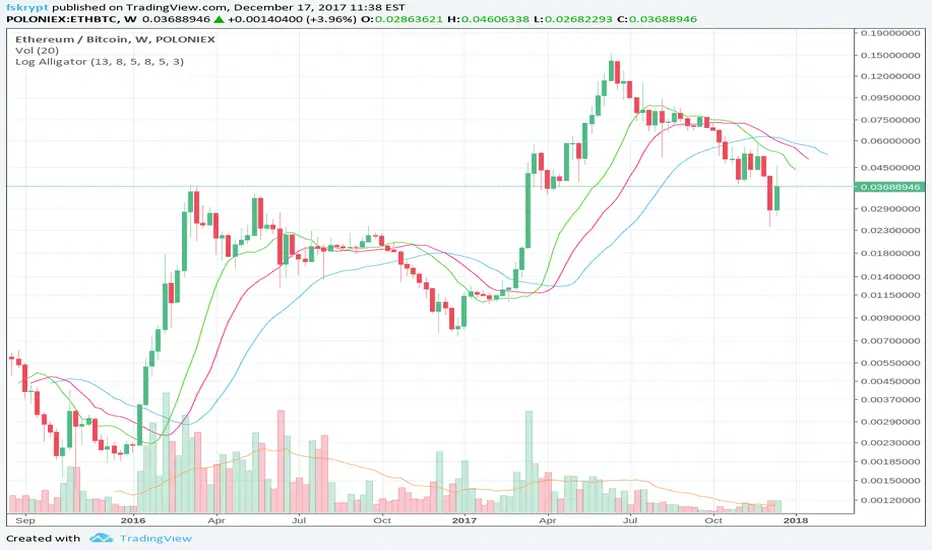
Log-space Williams AlligatorMake Williams Alligator usable for looking at weekly and high-volatility crypto charts.
The built-in indicator may have some problems with these charts, as in example below:
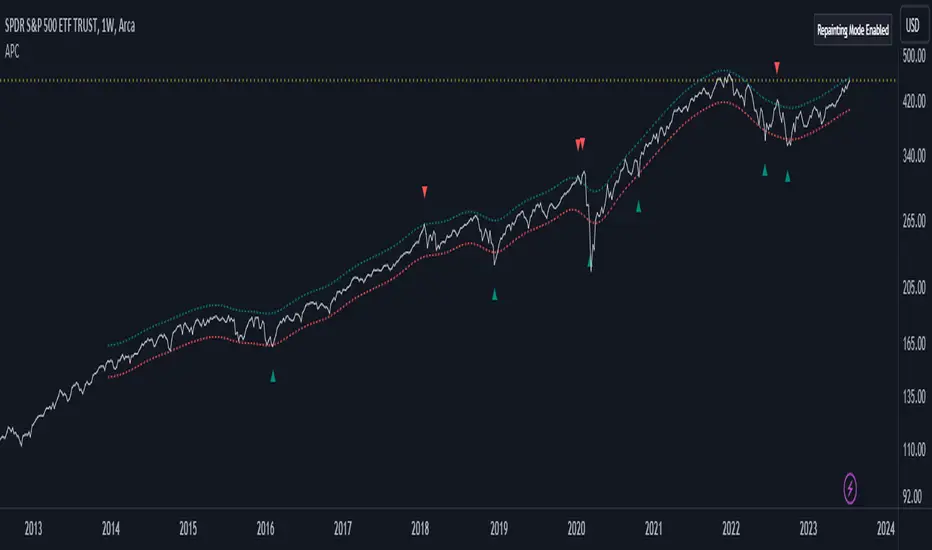
Adaptive Price Channel (log scale)The field of technical analysis is consistently expanding, with numerous indicators used for market forecasting. Amongst them, a novel indicator dubbed the Adaptive Price Channel (log scale), inspired by the renowned Nadaraya-Watson Envelope (LuxAlgo) from LuxAlgo, is gaining traction for its distinctive features and versatility. Unlike its predecessor, the Adaptive Price Channel (log scale) is applicable on a logarithmic scale, thereby allowing it to be utilized on both smaller and larger timeframes.
1. Key Features
The Adaptive Price Channel (log scale) is founded on the trading view Pinescript language, version 5, with its primary aim to maximize the versatility and scalability of trading indicators. It allows traders to adapt it according to their preferred timeframe, thereby making it applicable for a wide range of trading strategies.
Its bandwidth can be adjusted through the input parameters, offering traders the flexibility to manipulate the indicator according to their strategic requirements. Furthermore, it provides an option for repainting smoothing. This option enables users to control the repainting effect in which the historical output of the indicator may change over time. When disabled, the indicator provides the endpoints of the calculations, ensuring consistency in historical values.
Moreover, the Adaptive Price Channel (log scale) allows for color customization, thereby improving visibility and user-friendliness. The colors of the indicator's upward and downward directions can be changed according to the user's preference.
2. Working Mechanism
The Adaptive Price Channel (log scale) uses the logarithm of the source, which is typically the closing price of a trading instrument. It leverages a Gaussian function that exponentially decreases the further the price moves away from the mean, accounting for both positive and negative values. The bandwidth of the Gaussian function can be adjusted to adapt to different market conditions.
Additionally, the Adaptive Price Channel (log scale) features an array of 500 lines for each bar, which helps in defining the boundaries or envelope for price movements. The calculations are executed using the Nadaraya-Watson estimator, which uses kernel regression for non-parametric analysis.
The calculated values for the upper and lower bounds of the envelope are then converted back from the logarithmic scale using the exponential function. This calculation process continues for each bar until the last bar in the data set.
To ensure optimal performance, the Adaptive Price Channel (log scale) uses dynamic repainting. If the repainting mode is enabled, it adjusts the smoothing of the indicator for the entire historical data, making the results more accurate.
3. Visualization and Alerts
The Adaptive Price Channel (log scale) offers an array of visual aids, including labels and plots. The upper and lower bounds of the envelope are plotted, and the indicator triggers labels at points where the closing price crosses these boundaries. These labels serve as alerts for potential trading opportunities.
4. Conclusion
The Adaptive Price Channel (log scale) is an innovative and adaptable trading indicator, drawing inspiration from its predecessor but introducing unique features to increase its versatility. By providing a repainting option, it ensures consistent historical values, thereby enhancing the reliability of the indicator. Furthermore, the capability to operate on a logarithmic scale broadens its usability for different timeframes. The Adaptive Price Channel (log scale) is a powerful tool for any trader, facilitating a better understanding of market dynamics, and enabling more informed decision-making.
Linear Regression Channel (Log)The Linear Regression Channel (Log) indicator is a modified version of the Linear Regression channel available on TradingView. It is designed to be used on a logarithmic scale, providing a different perspective on price movements.
The indicator utilizes the concept of linear regression to visualize the overall price trend in a specific section of the chart. The central line represents the linear regression calculation, while the upper and lower lines indicate a certain number of standard deviations away from the central line. These bands serve as support and resistance levels, and when prices remain outside the channel for an extended period, a potential reversal may be anticipated.
I have replaced the Pearson values with trend strength levels to enhance understanding for individuals unfamiliar with Pearson correlation.

eHarmonicpatternsLogScaleLibrary "eHarmonicpatternsLogScale"
Library provides functions to scan harmonic patterns both or normal and log scale
getSupportedPatterns()
get_prz_range(x, a, b, c, patternArray, errorPercent, start_adj, end_adj, logScale)
Provides PRZ range based on BCD and XAD ranges
Parameters:
x : X coordinate value
a : A coordinate value
b : B coordinate value
c : C coordinate value
patternArray : Pattern flags for which PRZ range needs to be calculated
errorPercent : Error threshold
start_adj : - Adjustments for entry levels
end_adj : - Adjustments for stop levels
logScale : - calculate on log scale. Default is false
Returns: Start and end of consolidated PRZ range
get_prz_range_xad(x, a, b, c, patternArray, errorPercent, start_adj, end_adj, logScale)
Provides PRZ range based on XAD range only
Parameters:
x : X coordinate value
a : A coordinate value
b : B coordinate value
c : C coordinate value
patternArray : Pattern flags for which PRZ range needs to be calculated
errorPercent : Error threshold
start_adj : - Adjustments for entry levels
end_adj : - Adjustments for stop levels
logScale : - calculate on log scale. Default is false
Returns: Start and end of consolidated PRZ range
get_projection_range(x, a, b, c, patternArray, errorPercent, start_adj, end_adj, logScale)
Provides Projection range based on BCD and XAD ranges
Parameters:
x : X coordinate value
a : A coordinate value
b : B coordinate value
c : C coordinate value
patternArray : Pattern flags for which PRZ range needs to be calculated
errorPercent : Error threshold
start_adj : - Adjustments for entry levels
end_adj : - Adjustments for stop levels
logScale : - calculate on log scale. Default is false
Returns: Array containing start and end ranges
isHarmonicPattern(x, a, b, c, d, flags, defaultEnabled, errorPercent, logScale)
Checks for harmonic patterns
Parameters:
x : X coordinate value
a : A coordinate value
b : B coordinate value
c : C coordinate value
d : D coordinate value
flags : flags to check patterns. Send empty array to enable all
defaultEnabled
errorPercent : Error threshold
logScale : - calculate on log scale. Default is false
Returns: Array of boolean values which says whether valid pattern exist and array of corresponding pattern names
isHarmonicProjection(x, a, b, c, flags, defaultEnabled, errorPercent, logScale)
Checks for harmonic pattern projection
Parameters:
x : X coordinate value
a : A coordinate value
b : B coordinate value
c : C coordinate value
flags : flags to check patterns. Send empty array to enable all
defaultEnabled
errorPercent : Error threshold
logScale : - calculate on log scale. Default is false
Returns: Array of boolean values which says whether valid pattern exist and array of corresponding pattern names.

Box-Cox Log BandsExperimental:
Uses the Box-Cox Transformer with a deflection on the inversion to create log bands.
to be used in log scaled charts.

LineGetPriceOnLogScaleLibrary "LineGetPriceOnLogScale"
This library provides a way to calculate the y-coordinate of a line on a specified bar when the chart scale is Log.
The built-in `line.get_price()` function only works with linear scale and gives incorrect results when the chart is in Log scale.
The library only works with `bar_index` values and `xloc.bar_index`-based lines, `time`-based lines will cause errors to appear.
coordGetPriceLog(x1, y1, x2, y2, xi) Calculates the y-coordinate on the specified bar on the logarithmic scale.
Only coordinates based on bar index are applicable, bar time will throw an error.
Parameters:
x1 : First X coordinate of a line, index of the bar where the line starts.
y1 : First Y coordinate of a line, price on the price scale.
x2 : Second X coordinate of a line, index of the bar where the line ends.
y2 : Second Y coordinate of a line, price on the price scale.
xi : Index of the bar for which the price should be calculated.
Returns: Price of the line on the bar specified in `xi`, on the logarithmic scale.
lineGetPriceLog(_line, xi) Calculates the y-coordinate on the specified bar for the logarithmic scale. Takes a line.
Only lines drawn based on `xloc.bar_index` are applicable, `xloc.bar_time` will throw and error.
Parameters:
_line : The line for which the price is calculated.
xi : Index of the bar for which the bar should calculate the price.
Returns: Price of the line on the bar specified in `xi`, on the logarithmic scale.

Log Scale Linear RegressionThis indicator is basically the standard linear regression but adjusted to be suitable for log scale.
You can use 2 different standard deviation values, choose the data source and lookback length.
The colors are chosen directly on the main menu.
Enjoy!

Bitcoin Logarithmic Growth Curves & ZonesI found this awesome script from @quantadelic and edited it to be a bit more legible for regular use, including coloured zones and removing the intercept / slope values as variables, to leave space for the fib levels in the indicator display. I hope you all like it.

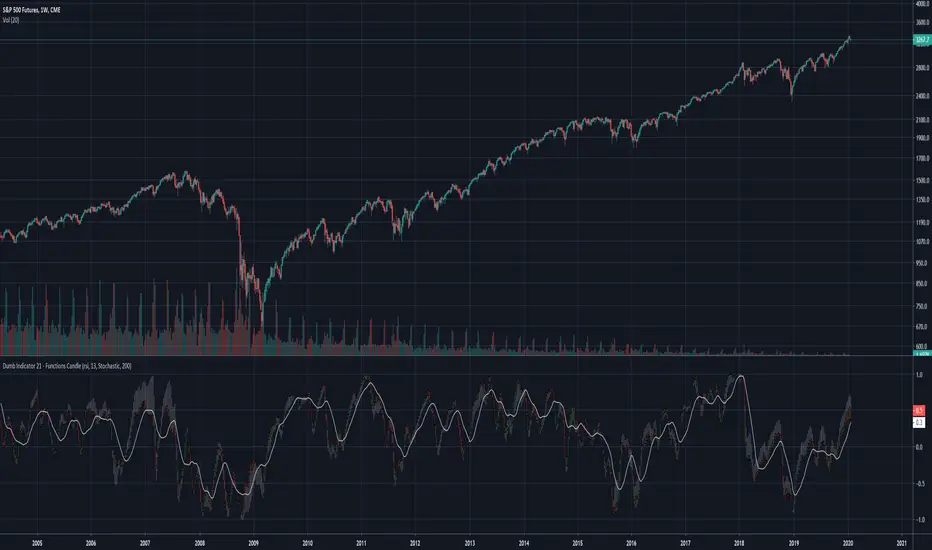
Dumb Indicator 21 - Function's Candlestick Bar's StyleThe idea is help traders to see the patterns and levels from a different point o view.
This script create candlestick using the opening, high, low and close price as source on your favorite function.
It's very simple to use:
Select a function in the drop box list, the number of bars length, check or uncheck the boxes to treat source as logarithm, smooth, and if you want to plot the SMA from the results.
To make a deeper analysis, you can select to plot the candles in Stochastic or in Percent Rank way.
The Stochastic and Percent Rank plot will show how far the price is close to highest or lowest value of the source from the last "Stochastic Length" number of bars.
Some functions with different names can plot the same results.
This indicator works on every kind of market, but you will need to find the best function and length to use.
Please, if you find anything good with this, share to everyone.
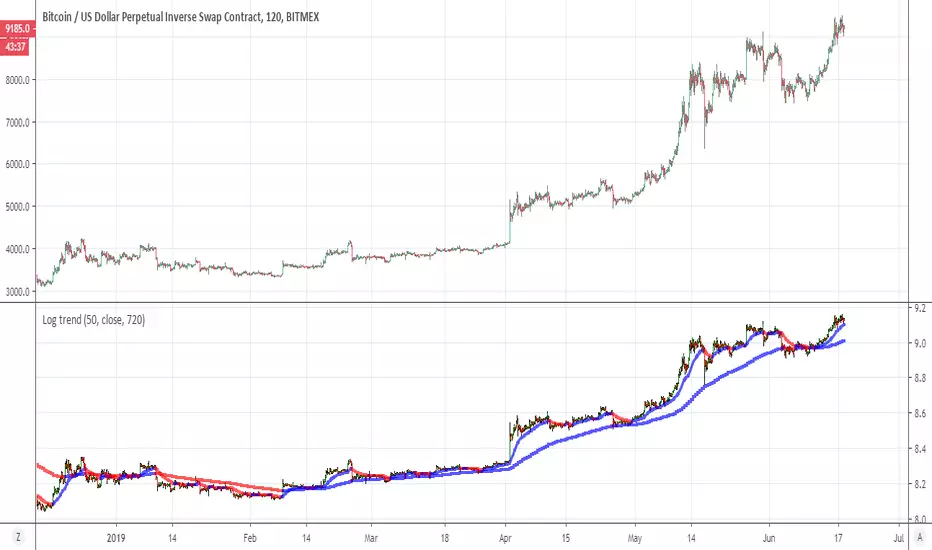
Log trendThis indicator give you the trend by log scale of the candels and the MA
blue line =bullish
red line =bearish
KAMA: Kaufman Adaptive Moving Average x2/LogCalculation begins at the beginning of the bar, eliminating incorrect moving average weighting at the very beginning of the ticker you're watching. This is important for new stocks, futures, altcoins, etc.
The inputs for the fast/slow alphas are now normal integers, with the calculation (2 / (y + 1)) for alpha added after input.
Comes with two moving averages and a setting for geometric mean/log. Source is adjustable but using the close works best, especially with how this particular MA is calculated in the first place. Besides that, this is mostly the same as other KAMAs on TradingView, but I'd like to say I put a bit more care into this one.
It is important to know that the acceptable length for KAMA is within the boundaries of the alpha lengths. For example, the default lengths are 2 and 30 for alpha, so the acceptable length for KAMA is within 2-30.
stockcharts.com
www.technicalindicators.net

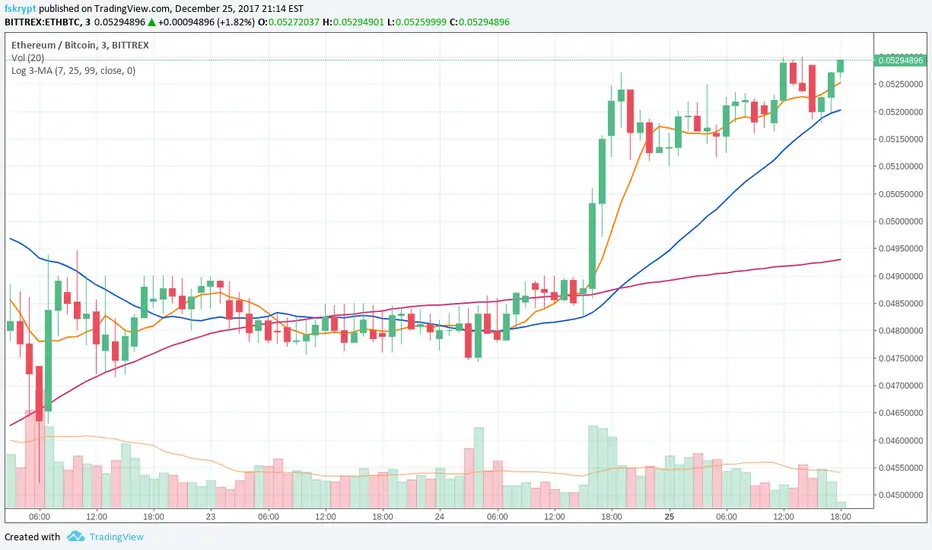
Relative Strength Index (Log/Divs/MTF/EMA)RSI calculated for log scale, with divergences labeled, as well as a 1 hour 55 EMA for signal.
Original log-space RSI by fskrypt.
Divergences taken from JustUncleL, originally from RicardoSantos.

Log MomentumJust like regular momentum indicator except calculated in log space and with a horizontal line centered at zero for easier analysis

Log-Space EMA Ribbon [Krypt]Similar to basic EMA Ribbon indicator except uses log-space transformation. Should be better on very long timeframes and for determining beginning of a bull market. The tradeoff is that it is slower than regular EMA near peaks (regular EMA will outperform this indicator when determining when to sell).

WaveTrend Oscillator (Dark Mode) [Krypt]My WaveTrend Oscillator indicator optimized for dark backgrounds. The light mode is available here:

Log-space Simple Moving Average (Set of 3)For convenience, bundles 3 moving averages at 50, 100, and 200

Triple Log-scale MA (Binance style)A combo of 3 MAs for traders who grew accustomed to using Binance MA settings
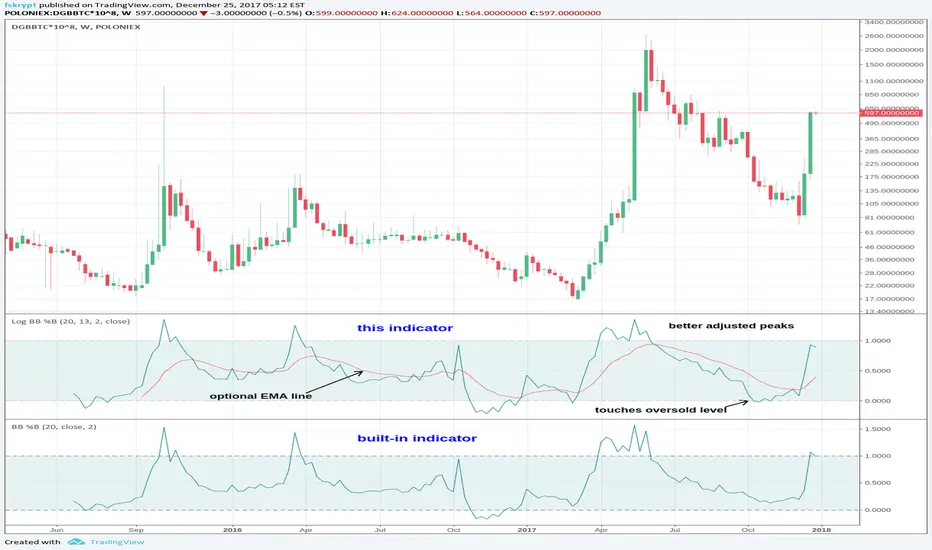
Log Bollinger Bands %BB Oscillator [Krypt]This indicator is almost identical to "Bollinger Bands %BB" except its calculations are performed in logspace and it adds an optional EMA line (after LazyBear's idea).
On Balance Volume (CCI-coded) [Krypt]This is a straightforward modification of LazyBear's CCI-coded OBV indicator with the following changes:
1) uses log-hl2 as source, which seems to be a more stable indicator of price change than close
2) adds optional price smoothing

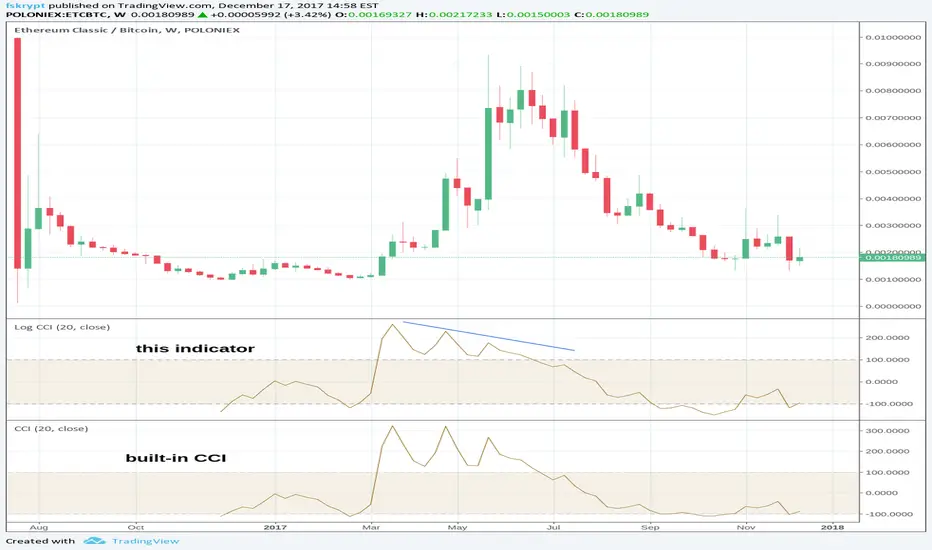
Log Commodity Channel IndexSame indicator as CCI except calculated in log-space. Expected to do better on high-volatility charts, and in some cases (illustrated with ETC-BTC) may provide earlier sell signal.