Indicator
Month
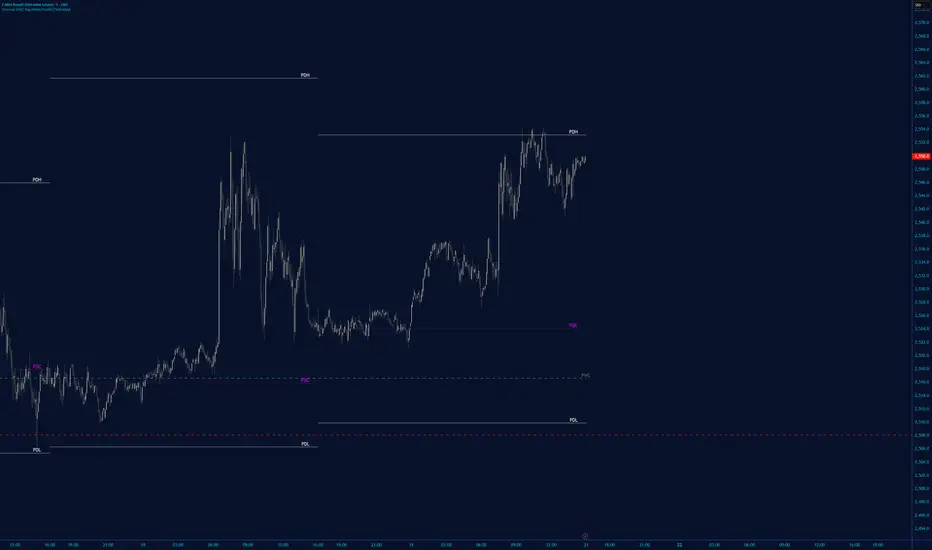
JL - DWM OHLCThis indicator plots the following price levels on your chart automatically AND will not show up if you are using a timeframe bigger than 60 minutes, 1 day, or 1 week.
Here are the price levels that are automatically plotted for you, and so you know the styling is different for Daily, Weekly, Monthly levels so you can easily distinguish between them:
- Prior Day: High / Low / Close
- Current Day: Open
- Prior Week: High / Low / Close
- Current Week: Open
- Prior Month: High / Low /
Indicator

Month of Year Performance█ OVERVIEW
The Month of Year Performance indicator is designed to visualize and compare the cumulative percentage change for each month of the year. By aggregating monthly returns, it helps uncover seasonal trends and potential anomalies in financial markets.
In financial analysis, a calendar based anomaly refers to recurring patterns or tendencies associated with specific time periods, such as days of the week. By calculating the cumulative percentage change for each month (January throug
Indicator

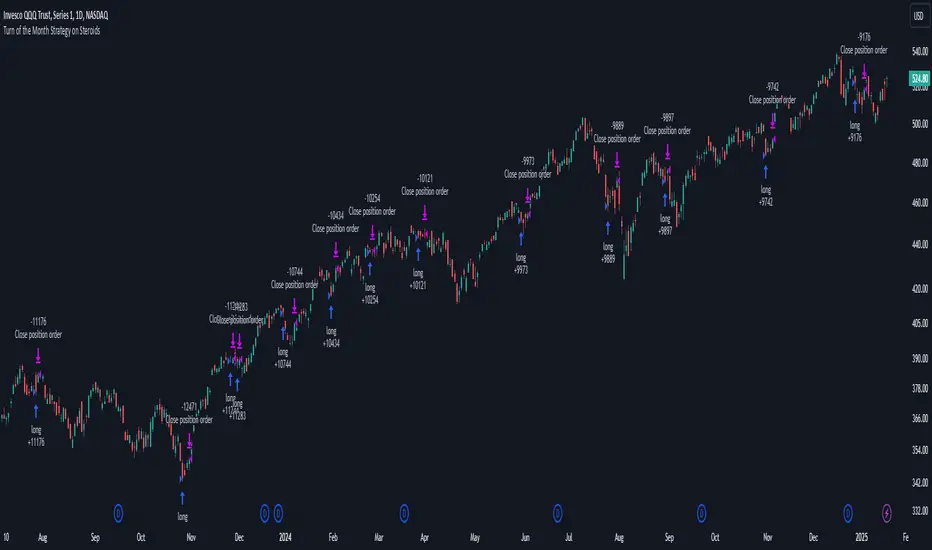
Turn of the Month Strategy on Steroids█ STRATEGY DESCRIPTION
The "Turn of the Month Strategy on Steroids" is a seasonal mean-reversion strategy designed to capitalize on price movements around the end of the month. It enters a long position when specific conditions are met and exits when the Relative Strength Index (RSI) indicates overbought conditions. This strategy is optimized for use on daily or higher timeframes.
█ WHAT IS THE TURN OF THE MONTH EFFECT?
The Turn of the Month effect refers to the observed tendency of stock p
Strategy
Weekly Stacked Daily Changes [LuxAlgo]The Weekly Stacked Daily Changes tool allows traders to compare daily net price changes for each day of the week, stacked by week. It provides a very convenient way to compare daily and weekly volatility at the same time.
🔶 USAGE
The tool requires no configuration and works perfectly out of the box, displaying the net price change for each day of the week as stacked boxes of the appropriate size.
Traders can adjust the width of the columns and the spacing between days and weeks, optio
Indicator

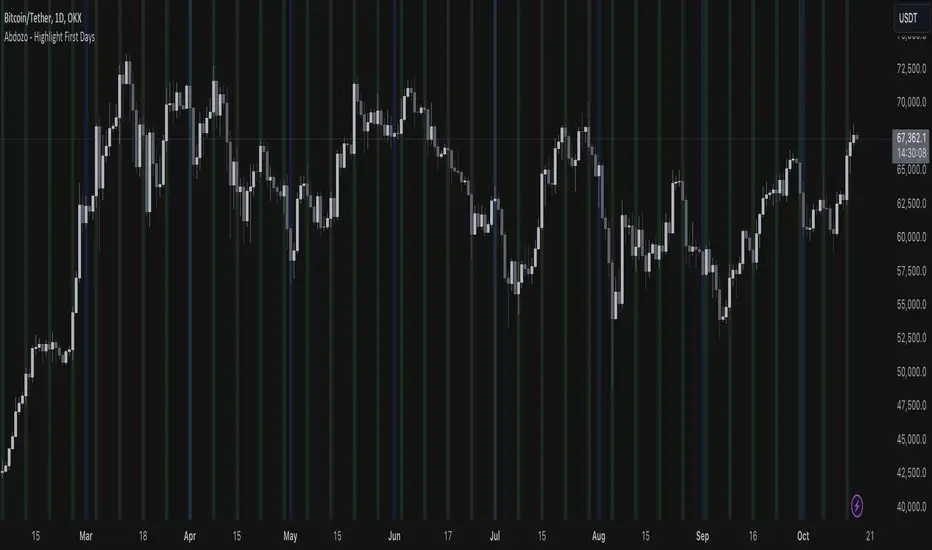
Abdozo - Highlight First DaysAbdozo - Highlight First Days Indicator
This Pine Script indicator helps traders easily identify key timeframes by highlighting the first trading day of the week and the first day of the month. It provides visual markers directly on your chart, helping you stay aware of potential market trends and turning points.
Features:
- Highlight First Day of the Week (Monday): Automatically marks Mondays to help you track weekly market cycles.
- Highlight First Day of the Month: Spot the start of e
Indicator
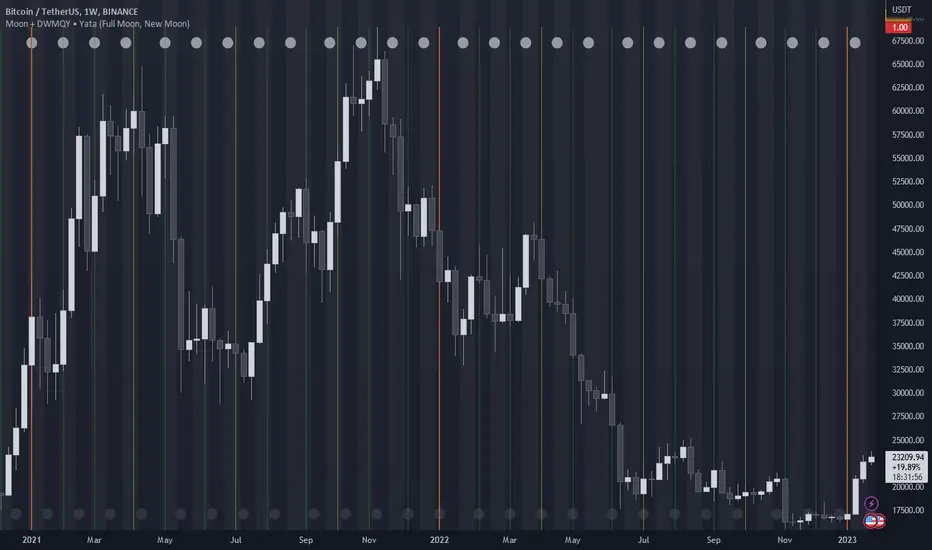
Moon Phases + Daily, Weekly, Monthly, Quarterly & Yearly Breaks█ Moon Phases
From LuxAlgo description.
Trading moon phases has become quite popular among traders, believing that there exists a relationship between moon phases and market movements.
This strategy is based on an estimate of moon phases with the possibility to use different methods to determine long/short positions based on moon phases.
Note that we assume moon phases are perfectly periodic with a cycle of 29.530588853 days (which is not realistically the case), as such there exists a di
Indicator
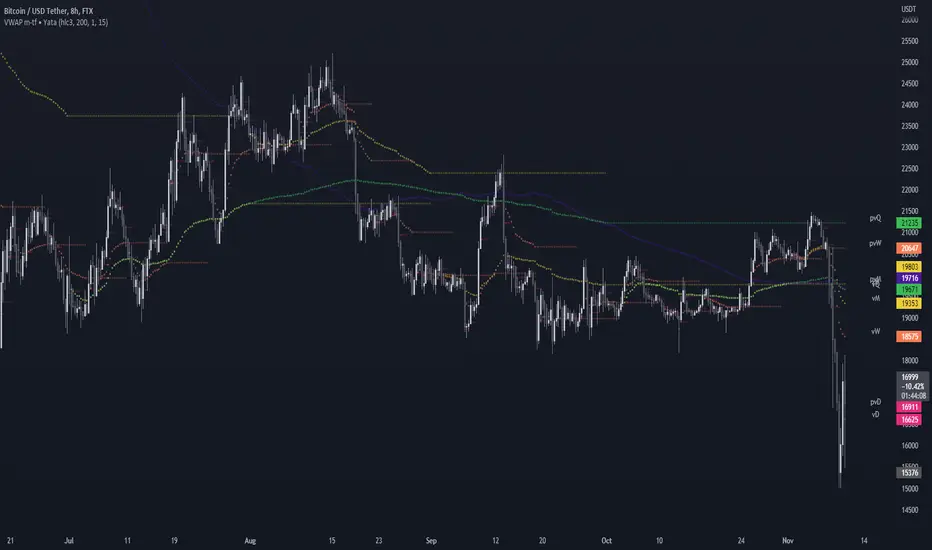
VWAP & Previous VWAP - MTF█ Volume Weighted Average Price & Previous Volume Weighted Average Price - Multi Timeframe
This script can display the daily, weekly, monthly, quarterly, yearly and rolling VWAP but also the previous ones.
█ Volume Weighted Average Price (VWAP)
The VWAP is a technical analysis tool used to measure the average price weighted by volume.
VWAP is typically used with intraday charts as a way to determine the general direction of intraday prices.
VWAP is similar to a moving average in that when
Indicator
DateNow█ OVERVIEW
Library "DateNow"
TODO: Provide today's date based on UNIX time
█ INSPIRATIONS
Use pinescript v4 functions such as year(), month() and dayofmonth().
Use pinescript v5 function such as switch.
Export as string variables.
Not using any match function such as math.floor.
█ CREDITS
RicardoSantos
█ KNOWN ISSUES
Date for Day display incorrectly by shortage 1 value especially Year equal to or before 1984
Timezone issue. Example : I using GMT+8 for my timezone, try
Library

200DMA last DOM - ajhImplements and backtests a simple 200 day moving average trend following rules based on last day of month to limits trades to 12 per year.
From the book : 5 BEST Moving Average Strategies (That beat buy and hold) by Steve Burns and Holly Burns
Click on the cog to set the input date range eg; 2000-01-01 to 2016-12-31
The book back tested SP500 returns from 2000-2016 317% using this method vs 125% buy and hold only with less drawdown.
Simple 200 day moving average test and trading on las
Strategy

First Week Trend [MX]I created this indicator based on one of my ways of analyzing the BTC trend in particular, I noticed that the break of the first weekly candle usually indicates the trend for the rest of the month.
This indicator has a bug in which if you change the timeframe of the indicator it will show erroneous values
If you use the candlestick chart, you will need to pull the visual order of this indicator to the top to overlay the colors of the standard candles, or simply hide the standard candles
the t
Indicator

Month/week breaksThe big brother of Month-breaks indicator that shows vertical lines for "week breaks" as well. As always I try to make it non-intrusive but you can change the colors/lines in Settings.
Indicator
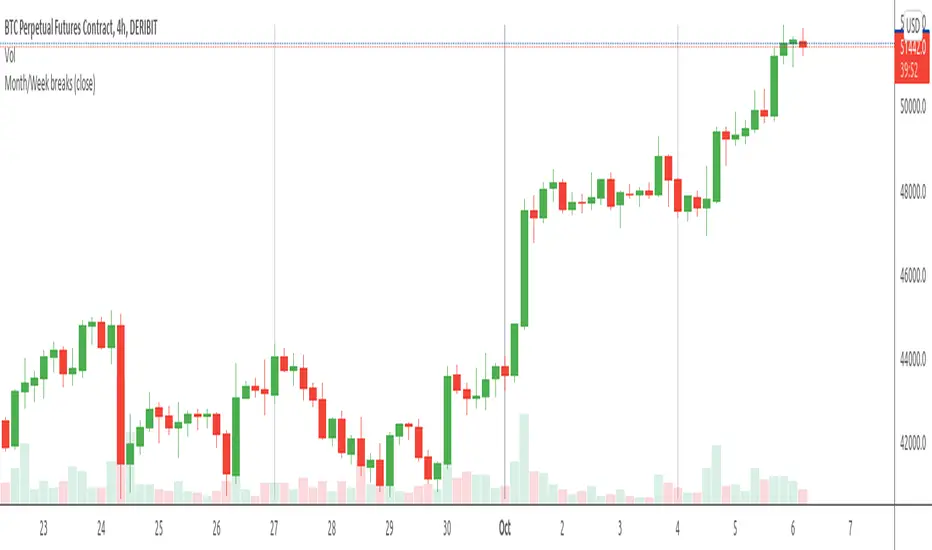
Month breaksA very simple indicator that marks the start of every month with a vertical line. But default the vertical line is gray with 80% transparency but you can customize the style/color/transparency as you like.
I hate crowded charts, bloated with all kind of crazy shapes and I created this indicator for two main reasons:
1. beginning/end of the month is an excellent pivot-point
2. to be simple, easy to customize and non-intrusive with the underlying chart
See the attached EURUSD daily chart, at t
Indicator

Indicator

Indicator
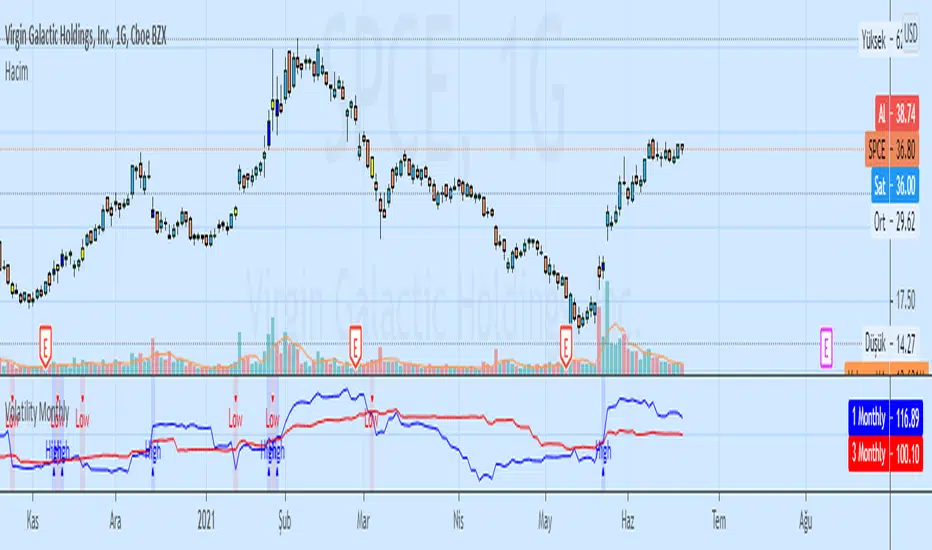
Seasonality (advanced)Script show up to 7 previous values of 'source' input for a specified period of days. Use inputs to select period: 365 (approximately) for years, or any other period (1, 7, 30, 90...). You can hide extra plots, customize their colors, apply this to another indicator or enable 'trackprice'.
On showcase:
Top indicator shows a close price for previous 3 years, and curent year
Bottom: a volume ma for previous years.
Indicator

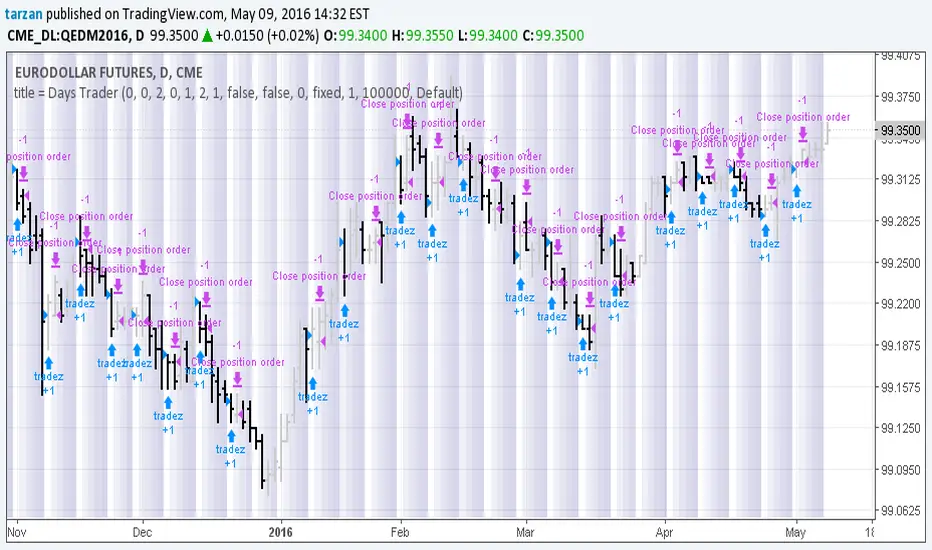
Days Trader 1.0Simple program to look for day of week or day of month patterns in chart data.
All original work by Boffin Hollow Lab
Author: Tarzan
Strategy