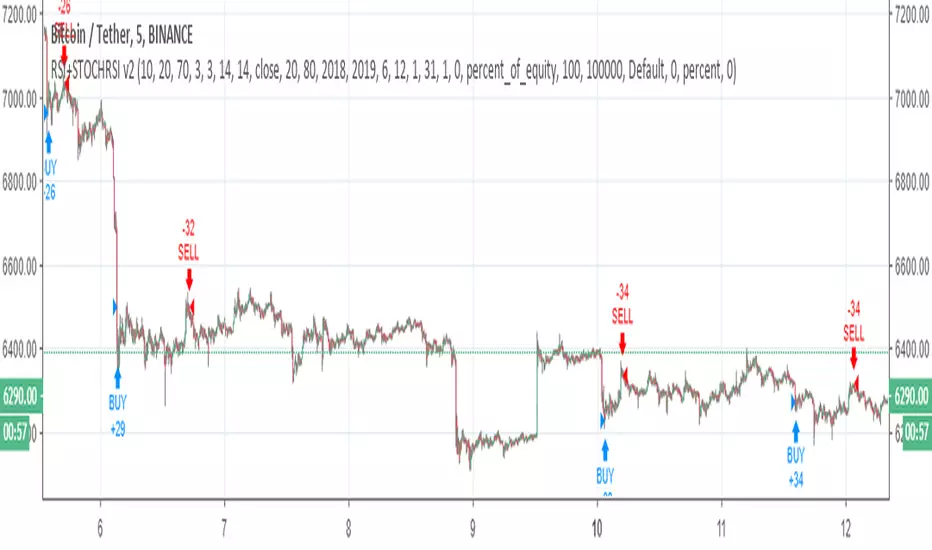
RSI+STOCHRSI v2RSI + STOCHASTIC RSI combination v2 ( for v1 )
For 5 min
Changes
Stcoh RSI creates signal with crossover
RSI created signal with an equation ( above or below the line) ,crossover was added.
Oscillators
MTF stochastic strategyThis strategy is based on MTF strategy found on Forex Factory forum and published by bobby2 (credits to him).
This is quite simple but need improvement to work properly:
1- it is made for 5 min chart
2- when 15min stochastic cross above 50 and 5min stochastic is rising, buy
3- when 15min stochastic cross below 50 and 5min stochastic is falling, sell

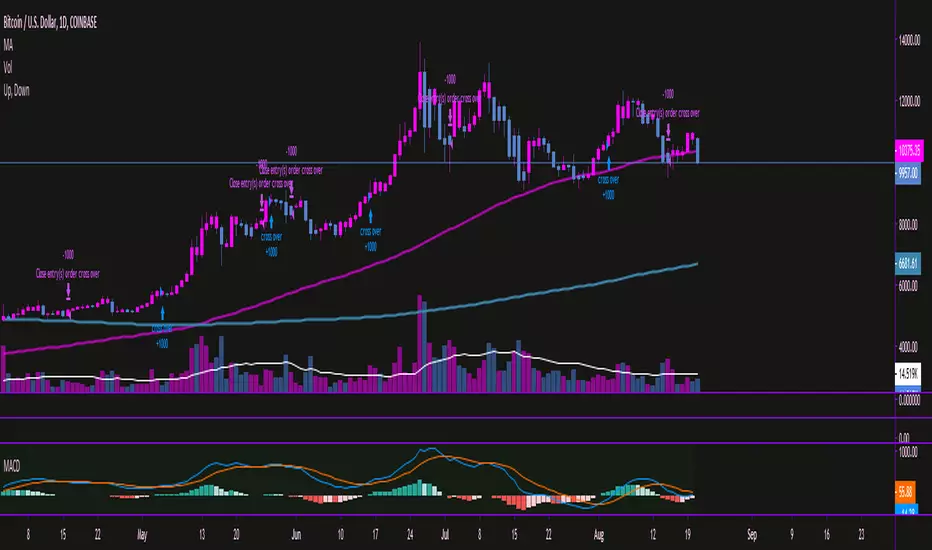
Moving Average Convergence/Divergence MaCD BackestingMade this to backtest simple macd trading strategy, had to set it to open long and short positions because i'm not sure how you get it to calculate otherwise.
RSI+STOCHRSI StrategyRSI + STOCHASTIC RSI combination . It is useful for 5 min charts .
Profitable in EOS/BTC and BTC/USDT , don't apply all cryptocurrency.

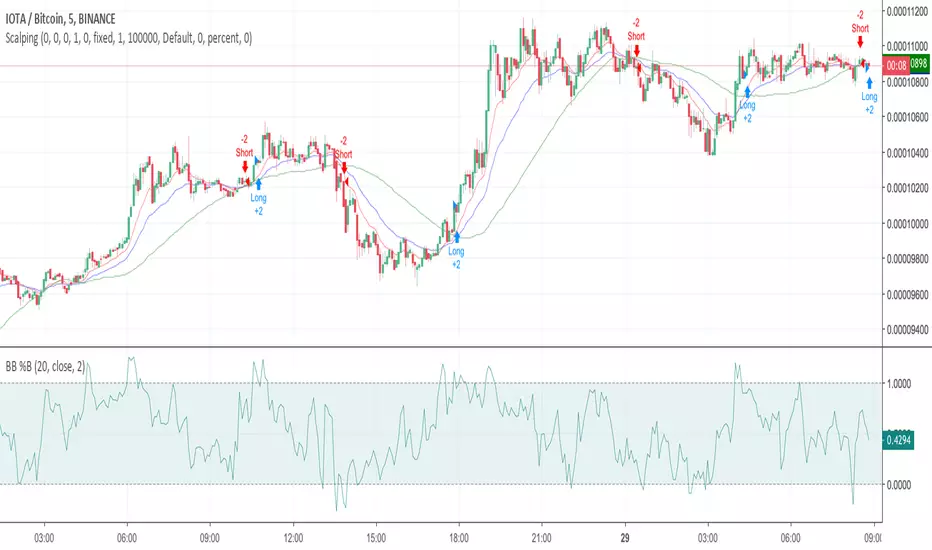
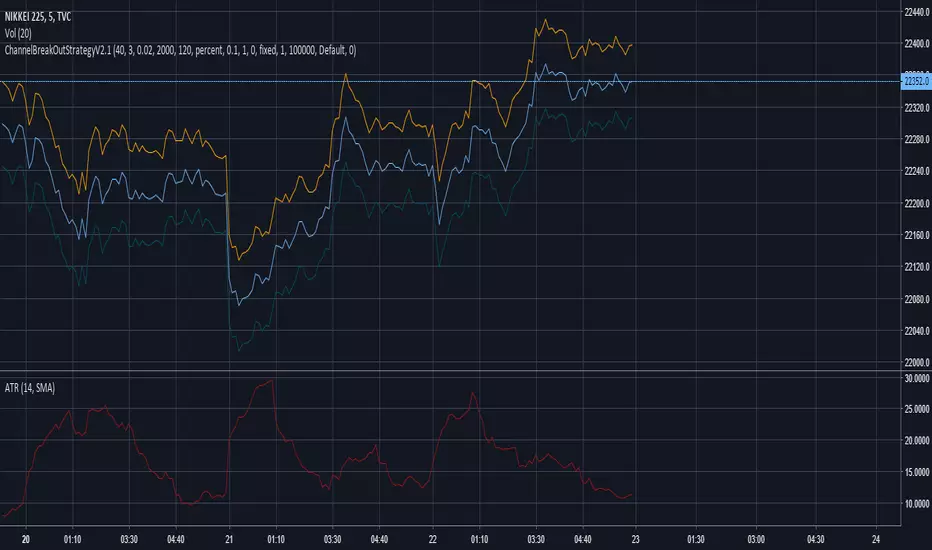
ChannelBreakOutStrategyV2.1This is the basic strategy that uses the price breakout of BollingerBands.
BB%/MFI/RSIThe indicator was made by a bear. I have made strategy which uses this indicator.
For any pair.

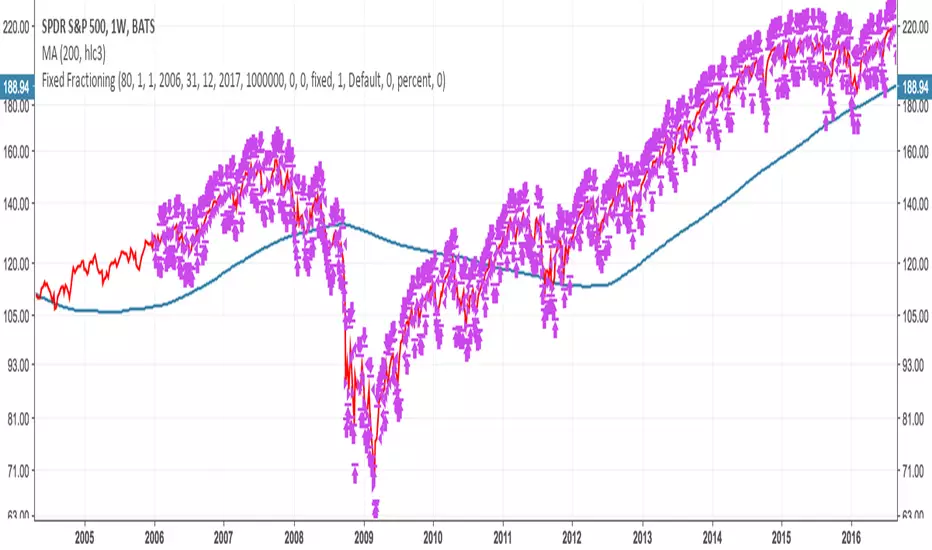
basic fixed fraction strategyOne of the most common trading strategy is to invest a certain percentage in an asset, and keep the percentage fixed. For example you invest 2% in a stock, and as the value goes up you sell. And as the value goes down you buy. Always trying to keep the value of how much you have invested in that asset at 2%.
This works very well with assets that are stable. If you have something that fluctuates around a value, you will find yourself that each time it has gone back to the value in which you entered, you have actually gained something. With an asset that grows it also works. But in general you might find that more aggressive investments are more profitable. On the other side if there is a bubble, and you invest from the beginning using this strategy you will find yourself at the end of the bubble having gained something. Not as much as having bought all at the beginning and having sold all at the end, but still you will have sold going up, and bought going down. Plus you will have gained in the fluctuation.
Where is instead very dangerous is in stock and assets that go to zero. This because you might invest just 2% in an investment. But then as the strategy works you keep investing more as you are trying to keep 2%. You basically can lose all your money in this way (like if you were invested 100% in an asset). Very dangerous. This is why you should only use this with assets that you are sure cannot go to zero (an ETF on S & P 500 could be a good example).
So I coded this strategy on TradingView. basically it will ask you what percentage you want to invest. Then starts with entering with an order of that amount, and will then keep sitself at the same percentage. The system is discrete, as it can only buy a discrete number of contract.
Note that if you use this for cryptocurrency (where you can buy a fraction of a coin, like 0.01 btc) then you should multiply the money that you have by 10, 100, 1000 ... depending on how many digits after the comma your exchange permit you to trade.
If you are using this for forex or crypto it is quite easy that the number of order will explode. As such I added the date range taken from Allanster great script
One way to use Fixed Fractioning is to calculate the Kelly Index of an asset (which will give you a percentage), and then invest half or a quarter of the kelly in that coin, and then keep this fixed.
Another way (which goes well beyond what this script can do alone) to use the Fixed Fractioning is, if you have two assets that are anticorrelated (has a negative correlation), then investing a certain percentage of your capital in one and another percentage in another. And then each time one goes up (and the other goes down) you sell the one that is going up, and buy the one that is going down to keep the percentages fixed.
Something else, it is pretty common for people to invest around 80% of their money in an ETF that follows tha S&P500. This is why here we use 80%. Generally I have seen a more common investment strategy to be around 2%.
As everybody says: I am not responsible for your money. Study before investing.
Ehlers-Smoothed Stochastic RSI StrategyI have been asked by several people for a Strategy based on the ES Stoch RSI Alert so here it is. The strategy has an adjustable backtest date range so that you can adjust the test time period to whatever you like. This strategy is based on a script by fskrypt.


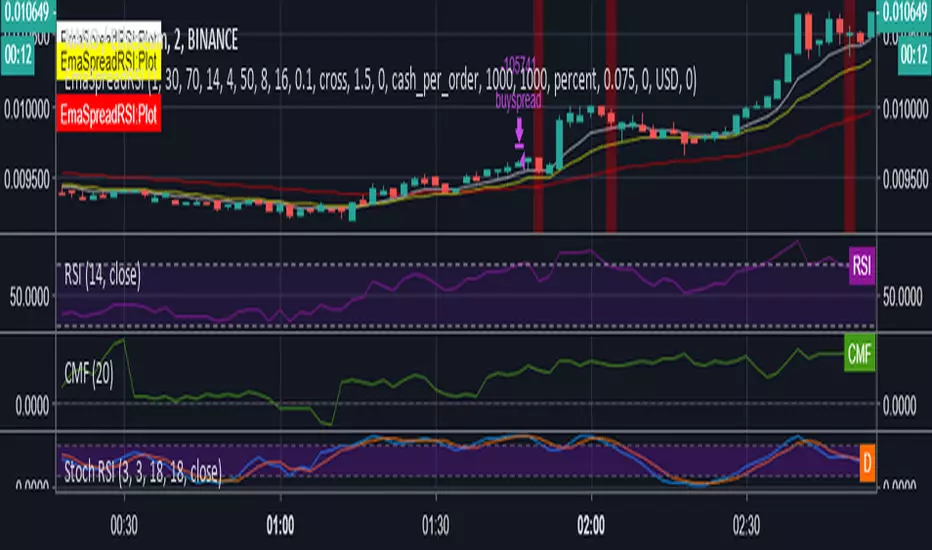
Percent difference between price and MA Backtest Percent difference between price and MA
You can change long to short in the Input Settings
WARNING:
- For purpose educate only
- This script to change bars colors.

Awesome Oscillator.MMouse_Lager_BCEAwesome Oscillator with added options for turning short trades on and off, as well as a start date for backtesting.

14/28 Day SMA Divergence and RSI - No RepaintIf you are interested in purchasing my algorithmic trading bot that receives Tradingview indicator alerts via email and then executes them in Bittrex, please visit my product page here: ilikestocks.com Additionally, I would love to create video/blog guides on creating Tradingview scripts or strategies. If you are a knowledgeable in finance or other related fields and would like to be featured on my page, please contact me at tanner@ilikestocks.com.
No crossovers were used in this script, and this is likely the reason for the no repaint(Correct me if wrong).
This strategy script uses a 14-day SMA signal line, a 28-day SMA and RSI. The strategy works by determining whether the (14-day SMA is above the 28-day SMA and the RSI levels are overbought(below 30)) or RSI is very overbought(below 13 or so). Once either of these conditions have been met, a long position is opened.
The initial long position must be partially closed by the take profit first and then the final close is executed if the 14-day signal SMA is below the 28-day SMA; you may also exclusively use take profit to close positions.
The green plotted spikes are the initial long position conditions. The orange plotted spikes are take profit signals once a long position is opened. The red plotted spikes are plotted when the SMA 14-day is below the 28-day SMA.
Please do leave constructive criticism or comments below because it helps me better create scripts!
