LANZ Strategy 4.0 [Backtest]🔷 LANZ Strategy 4.0 — Strategy Execution Based on Confirmed Structure + Risk-Based SL/TP
LANZ Strategy 4.0 is the official backtesting engine for the LANZ Strategy 4.0 trading logic. It simulates real-time executions based on breakout of Strong/Weak Highs or Lows, using a consistent structural system with SL/TP dynamically calculated per trade. With integrated risk management and lot size logic, this script allows traders to validate LANZ Strategy 4.0 performance with real strategy metrics.
🧠 Core Components:
Confirmed Breakout Entries: Trades are executed only when price breaks the most recent structural level (Strong High or Strong Low), detected using swing pivots.
Dynamic SL and TP Logic: SL is placed below/above the breakout point with a customizable buffer. TP is defined using a fixed Risk-Reward (RR) ratio.
Capital-Based Risk Management: Lot size is calculated based on account equity, SL distance, and pip value (e.g. $10 per pip on XAUUSD).
Clean and Controlled Executions: Only one trade is active at a time. No new entries are allowed until the current position is closed.
📊 Visual Features:
Automatic plotting of Entry, SL, and TP levels.
Full control of swing sensitivity (swingLength) and SL buffer.
SL and TP lines extend visually for clarity of trade risk and reward zones.
⚙️ How It Works:
Detects pivots and classifies trend direction.
Waits for breakout above Strong High (BUY) or below Strong Low (SELL).
Calculates dynamic SL and TP based on buffer and RR.
Computes trade size automatically based on risk per trade %.
Executes entry and manages exits via strategy engine.
📝 Notes:
Ideal for evaluating the LANZ Strategy 4.0 logic over historical data.
Must be paired with the original indicator (LANZ Strategy 4.0) for live trading.
Best used on assets with clear structural behavior (gold, indices, FX).
📌 Credits:
Backtest engine developed by LANZ based on the official rules of LANZ Strategy 4.0. This script ensures visual and logical consistency between live charting and backtesting simulations.
Indicators and strategies

5m Scalping mit EMA Cross & S/R Zonen📋 Strategy Description – 5m Scalping with EMA Cross & S/R Zones
This TradingView strategy is aimed at short-term traders (scalpers) who trade on the 5-minute chart. It combines two proven techniques:
🔧 Strategy components
EMA Crossover Signals
Two exponential moving averages (EMAs) are calculated:
Fast EMA (default: 9)
Slow EMA (default: 21)
A long signal is created when the fast EMA crosses the slow EMA from bottom to top.
A short signal is created when the fast EMA crosses the slow EMA from top to bottom.
Pivot-based Support & Resistance Zones
Pivot highs and pivot lows are detected (default length: 10 bars).
From this, resistance (red) and support zones (green) are automatically drawn as horizontal lines.
A maximum of 5 S/R lines are displayed at the same time.
Risk management
A percentage stop loss (default: 0.5%) and take profit (default: 1.0%) are set for each position.
Positions Size: 10% of the account value (adjustable). 📈 Visualization The EMAs are displayed as colored lines (Orange = Fast, Blue = Slow). Signals appear as arrows (Green = Long, Red = Short). S/R zones help in categorizing the price structure.

⚡ VWT-AI Trend Strategy | Pro Edition⚡ VWT-AI Trend Strategy | Pro Edition
Smart AI-Driven Momentum & Volume Confluence System
🧠 Generated by PineScriptsAI — optimized by machine, tested by humans.
🧠 What is it?
The VWT-AI Pro Edition is a high-performance trend strategy built using AI-assisted Pine Script generation. It combines proven institutional logic with smart filtering to catch clean, high-conviction trades only during optimal market conditions.
Created using a PineScript AI engine, this strategy is optimized for:
✨ High profit factor
🛡 Low drawdown
📊 Superior trend accuracy
🚀 Strategy Components
VWAP Bias: Ensures trades align with market structure
RSI Slope Filter: Momentum confirmation
MACD Cross: Trend validation
Custom ADX (> 20): Filters out sideways/choppy zones
Volume Spike Detection: Identifies accumulation/distribution
Dynamic Trailing Stop: Profit preservation system
✅ Performance Snapshot (AAPL 45m example)
| Metric | Result |
| ---------------- | ---------------------- |
| 💰 Total P\&L | +419,808.79 USD |
| 📊 Profit Factor | 25.76 |
| 📈 Win Rate | 99.08% (1286/1298) |
| 🔻 Max Drawdown | 0.30% |
| ⚙️ Trade Count | 1298 trades |
🧪 Best for:
* Crypto (BTC, ETH, SOL)
* Stocks (AAPL, TSLA, SPY)
* Indices & Forex (1H or higher)
* Swing and intraday setups
🛠 Customizable Inputs:
* ✅ RSI slope filter
* ✅ VWAP source
* ✅ MACD smoothing
* ✅ Volume surge threshold
* ✅ Trailing stop percent
* ✅ Live dashboard UI toggle
🤖 About the AI:
This strategy was generated and refined by PineScriptsAI, an advanced system that turns trading logic and best practices into clean, modular Pine Script code. It’s part of a broader initiative to make algorithmic trading accessible to non-coders.
🙌 Final Notes:
Use in combination with higher-timeframe bias or news filters for maximum impact. Strategy performance varies by asset — optimize settings accordingly.
If this strategy helps you, please like, comment, or follow.
For custom scripts or automated tools, feel free to reach out.

Lucy XAU/USD – EMA Scalping Strategy (5m Optimized) Lucy – EMA Scalping Strategy
🎯 Purpose
“Lucy” is a high-probability scalping strategy that combines momentum, trend alignment, and time-based filtering to generate clean entry signals for fast-moving assets like Gold.
⚙️ Core Components of the Strategy
1. EMA Cross Entry (Momentum Trigger)
Fast EMA (8) and Slow EMA (34) are used to catch short-term momentum.
A bullish crossover (8 EMA crosses above 34 EMA) = Long signal.
A bearish crossunder (8 EMA below 34 EMA) = Short signal.
This is the core trigger for entries.
2. Trend Filter with 200 MA
Trades are only taken in the direction of the larger trend.
Longs only if price > 200 MA (uptrend).
Shorts only if price < 200 MA (downtrend).
This ensures you're not fighting the macro trend — critical for scalping volatile markets like Gold.
3. Time Filter (Trading Session Control)
Trades are only allowed between 9:00 UTC and 14:00 UTC (by default).
This window is commonly aligned with London and New York overlap, where Gold tends to move most actively.
✅ You can customize these hours to match your trading session.
4. ATR-Based Stop Loss and Take Profit
Stop Loss = 1.5 × ATR
Take Profit = 2.5 × ATR
Why ATR? Because it adapts to current volatility. Gold's volatility shifts, and ATR gives dynamically scaled exits.
5. Signals and Alerts
Entry signals are marked with arrows:
🟢 Triangle Up = Long entry
🔴 Triangle Down = Short entry
Alerts can be triggered (popup, webhook, mobile) when:
A long or short setup occurs within the session window.
✅ How It Works (Flow Summary)
Condition Result
8 EMA crosses 34 EMA Entry trigger
Price above/below 200 MA Directional filter
Current time within 9–14 UTC Time filter passes
Entry triggered → SL/TP based on ATR Trade managed
🔍 Example Use Case (Gold Scalping)
You load the 5-minute XAU/USD chart.
Lucy shows a green triangle at 9:45 UTC — 8 EMA crossed up, price above 200 MA, and within session.
You auto or manually execute a long.
SL and TP are calculated based on current ATR (e.g., if ATR = $1.50, SL = $2.25, TP = $3.75).
If price hits TP, you exit profitably. If SL is hit, you control your loss size.
📈 Who Is This Strategy For?
Scalpers trading Gold, NASDAQ, or Crypto on 1m–15m charts.
Traders who prefer simple, rule-based entries with automatic filtering.
Anyone wanting to run backtests or build a bot-ready strategy on TradingView.
🛠️ Want to Expand It?
You can easily upgrade Lucy with:
✅ Volume Spike Filter – Confirm trades only when volume supports them.
✅ Multi-Timeframe Confirmation – e.g., only trade if 1H trend matches.
✅ Webhook Alerts – Automate execution via a trading bot like 3Commas, TradingView Alerts to MT4/MT5, etc.

Random State Machine Strategy📌 Random State Machine Strategy (Educational)
This strategy showcases a randomized entry model driven by a finite state machine, integrated with user-defined exit controls and a full-featured moving average filter.
🧠 Trade Entry Logic
Entries occur only when:
A random trigger occurs (~5% probability per bar)
The state machine accepts a new transition (sm.step())
Price is:
Above the selected MA for long entries
Below the selected MA for short entries
This ensures that entries are both stochastically driven and trend-aligned, avoiding frequent or arbitrary trades.
⚙️ How It Works
Randomized Triggers
A pseudo-random generator (seeded with time and volume) attempts to trigger state transitions.
Finite State Machine
Transitions are managed using the StateMachine from robbatt/lib_statemachine — credit to @robbatt for the modular FSM design.
Controlled Reset
The state machine resets every N bars (default: 100) if at least two transitions have occurred. This prevents stale or locked states.
Backtest Range
Define a specific test window using Start and End Date inputs.
Risk & Exits
Specify risk in points and a target risk/reward ratio. TP is auto-computed. Timed and MA-based exits can be toggled.
🧪 How to Use
Enable Long or Short trades
Choose your Moving Average type and length
Set Risk per trade and R/R ratio
Toggle TP/SL, timed exit, or MA cross exit
Adjust the State Reset Interval to suit your signal frequency
📘 Notes
Educational use only — not financial advice
Random logic is used to model structure, not predict movement
Thanks to @robbatt for the lib_statemachine integration

Quant Trading Zero Lag Trend Signals (MTF) Strategy🧠 Strategy Overview
The Quant Trading Zero Lag Trend Signals (MTF) Strategy is a high-precision, multi-timeframe trend-following system designed for traders seeking early trend entries and intelligent exits. Built around ZLEMA-based signal detection, it includes dynamic risk management features. Based on the original indicator Zero Lag Trend Signals (MTF) from AlgoAlpha, now built as a strategy with several improvements for Exit Criteria include RR, ATR Stop Loss, Trailing stop loss, etc. See below.
🔍 Key Components
1️⃣ ZLEMA Trend Engine
ZLEMA (Zero-Lag EMA) forms the foundation of the trend signal system.
Detects bullish and bearish momentum by analyzing price action crossing custom ZLEMA bands.
Optional confirmation using 5-bar ZLEMA slope filters (up/down trends) ensures high-conviction entries.
2️⃣ Volatility-Based Signal Bands
Dynamic bands are calculated using ATR (volatility) stretched over 3× period length.
These bands define entry zones (outside the bands) and trend strength.
Price crossing above/below the bands triggers trend change detection.
3️⃣ Entry Logic
Primary long entries occur when price crosses above the upper ZLEMA band.
Short entries (optional) trigger on downside cross under the lower band.
Re-entry logic allows continuation trades during strong trends.
Filters include date range, ZLEMA confirmation, and previous position state.
4️⃣ Exit Logic & Risk Management
Supports multiple customizable exit mechanisms:
🔺 Stop-Loss & Take-Profit
ATR-Based SL/TP: Uses ATR multipliers to dynamically set levels based on volatility.
Fixed Risk-Reward TP: Targets profit based on predefined RR ratios.
Break-Even Logic: Automatically moves SL to entry once a threshold RR is hit.
EMA Exit: Optional trailing exit based on price vs. short EMA.
🔀 Trailing Stop
Follows price action using a trailing ATR-based buffer that tightens with trend movement.
🔁 Trend-Based Exit
Automatically closes positions when the detected trend reverses.
5️⃣ Multi-Option Trade Filtering
Enable/disable short trades, ZLEMA confirmations, re-entries, etc.
Time-based backtesting filters for isolating performance within custom periods.
6️⃣ Visual Feedback & Annotations
Trend shading overlays: Green for bullish, red for bearish zones.
Up/Down triangle markers show when ZLEMA is rising/falling for 5 bars.
Stop-loss, TP, trailing lines drawn dynamically on the chart.
Floating stats table displays live performance (PnL, win %, GOA, drawdown, etc.).
Trade log labels annotate closed trades with entry/exit, duration, and reason.
7️⃣ CSV Export Integration
Seamless export of trade data including:
Entry/exit prices
Bars held
Encoded exit reasons
Enables post-processing or integration with external optimizers.
⚙️ Configurable Parameters
All key elements are customizable:
Entry band length and multiplier
ATR lengths, multipliers, TP/SL, trailing stop, break-even
Profit target RR ratio
Toggle switches for confirmations, trade types, and exit methods

MACD + RSI + EMA + BB + ATR Day Trading StrategyEntry Conditions and Signals
The strategy implements a multi-layered filtering approach to entry conditions, requiring alignment across technical indicators, timeframes, and market conditions .
Long Entry Requirements
Trend Filter: Fast EMA (9) must be above Slow EMA (21), price must be above Fast EMA, and higher timeframe must confirm uptrend
MACD Signal: MACD line crosses above signal line, indicating increasing bullish momentum
RSI Condition: RSI below 70 (not overbought) but above 40 (showing momentum)
Volume & Volatility: Current volume exceeds 1.2x 20-period average and ATR shows sufficient market movement
Time Filter: Trading occurs during optimal hours (9:30-11:30 AM ET) when market volatility is typically highest
Exit Strategies
The strategy employs multiple exit mechanisms to adapt to changing market conditions and protect profits :
Stop Loss Management
Initial Stop: Placed at 2.0x ATR from entry price, adapting to current market volatility
Trailing Stop: 1.5x ATR trailing stop that moves up (for longs) or down (for shorts) as price moves favorably
Time-Based Exits: All positions closed by end of trading day (4:00 PM ET) to avoid overnight risk
Best Practices for Implementation
Settings
Chart Setup: 5-minute timeframe for execution with 15-minute chart for trend confirmation
Session Times: Focus on 9:30-11:30 AM ET trading for highest volatility and opportunity

Strategy Builder With IndicatorsThis strategy script is designed for traders who enjoy building systems using multiple indicators.
Please note: This script does not include any built-in indicators. Instead, it works by referencing the plot outputs of the indicators you’ve already added to your chart.
For example, if you add a MACD and an ATR indicator to your chart, you can assign their plot values as inputs in the settings panel of this strategy.
• MACD as a trigger
• ATR as a filter
How Filters Work
Filters check whether certain conditions are met before a trade can be opened. For instance, if you set a filter like ATR > 30, then no trade will be executed unless that condition is true — even if the trigger fires.
All filters are linked, meaning every active filter must be satisfied for a trade to occur.
How Triggers Work
Triggers are what actually fire a trade signal — such as a moving average crossover or RSI breaking above a specific level. Unlike filters, triggers are independent. Only one active trigger needs to be true for the trade to execute.
Thanks to its modular structure, this strategy can be used with any indicator of your choice.
⸻
Risk Management Features
In the settings, you’ll find flexible options for:
• Stop Loss (SL)
• Trailing Stop Loss (TSL)
• Multi Take-Profit (TP)
These features enhance trade safety and let you tailor your risk management.
SL types available:
• Tick-based SL
• Percent-based SL
• ATR-based SL
Once you select your preferred SL type, you can fine-tune its distance using the offset field.
Trailing SL allows your stop to follow price as it moves in your favor — helping to lock in profits.
Multi-TP lets you take profits at two different levels, helping you secure gains while leaving room for extended moves.
Breakeven option is also available to automatically move your SL to entry after reaching a profit threshold.
⸻
How to Build a Solid Strategy
Let’s break down a good setup into three key components:
1. Trend Filter
Avoid trading against the trend — that’s like swimming against the current.
Use a filter like:
• Supertrend
• Momentum indicators
• Candlestick bias, etc.
Example: In this case, I used Supertrend and filtered for trades only if the price is above the uptrend line.
2. Trigger Condition
Once we confirm the trend is on our side, we need a trigger to execute at the right moment. This can be:
• RSI cross
• Candlestick patterns
• Trendline breaks
• Moving average crossovers, etc.
Example: I used RSI crossing above 50 as the entry trigger.
3. Risk Management
Even in the right trend at the right time — anything can happen. That’s why you should always define Stop Loss and Take Profit levels.
⸻
And there you have it! Your strategy is ready to backtest, refine, and deploy with alerts for live trading.
Questions or suggestions? Feel free to reach out

Price Statistical Strategy-Z Score V 1.01
Price Statistical Strategy – Z Score V 1.01
Overview
A technical breakdown of the logic and components of the “Price Statistical Strategy – Z Score V 1.01”.
This script implements a smoothed Z-Score crossover mechanism applied to the closing price to detect potential statistical deviations from local price mean. The strategy operates solely on price data (close) and includes signal spacing control and momentum-based candle filters. No volume-based or trend-detection components are included.
Core Methodology
The strategy is built on the statistical concept of Z-Score, which quantifies how far a value (closing price) is from its recent average, normalized by standard deviation. Two moving averages of the raw Z-Score are calculated: a short-term and a long-term smoothed version. The crossover between them generates long entries and exits.
Signal Conditions
Entry Condition:
A long position is opened when the short-term smoothed Z-Score crosses above the long-term smoothed Z-Score, and additional entry conditions are met.
Exit Condition:
The position is closed when the short-term Z-Score crosses below the long-term Z-Score, provided the exit conditions allow.
Signal Gapping:
A minimum number of bars (Bars gap between identical signals) must pass between repeated entry or exit signals to reduce noise.
Momentum Filter:
Entries are prevented during sequences of three or more consecutively bullish candles, and exits are prevented during three or more consecutively bearish candles.
Z-Score Function
The Z-Score is calculated as:
Z = (Close - SMA(Close, N)) / STDEV(Close, N)
Where N is the base period selected by the user.
Input Parameters
Enable Smoothed Z-Score Strategy
Enables or disables the Z-Score strategy logic. When disabled, no trades are executed.
Z-Score Base Period
Defines the number of bars used to calculate the simple moving average and standard deviation for the Z-Score. This value affects how responsive the raw Z-Score is to price changes.
Short-Term Smoothing
Sets the smoothing window for the short-term Z-Score. Higher values produce smoother short-term signals, reducing sensitivity to short-term volatility.
Long-Term Smoothing
Sets the smoothing window for the long-term Z-Score, which acts as the reference line in the crossover logic.
Bars gap between identical signals
Minimum number of bars that must pass before another signal of the same type (entry or exit) is allowed. This helps reduce redundant or overly frequent signals.
Trade Visualization Table
A table positioned at the bottom-right displays live PnL for open trades:
Entry Price
Unrealized PnL %
Text colors adapt based on whether unrealized profit is positive, negative, or neutral.
Technical Notes
This strategy uses only close prices — no trend indicators or volume components are applied.
All calculations are based on simple moving averages and standard deviation over user-defined windows.
Designed as a minimal, isolated Z-Score engine without confirmation filters or multi-factor triggers.

QQQ Strategy v2 ESL | easy-peasy-x This is a strategy optimized for QQQ (and SPY) for the 1H timeframe. It significantly outperforms passive buy-and-hold approach. With settings adjustments, it can be used on various assets like stocks and cryptos and various timeframes, although the default out of the box settings favor QQQ 1H.
The strategy uses various triggers to take both long and short trades. These can be adjusted in settings. If you try a different asset, see what combination of triggers works best for you.
Some of the triggers employ LuxAlgo's Ultimate RSI - shoutout to him for great script, check it out here .
Other triggers are based on custom signed standard deviation - basically the idea is to trade Bollinger Bands expansions (long to the upside, short to the downside) and fade or stay out of contractions.
There are three key moving averages in the strategy - LONG MA, SHORT MA, BASIC MA. Long and Short MAs are guides to eyes on the chart and also act as possible trend filters (adjustable in settings). Basic MA acts as guide to eye and a possible trade trigger (adjustable in settings).
There are a few trend filters the strategy can use - moving average, signed standard deviation, ultimate RSI or none. The filters act as an additional condition on triggers, making the strategy take trades only if both triggers and trend filter allows. That way one can filter out trades with unfavorable risk/reward (for instance, don't long if price is under the MA200). Different trade filters can be used for long and short trades.
The strategy employs various stop loss types, the default of which is a trailing %-based stop loss type. ATR-based stop loss is also available. The default 1.5% trailing stop loss is suitable for leveraged trading.
Lastly, the strategy can trigger take profit orders if certain conditions are met, adjustable in settings. Also, it can hold onto winning trades and exit only after stop out (in which case, consecutive triggers to take other positions will be ignored until stop out).
Let me know if you like it and if you use it, what kind of tweaks would you like to see.
With kind regards,
easy-peasy-x

Strategy with DI+/DI-, ADX, RSI, MACD, EMA + Time Stop [FAILED]I built this strategy combining trend strength (ADX, DI+/DI-), momentum (MACD, RSI), candle filters, and EMA direction with a time-based stop and fixed SL/TP.
Backtested on BTCUSDT (5-min) from Jan–Apr 2023 using TradingView Premium’s deep data.
🟥 Results:
• 5 trades, 0 wins
• -14.45% total P&L
• All trades hit stop-loss (1.5%)
• Profit factor: 0.00
Despite logical layering, the entry timing didn’t capture profitable moves. Possibly overfiltered or too delayed.
💡 Sharing this for transparency and learning. Not every test wins — but every test teaches. On to the next.

Three Inside Breakout (With 2:1 TP/SL + VWAP Filter)Buy only when the 3-candle breakout pattern is above VWAP.
Sell only when the pattern is below VWAP.
Auto-calculated TP and SL lines drawn on the chart.
VWAP plotted clearly for visual confirmation.

ATR-Based Entropy Strategy (Cooldown + Profit-Aware Exit)Just a random idea, after reading "The Hitchhiker's Guide to the Galaxy" (been reading that book multiple times since I was 13).
The fundamental question of life, the universe and everything else is number 42, which reflects the seemingly absurd nature of the search for meaning.
"So Long, and thanks for all the fish..."

Support Resistance + Trendlines StrategyCheck out this YouTube video for a detailed tutorial on how to start this trading rally.
Смотрите на ютубе подробное видео как запустить эту торговую стратегию.

EMA400 + PPO StratejisiA great strategy for those who want to make money. Sell when the price breaks the EMA 180 line down, A signals strategy that generates Strategic Trading based on the price indicator and temperature and EMA 400

Three Candle Bullish Engulfing StrategyThe Three Candle Bullish Engulfing Strategy is a versatile, multi-mode trading system designed for TradingView, combining classic candlestick patterns with momentum confirmation and dynamic risk management. This script supports both swing trading and intraday approaches, as well as an optional RSI-based breakout mode for additional signal filtering.
Key Features:
Three Candle Pattern Detection:
The strategy identifies potential trend reversal points using a three-candle pattern:
The first candle is a strong bullish (or bearish) move.
The second candle is a doji or small-bodied candle, indicating indecision.
The third candle is a bullish (or bearish) engulfing candle that closes above (or below) the previous high (or low), confirming the reversal.
Flexible Trading Modes:
Swing Long Only: Enter long trades on bullish three-candle setups.
Intraday Long & Short: Trade both long and short based on bullish and bearish three-candle patterns, with automatic session-end exits.
RSI Breakout Mode: Enter long trades when the 1-hour RSI exceeds a user-defined threshold (default 80) and a bullish candle forms, with breakout confirmation and a fixed-percentage stop loss.
Visual Aids:
Plots the RSI breakout trigger price and stop loss on the chart for easy monitoring.
How It Works:
Three Candle Pattern Entries:
Long Entry: Triggered when a bullish candle is followed by a doji, then a bullish engulfing candle closes above the previous high.
Short Entry (Intraday only): Triggered by the inverse pattern—bearish candle, doji, then bearish engulfing candle closing below the previous low.
RSI Breakout Entries:
When the RSI on a higher timeframe (default 1 hour) exceeds the set threshold and a bullish candle forms, the script records a trigger price.
A long trade is entered if the price breaks above this trigger, with a stop loss set a fixed percentage below.
Exits:
Positions are closed if the trailing stop is hit, the session ends (for intraday mode), or the stop loss is triggered in RSI breakout mode.
In RSI breakout mode, positions are also closed if a new breakout trigger forms while in position.

Dual MACD Strategy [Js.k]Strategy Overview
The Dual MACD Strategy leverages two MACD indicators with different parameters to generate buy and sell signals. By combining the trend-following properties of MACD with specific entry/exit criteria, this strategy aims to capture significant price movements while effectively managing risk.
Entry and Exit Conditions
Long Entry: A buy signal is triggered when:
The histogram of MACD1 crosses above zero.
The histogram of MACD2 is positive and rising.
Short Entry: A sell signal is triggered when:
The histogram of MACD1 crosses below zero.
The histogram of MACD2 is negative and declining.
Risk Management
Stop Loss and Take Profit:
Stop Loss is set at 1% below the entry price for long positions and 1% above the entry price for short positions.
Take Profit is set at 1.5% above the entry price for long positions and 1.5% below the entry price for short positions.
Position Sizing: Each trade risks a maximum of 10% of account equity, keeping potential losses manageable and in line with standard trading practices.
Backtesting Results
The strategy is tested on BTCUSDT with a time frame of 1 hour, resulting in 200+ trades.
The initial capital for backtesting is set to $10,000, with a realistic commission of 0.04% and a slippage of 2 ticks.
Conclusion
This strategy is inspired by Dreadblitz's Double MACD Buy and Sell, as well as some YouTube videos. My purpose in redeveloping them into this strategy is to validate the practicality of the Double MACD. After multiple modifications, this is the final version. I believe its profitability is limited and may lead to losses; please do not use this strategy for live trading.

Reversal Trap Sniper – Verified VersionReversal Trap Sniper
Overview
Reversal Trap Sniper is a counterintuitive momentum-following strategy that identifies "reversal traps"—situations where traders expect a market reversal based on RSI, but the price continues trending. By detecting these failed reversal signals, the strategy enters trades in the trend direction, often catching strong follow-through moves.
How It Works
The system monitors the Relative Strength Index (RSI). When RSI moves above the overbought level (e.g., 70) and then drops back below it, many traders interpret this as a sell signal.
However, this strategy treats such moves with caution. If the RSI pulls back below the overbought threshold but the price continues to rise, the system considers it a "reversal trap"—a fakeout.
In such cases, instead of going short, the strategy enters a long position, assuming that the trend is still valid and those betting on a reversal may fuel a breakout.
Similarly, if RSI rises above the oversold level from below, but price continues falling, a short trade is triggered.
Entries are followed by ATR-based stop-loss and dynamic take-profit (2× risk), with a fallback time-based exit after 30 bars.
Key Features
- Detects failed RSI-based reversals ("traps")
- Follows momentum after the trap is triggered
- Uses ATR for dynamic stop-loss and take-profit
- Auto-exit after a fixed bar count (30 bars)
- Visual markers on chart for transparency
- Realistic trading assumptions: 0.05% commission, slippage, and capped pyramiding
Parameter Explanation
RSI Length (14): Standard RSI calculation period
Overbought/Oversold Levels (70/30): Common thresholds used by many traders
ATR Length (14): Used to define stop-loss and target dynamically
Risk-Reward Ratio (2.0): Take-profit is set at 2× the stop-loss distance
Max Holding Bars (30): Ensures trades don’t remain open indefinitely
Pyramiding (10): Allows scaling into trades, simulating real-world strategy stacking
Originality Note
This strategy inverts traditional RSI logic. Instead of treating overbought/oversold conditions as signals for reversal, it waits for those signals to fail. Only after such failures, confirmed by continued price action in the same direction, does the system enter trades. This logic is based on the behavioral observation that failed reversal signals often trigger stronger trend continuation—making this strategy uniquely positioned to exploit trap scenarios.
Disclaimer
This script is for educational and research purposes only. Trading involves risk, and past performance does not guarantee future results. Always test thoroughly before applying with live capital.

DOT/USDT Strategy with TP/SLThis coin has the possibility to move forward and has one rise level, this indicator is to identify trades moving forward from 5_29_2025. Give it a try and is specific to DOT only. Please leave a comment.

Versi UT Bot Anti-Margin Call (Short SL = Take Profit)📌 Strategy Purpose
This strategy uses a UT Bot system based on ATR trailing stops to generate buy/sell signals. It is customized to focus on risk control and avoiding margin calls, especially in leveraged environments.
🔧 Input Parameters
Key Value (a): Sensitivity of the trailing stop (multiplier of ATR).
ATR Period (c): Lookback period for ATR calculation.
Use Heikin Ashi?: Option to apply Heikin Ashi candles instead of regular price.
Risk % per Trade: Fraction of account equity to risk per trade.
Minimum Position Size: Ensures a base size for positions regardless of calculations.
🔍 Core Components
1. Price Source
pinescript:
src = h ? request.security(haTicker, timeframe.period, close) : close
Allows the user to switch between regular candles and Heikin Ashi candles.
2. ATR & Trailing Stop
A dynamic, price-following trailing stop:
pinescript:
xATRTrailingStop := ...
Adjusts upward when price rises and downward when price falls. It’s the foundation for signal generation.
3. UT Bot Buy/Sell Signals
Based on crossover/crossunder of price and the trailing stop:
pinescript:
buySignal = ta.crossover(close, xATRTrailingStop)
sellSignal = ta.crossunder(close, xATRTrailingStop)
4. Risk Management & Position Sizing
Trade size is calculated dynamically:
pinescript:
longQty = ...
shortQty = ...
Based on account equity and ATR-derived risk, with a minimum size enforced.
5. Trend Detection
Simple trend filter using moving averages:
pinescript:
isTrendUp = ta.sma(close, 5) > ta.sma(close, 20)
isTrendDown = ta.sma(close, 5) < ta.sma(close, 20)
Currently not actively used in entries.
6. Entry & Exit Logic
Long Entry:
Triggered by buySignal.
Closes existing short, enters long with calculated size.
SL = max(2 x ATR, 10% of last profit or capital).
Short Entry:
Triggered by sellSignal.
Closes existing long, enters short.
Exit logic acts like a take profit using a stop at entryPrice - stopLoss.
7. Visuals & Alerts
Plots buy/sell labels and bar colors. Alerts can be set for both signal types.
⚠️ Strengths
Strong risk management through dynamic stop-loss and position sizing.
Designed to avoid margin calls by preventing oversizing.
Heikin Ashi compatibility may smooth signals in volatile conditions.
Visuals and alerts enhance user interaction.
❌ Potential Weaknesses
Short position exit uses a stop loss, but functions more like a take profit.
Trend detection is calculated but not used in entry decisions.
No re-entry logic after a stop-out.
Does not use strategy.opentrades for deeper trade control.
✅ Suggestions for Improvement
Actively apply the trend filter to validate entries.
Use strategy.opentrades to manage trade conditions more intelligently.
Add a real take profit logic for long trades (to mirror short side).
Consider using the trailing stop for exits as well, not just for signals.

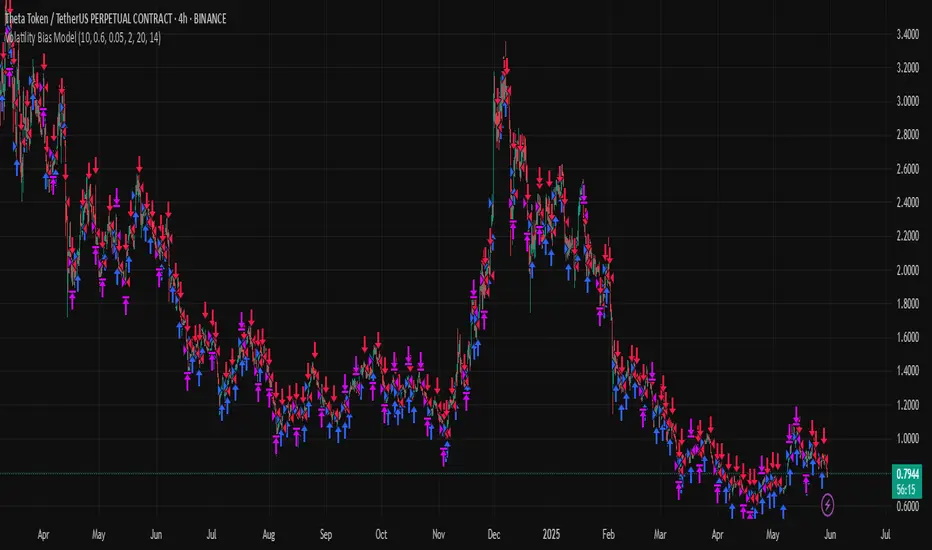
Volatility Bias ModelVolatility Bias Model
Overview
Volatility Bias Model is a purely mathematical, non-indicator-based trading system that detects directional probability shifts during high volatility market phases. Rather than relying on classic tools like RSI or moving averages, this strategy uses raw price behavior and clustering logic to determine potential breakout direction based on recent market bias.
How It Works
Over a defined lookback window (default 10 bars), the strategy counts how many candles closed in the same direction (i.e., bullish or bearish).
Simultaneously, it calculates the price range during that window.
If volatility is above a minimum threshold and a clear directional bias is detected (e.g., >60% of closes are bullish), a trade is opened in the direction of that bias.
This approach assumes that when high volatility is coupled with directional closing consistency, the market is probabilistically more likely to continue in that direction.
ATR-based stop-loss and take-profit levels are applied, and trades auto-exit after 20 bars if targets are not hit.
Key Features
- 100% non-indicator-based logic
- Statistically-driven directional bias detection
- Works across all timeframes (1H, 4H, 1D)
- ATR-based risk management
- No pyramiding, slippage and commissions included
- Compatible with real-world backtesting conditions
Realism & Assumptions
To make this strategy more aligned with actual trading environments, it includes 0.05% commission per trade and a 1-point slippage on every entry and exit.
Additionally, position sizing is set at 10% of a $10,000 starting capital, and no pyramiding is allowed.
These assumptions help avoid unrealistic backtest results and make the performance metrics more representative of live conditions.
Parameter Explanation
Bias Window (10 bars): Number of past candles used to evaluate directional closings
Bias Threshold (0.60): Required ratio of same-direction candles to consider a bias valid
Minimum Range (1.5%): Ensures the market is volatile enough to avoid noise
ATR Length (14): Used to dynamically define stop-loss and target zones
Risk-Reward Ratio (2.0): Take-profit is set at twice the stop-loss distance
Max Holding Bars (20): Trades are closed automatically after 20 bars to prevent stagnation
Originality Note
Unlike common strategies based on oscillators or moving averages, this script is built on pure statistical inference. It models the market as a probabilistic process and identifies directional intent based on historical closing behavior, filtered by volatility. This makes it a non-linear, adaptive model grounded in real-world price structure — not traditional technical indicators.
Disclaimer
This strategy is for educational and experimental purposes only. It does not constitute financial advice. Always perform your own analysis and test thoroughly before applying with real capital.
Multi-Indicator Trend-Following Strategy v6Multi-Indicator Trend-Following Strategy v6
This strategy uses a combination of technical indicators to identify potential trend-following trade entries and exits. It is intended for educational and research purposes.
How it works:
Moving Averages (EMA): Entry signals are generated on crossovers between a fast and slow exponential moving average.
RSI Filter: Confirms momentum with a threshold above/below 50 for long/short entries.
Volume Confirmation: Requires volume to exceed a moving average multiplied by a user-defined factor.
ATR-Based Risk Management: Stop loss and take profit levels are calculated using the Average True Range (ATR), allowing for dynamic risk control based on market volatility.
Customizable Inputs:
Fast/Slow MA lengths
RSI length and levels
MACD settings (used in calculation, not directly in signal)
Volume MA and multiplier
ATR period and multipliers for stop loss and take profit
Notes:
This strategy does not guarantee future results.
It is provided for analysis and backtesting only.
Alerts are available for buy/sell conditions.
Feel free to adjust parameters to explore different market conditions and asset classes.

5-Minute Scalping Botkrozz indicator working on all time frames . take profit and stop lose on chart.

SMA Crossover StrategyThis is a Pine Script for a simple moving average crossover strategy with buy and sell alerts
