Double&Triple Pattern[TS_Indie]📌 Description – Double & Triple Pattern Indicator
The Double & Triple Pattern Indicator is developed to help traders systematically and clearly identify Double Top, Double Bottom, Triple Top, and Triple Bottom chart patterns.
⚙️ Core Logic & Working Mechanism
The Double & Triple Pattern Indicator is built on the concept of price swing formation, based on the logic of Trend Entry_0 , which focuses on structured market analysis and price action behavior.
The indicator detects three main swing points (Swing 1, Swing 2, and Swing 3). A Fibonacci Box is then created using Swing A and Swing B as reference points to define the swing detection zone.
When all three swings remain inside the defined Fibonacci Box, the structure is considered a valid Price Action setup.
The indicator then plots key lines on the chart:
➩ Break Line – used to confirm the signal (confirmation)
➩ Cancel Line – used to invalidate the price action if price moves against the conditions
➛ When price breaks the Break Line , the structure is confirmed and a Pending Order is placed at Swing B , with the Stop Loss set at Swing 1.
➛ If price breaks the Cancel Line first, the price action structure is immediately invalidated.
⚙️ Fibonacci Entry Zone & Change SL Settings
➩ When Fibo Entry Zone is set to 0, the Pending Order is placed directly at Swing B.
➩ When the value is greater than 0, the Pending Order is calculated using Fibonacci levels drawn from Swing B to the Stop Loss level.
➩ Change SL allows switching the Stop Loss reference between Swing 1 and Swing A.
⚙️ Min & Max Control for Swing Size : xATR
When enabling Control Size Swing : xATR , the indicator filters Swing B based on the defined Min and Max range.
This allows traders to selectively test larger or smaller swing-based price actions , depending on their trading strategy.
⭐ Pending Order Cancellation Conditions
A Pending Order will be canceled under the following conditions:
1.A new Price Action signal appears on either the Buy or Sell side.
2.When Time Session is enabled, the Pending Order is canceled once price exits the selected session.
🕹 Order Management Rule
When there is an active open position, the indicator restricts the creation of new Pending Orders to prevent overlapping positions.
💡 Double Pattern Example
💡 Triple Pattern Example
⚠️ Disclaimer
This indicator is designed for technical analysis purposes only and does not constitute investment advice.
Users should apply proper risk management and make decisions at their own discretion.
🥂 Community Sharing
If you find parameter settings that work well or produce strong statistical results, feel free to share them with the community so we can improve and develop this indicator together.
Indicators and strategies

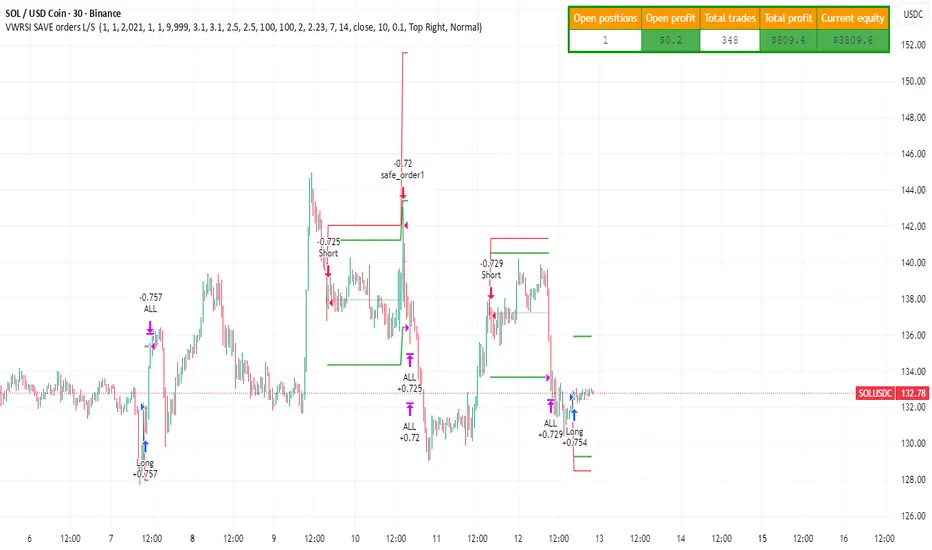
Strategy with VWRSI and SAVE orders Long or Short or BothVWRSI is very powerful indicator coded by Algo Alpha and I Make Strategy of it
But there is no stop loss instate the Strategy is using Save orders to minimize the market manipulation
The best to used is side way market with long and short enable
The Strategy trigger long or short market order -
long - ta.crossover(rsi, 20)
short - ta.crossunder(rsi, 80)
And if is not take profit from the first trade start with the save trades until will do
the sum of the first order - base order and the save order can be adjust from the user
as well the deviation from the first order
IF some user have questions let me know

[SM-021] Gaussian Trend System [Optimized]This script is a comprehensive trend-following strategy centered around a Gaussian Channel. It is designed to capture significant market movements while filtering out noise during consolidation phases. This version (v2) introduces code optimizations using Pine Script v6 Arrays and a new Intraday Time Control feature.
1. Core Methodology & Math
The foundation of this strategy is the Gaussian Filter, originally conceptualized by @DonovanWall.
Gaussian Poles: Unlike standard moving averages (SMA/EMA), this filter uses "poles" (referencing signal processing logic) to reduce lag while maintaining smoothness.
Array Optimization: In this specific iteration, the f_pole function has been refactored to utilize Pine Script Arrays. This improves calculation efficiency and rendering speed compared to recursive variable calls, especially when calculating deep historical data.
Channel Logic: The strategy calculates a "Filtered True Range" to create High and Low bands around the main Gaussian line.
Long Entry: Price closes above the High Band.
Short Entry: Price closes below the Low Band.
2. Signal Filtering (Confluence)
To reduce false signals common in trend-following systems, the strategy employs a "confluence" approach using three additional layers:
Baseline Filter: A 200-period (customizable) EMA or SMA acts as a regime filter. Longs are only taken above the baseline; Shorts only below.
ADX Filter (Volatility): The Average Directional Index (ADX) is used to measure trend strength. If the ADX is below a user-defined threshold (default: 20), the market is considered "choppy," and new entries are blocked.
Momentum Check: A Stochastic RSI check ensures that momentum aligns with the breakout direction.
3. NEW: Intraday Session Filter
Per user requests, a time-based filter has been added to restrict trading activity to specific market sessions (e.g., the New York Open).
How it works: Users can toggle a checkbox to enable/disable the filter.
Configuration: You can define a specific time range (Default: 09:30 - 16:00) and a specific Timezone (Default: New York).
Logic: The strategy longCondition and shortCondition now check if the current bar's timestamp falls within this window. If outside the window, no new entries are generated, though existing trades are managed normally.
4. Risk Management
The strategy relies on volatility-based exits rather than fixed percentage stops:
ATR Stop Loss: A multiple of the Average True Range (ATR) is calculated at the moment of entry to set a dynamic Stop Loss.
ATR Take Profit: An optional Reward-to-Risk (RR) ratio can be set to place a Take Profit target relative to the Stop Loss distance.
Band Exit: If the trend reverses and price crosses the opposite band, the trade is closed immediately to prevent large drawdowns.
Credits & Attribution
Original Gaussian Logic: Developed by @DonovanWalll. This script utilizes his mathematical formula for the pole filters.
Strategy Wrapper & Array Refactor: Developed by @sebamarghella.
Community Request: The Intraday Session Filter was added to assist traders focusing on specific liquidity windows.
Disclaimer: This strategy is for educational purposes. Past performance is not indicative of future results. Please use the settings menu to adjust the Session Time and Risk parameters to fit your specific asset class.

Slope Failure (Momentum Stall) STRATEGY//======================================================================================
// SLOPE FAILURE (MOMENTUM STALL) STRATEGY
//--------------------------------------------------------------------------------------
// WHAT THIS STRATEGY DOES
// -----------------------
// This strategy trades **momentum failure**, not trend direction.
//
// Instead of predicting where price will go, it detects when **momentum can no longer
// continue in its current direction** and briefly fades that failure.
//
// Core idea:
// - Momentum expands → slope grows
// - Momentum stalls → slope collapses or flips
// - That stall represents **state transition**, not noise
//
// The system exploits these transitions repeatedly at short horizons.
//
//--------------------------------------------------------------------------------------
// HOW MOMENTUM IS MEASURED
// ------------------------
// 1. Source price (optionally smoothed)
// 2. First derivative (slope = price - price )
// 3. Optional smoothing of the slope itself
//
// The slope represents **instantaneous directional force**, not trend bias.
//
//--------------------------------------------------------------------------------------
// ENTRY LOGIC (SLOPE FAILURE)
// ---------------------------
// • Bull Slope Failure (SHORT):
// - Prior slope was sufficiently positive
// - Current slope collapses to zero or below
// → Upward momentum failed → enter SHORT
//
// • Bear Slope Failure (LONG):
// - Prior slope was sufficiently negative
// - Current slope rises to zero or above
// → Downward momentum failed → enter LONG
//
// Optional:
// - Minimum slope band can be enforced to avoid weak/noisy failures
//
//--------------------------------------------------------------------------------------
// EXIT LOGIC
// ----------
// Primary exits are **force-based**, not price-based:
//
// • Longest Slope Local Turn (optional):
// - Detects when the strongest slope in a recent window has occurred
// - Exits when momentum starts decaying from that extreme
//
// • Percent Stop Loss (optional):
// - Fixed % protection relative to entry price
//
// The strategy does NOT rely on profit targets.
// Winners are exited when **momentum decays**, not when price "looks good".
//
//--------------------------------------------------------------------------------------
// POSITION SIZING
// ---------------
// This strategy supports **percent-of-equity sizing**, computed dynamically:
//
// position size = (account equity × % allocation) / price
//
// This allows:
// - P&L to scale smoothly
// - Drawdowns to remain proportional
// - The same logic to work across symbols and account sizes
//
//--------------------------------------------------------------------------------------
// STRATEGY CHARACTERISTICS
// ------------------------
// • High trade count
// • Win rate near ~45–50%
// • Small, fast losers
// • Slightly larger winners
// • Very low drawdown
//
// This profile is intentionally designed for **scalability**, not prediction.
//
//--------------------------------------------------------------------------------------
// IMPORTANT NOTES
// ---------------
// • This is NOT a trend-following strategy
// • This is NOT a mean-reversion guess
// • This is a momentum **state-transition detector**
//
// The edge comes from structure + exits + sizing — not indicators.
//
//======================================================================================

Combined Signal + Auto Day Plan + Volume📘 TradingView Description — Combined Signal + Auto Day Plan + Volume
Strategy Overview
This strategy combines trend-following signals, daily context levels, and volume confirmation to generate high-probability intraday trading setups.
It is designed to filter noise, identify trend direction early, and avoid trades during low-quality market conditions.
🔷 1. Combined Signal Logic
The strategy merges multiple indicators to produce a single, cleaner signal:
Long Signal
Trend bias is bullish
Momentum histogram (MACD/Custom) shows upward pressure
Price crosses above the midline (WMA/EMA/etc.)
Volume supports the move
Short Signal
Trend bias is bearish
Momentum histogram shows downward pressure
Price crosses below the midline
Volume supports the move
This reduces false breakouts and ensures signals appear only during strong directional moves.
🔶 2. Auto Day Plan Levels (D-1 → D)
The script automatically reads previous day levels and displays them on today’s session:
Previous Day High (PDH)
Previous Day Low (PDL)
Previous Day Close (PDC)
Previous Day Mid / Range Zones
Optional FIB levels or custom zones
These levels act as intraday support/resistance, helping identify breakout, reversal, and retest opportunities.
Behavior:
D-1 levels are plotted from today’s open until today’s close.
Levels do not overlap into the wrong day.
Optional: extend lines to next day (D+1) for planning.
🔷 3. Volume Confirmation
To improve entry accuracy, the script checks for strength in volume:
Volume > X-period average
Volume spike detection
Relative Volume (RVOL) filter
Optional low-volume avoidance
A trade is taken only when the market shows real participation, reducing traps and sideways chop trades.
🔶 4. Entry & Exit Logic
Entry
Long Entry: Combined bull signal + volume confirmation
Short Entry: Combined bear signal + volume confirmation
Exit
Long Exit → Histogram turns down (hist < hist )
Short Exit → Histogram turns up (hist > hist )
Optional:
Auto SL at PDL/PDH
Trailing based on midline
Take profit using FIB or volatility levels
💠 5. Visuals
The chart plots:
Buy/Sell markers
D-1 support/resistance lines
Trend direction midline
Volume confirmation label
Combined signal status
Colors and styles can be customized from the input panel.
🎯 6. Purpose of the Strategy
This is a complete intraday automation tool combining:
✔ Trend
✔ Momentum
✔ Volume strength
✔ Key day levels
The goal is to provide structured, mechanical, rule-based trading — reducing emotional decisions and improving consistency.

Hammer Breakout (Adjustable RR)Hammer candle detection and strat for back testing.
diamond indicates a detected hammer candle, the position is entered at the hammer candle close.
Stop loss below the hammer candle wick.
Adjustbale rr based on the distance to the stop (bottom of wick)

Capitulation Detector StrategyA multi-factor capitulation detector designed to identify exhaustion points in extended trends. It focuses on fading capitulation moves after multi-leg trends with extreme volume and price extension.
━━━━━━━━━━━━━━━━━━━━━━━━━━━━━━━━━━━━━━━━
THE CONCEPT
Capitulation occurs when the last holders give up — panic selling into lows or euphoric buying into highs. These moments create asymmetric opportunities because:
Sentiment becomes maximally skewed
Weak hands are flushed out
Price deviates far from equilibrium
The "fuel" for continuation is exhausted
━━━━━━━━━━━━━━━━━━━━━━━━━━━━━━━━━━━━━━━━
THE 6 FACTORS
Trend Persistence — Price stays on one side of 38 EMA for 12+ bars, confirming a sustained directional move
Acceleration — Price stays on one side of 5 EMA for 3+ bars, showing the move is accelerating into exhaustion
Volume Spike — Current bar volume ≥ 2x the 20-bar average
Body Expansion — Candle body ≥ 1.5x average, showing conviction/panic in the move
Extension — Price is 2+ ATR away from the 38 EMA, indicating overextension from equilibrium
Multi-Leg Structure — At least 3 consecutive lower lows (for longs) or higher highs (for shorts)
━━━━━━━━━━━━━━━━━━━━━━━━━━━━━━━━━━━━━━━━
SIGNAL LOGIC
Bullish Capitulation: 4+ factors align + price below 38 EMA + down candle + volume spike
Bearish Capitulation: 4+ factors align + price above 38 EMA + up candle + volume spike
The strategy enters counter-trend, fading the exhaustion move.
━━━━━━━━━━━━━━━━━━━━━━━━━━━━━━━━━━━━━━━━
EXIT OPTIONS
ATR-based stop loss (default: 2 ATR)
ATR-based take profit (default: 3 ATR)
Optional trailing stop
Time filter for session-specific trading
━━━━━━━━━━━━━━━━━━━━━━━━━━━━━━━━━━━━━━━━
BEST PRACTICES
Works best on liquid instruments with clean trends
More reliable after 3+ legs in the trend
Higher conviction when daily AND intraday timeframes align
"The bigger and more extended, the better"
Consider VWAP as additional confirmation (not coded here)
━━━━━━━━━━━━━━━━━━━━━━━━━━━━━━━━━━━━━━━━
SETTINGS GUIDE
Min Score: Increase for fewer, higher-quality signals
Volume Spike Multiplier: 2x; increase for stricter filter
Extension ATR: Higher values = more overextended setups only
Trend Bars Min: Higher values = longer established trends required
━━━━━━━━━━━━━━━━━━━━━━━━━━━━━━━━━━━━━━━━
ALERTS
Bullish Capitulation (potential long)
Bearish Capitulation (potential short)
━━━━━━━━━━━━━━━━━━━━━━━━━━━━━━━━━━━━━━━━
DISCLAIMER
This is a counter-trend strategy — inherently higher risk than trend-following. Always use proper position sizing and risk management. Backtest thoroughly on your specific instruments and timeframes.

Sinals 15m - RSI 7 e 9This strategy is designed to capture continuation moves on the 15-minute chart by combining trend filters, momentum indicators, and strong-candle confirmation. The core idea is to enter trades shortly after EMA crossovers that signal direction, as long as momentum and candle strength support the move.

ORB Strategy: Extensions & Custom SL (EOD & Live Lines)That's a great request. Since you've now built a complex Pine Script Strategy with several user-configurable risk management, targeting, and exit options, the description should focus on the systematic rules used for entering, managing, and exiting trades.
Here is a clear, written description of the trading strategy you have built:
Trading Strategy Description: ORB Extension Breakout with Custom Stop, Live Tracking, and EOD Exit
This strategy is a systematic, momentum-based system designed for intraday trading. It operates on the principle of an Opening Range Breakout (ORB), utilizing the initial market consolidation to project high-probability targets, while offering multiple methods for managing risk and enforcing a mandatory end-of-day closure.
1. Market Identification (The Opening Range)
The strategy first defines the market's initial boundaries and volatility:
Session Window: The strategy calculates the Opening Range (OR) over a user-defined time period (default: 9:30 AM to 10:30 AM New York Time).
ORB Levels: Two key price levels are established and locked once the time window closes:
Wick High/Low: The absolute highest and lowest prices of the session. These serve as the entry trigger lines.
Body High/Low (Shaded Range): The highest and lowest open/close prices of the session. The height of this range is used as the basis for calculating all targets and stops.
2. Entry Rule (The Breakout)
The strategy waits passively for a breakout that confirms direction and ensures the move has not yet reached its immediate target.
Trigger Condition: A trade is signaled when a candle closes either:
Above the Wick High (for a Long entry).
Below the Wick Low (for a Short entry).
Constraint (Fresh Breakout): The entry is invalidated if the breakout candle's price action (High for Long, Low for Short) has already touched or surpassed the projected Take Profit (0.5 Extension) level before the candle closes.
Execution: The entry is a Market Order executed on the candle that meets the trigger conditions, subject to a user-defined Entry Delay (default 0 bars).
Direction Control: The user can select to trade Long Only, Short Only, or Both.
3. Exit and Risk Management
All trades are placed with simultaneous Take Profit and Stop Loss orders (a bracket order) upon entry.
A. Take Profit (TP)
The Take Profit is set at the 0.5 Extension of the Shaded Range (Body Range).
Calculation: The distance from the Body High/Low to the TP level is exactly 50% of the total height of the Shaded Range.
B. Stop Loss (SL)
The Stop Loss is dynamically calculated based on a user-selected method for risk control:
Range 0.5 (Body Range): The SL is placed an equal distance (0.5 times the Body Range height) outside the opposite side of the Body Range.
ATR Multiple: The Stop Loss distance is calculated as a user-defined Multiplier times the Average True Range (ATR).
Recent Swing Low/High: The Stop Loss is placed based on a structural low (for Long) or high (for Short) within a user-defined lookback period.
C. End-of-Day (EOD) Exit
Any open position is forced closed at the market price if it is still open when the user-defined closing time (default: 16:00 HHMM) is reached. This prevents carrying intraday risk overnight.
4. Visualization
The strategy includes comprehensive visual cues for analysis:
ORB Drawing: Displays the Wick High/Low and the shaded Body Range.
Breakout Signals: Highlights the specific bar where the validated entry signal occurs.
Closed Trades: Draws persistent lines for the Entry and Exit prices of the last few closed trades.
Live Open Trades: Draws persistent lines for the current Entry Price, active Take Profit Level, and active Stop Loss Level for any open position.

Ichimoku Kijun OPTIMISED FOR 15MIN EURUSDWhen to Enter a Trade (The Kijun Bounce)
We only enter when the market is clearly trending and we get a good pullback to the Kijun-sen (the red line).
Market Quality Check (Anti-Chop):
The price must be completely outside the Ichimoku Cloud (Kumo). This ensures we are not trading in a choppy, sideways market.
Buy (Long) Entry:
The price (low of the candle) drops down and touches the Kijun-sen (red line).
The candle then closes above the Kijun-sen, confirming the trend is holding and the bounce is real.
Sell (Short) Entry:
The price (high of the candle) rises up and touches the Kijun-sen (red line).
The candle then closes below the Kijun-sen, confirming the downtrend is holding and the rejection is real.
How to Manage Risk and Exit
We use a fixed profit target (Take Profit) and a dynamic Stop Loss (Trailing Stop) that follows the Kijun-sen.
Risk per Trade:
We risk 1.0 percent of the total account equity per trade.
The initial Stop Loss distance is limited to 1.0 times the ATR, and is strictly capped at 1.0 percent of the price to prevent any single catastrophic loss.
Take Profit (TP):
The fixed profit target is set to a 1.5 Risk to Reward ratio (1.5 R:R) . This means the profit target is 1.5 times the size of the initial stop loss.
Stop Loss (SL):
The Stop Loss is a Trailing Stop that automatically moves with the Kijun-sen (red line).
The Stop Loss will trail slightly below the Kijun-sen for a Buy trade, and slightly above the Kijun-sen for a Sell trade, protecting profits dynamically as the trend continues.
Understanding the Trade Signals
🟢🟡 The Round Dots (Entry Signals)
The small, round dots are placed directly on the candle where the strategy decided to enter a trade. The color tells you the direction:
Lime Green Dot: Signals a confirmed Long (Buy) Entry. This happens on the candle where the price successfully bounced off the Kijun-sen (red line) and closed higher, and the market was outside the Kumo (the cloud).
Red Dot: Signals a confirmed Short (Sell) Entry. This happens on the candle where the price was successfully rejected by the Kijun-sen (red line) and closed lower, and the market was outside the Kumo.
⬆️⬇️ The Arrows (Exit Signals)
The arrows appear at the exact price level where the trade was closed (exited). The direction of the arrow indicates where the exit occurred relative to the market action, but the color is more important for determining the result:
Exit Arrow (Often Green/Red): This signals a trade was closed for one of two reasons:
Take Profit (Limit Hit): The trade moved in your favor and hit the fixed 1.5 R:R profit target. This is a successful, profitable exit.
Stop Loss (Trailing Stop Hit): The market reversed against the position, and the trade was closed by the dynamic Kijun-sen Trailing Stop. This is a risk-controlled loss or a break-even exit.
The size of these arrows is the default setting used by the strategy.exit() function in Pine Script to clearly mark the exit price on the chart.
In Summary
The dots tell you when to get in (Entry) based on the Kijun Reversion rule, and the arrows tell you when you got out (Exit) due to hitting either the target profit or the trailing stop loss.

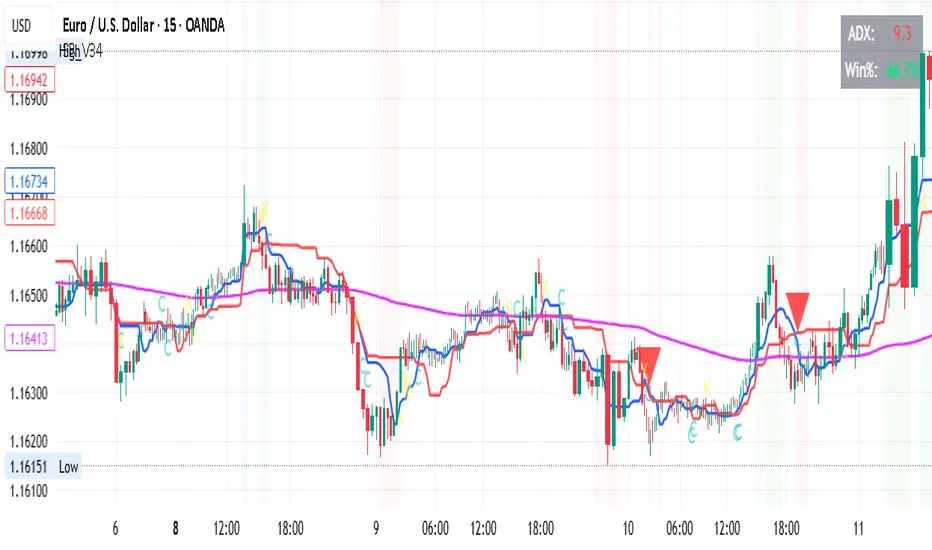
OPTIMISED FOR 15Min on certain FOREX Ichimoku & Friends Strategy
Timeframe
15-Minute Chart
Entry Rules
Required Conditions ALL Must Be True
For LONG Entries:
Trend: Price is above EMA 200 (purple line)
Ichimoku: Tenkan (blue) is above Kijun (red)
Price Position: Close is above BOTH Tenkan AND Kijun
ADX: Must be above 22 (shows strong trend)
RSI: Between 50 and 70 (has momentum, not overbought)
Cooldown: At least 12 bars since last trade closed
For SHORT Entries:
Trend: Price is below EMA 200 (purple line)
Ichimoku: Tenkan (blue) is below Kijun (red)
Price Position: Close is below BOTH Tenkan AND Kijun
ADX: Must be above 22 (shows strong trend)
RSI: Between 30 and 50 (has momentum, not oversold)
Cooldown: At least 12 bars since last trade closed
Entry Signals Any ONE of These
Signal Type 1: Cross (C)
Long: Tenkan crosses above Kijun AND price closes above Kijun
Short: Tenkan crosses below Kijun AND price closes below Kijun
Wait 1 bar to confirm the cross holds
Signal Type 2: Bounce (B) - Most Reliable
Long: Price touches/dips to Kijun, then bounces up with strong bullish candle
Short: Price touches/spikes to Kijun, then rejects down with strong bearish candle
Must occur within last 3 bars
Signal Type 3: Breakout (K)
Long: Price breaks above Kijun with strong bullish momentum candle
Short: Price breaks below Kijun with strong bearish momentum candle
Candle body must be at least 40% of ATR
Risk Management
Stop Loss Placement
Placed at the lower of:
Recent swing low (last 5 bars) for longs
Kijun minus 0.5 ATR for longs
Minimum distance: 2.5 x ATR
FOR SHORTS: Mirror logic using swing highs
Take Profit
2x the stop loss distance
Example: If stop is 20 pips away, target is 40 pips
Position Size
100% of equity per trade (as per current settings)
Adjust based on your risk tolerance
Trade Management
When to Enter
Only when ALL entry conditions are met
Check that background is shaded (green for long, red for short)
Small letter markers (C, B, K) show which signal type triggered
When to Exit
Take Profit hit (2x R:R ratio)
Stop Loss hit (smart placement protects capital)
Strategy closes position (conditions reverse)
Cooldown Period
Wait 12 bars (3 hours on 15m chart) after any trade closes
Prevents revenge trading and overtrading
Visual Indicators on Chart
Lines
Blue (Tenkan): 9-period conversion line
Red (Kijun): 26-period base line
Purple (EMA 200): Long-term trend line
Orange (EMA 50): Not used in current rules
Signals
Large Green Triangle Up: LONG entry
Large Red Triangle Down: SHORT entry
Small Letters (C/B/K): Which signal type triggered
Background Colors
Light Green: Conditions favorable for LONG (ADX good, uptrend)
Light Red: Conditions favorable for SHORT (ADX good, downtrend)
No Color: Not safe to trade
Top Right Display
ADX Value: Green = above threshold, Red = below
Win Rate: Shows current performance
Quick Checklist Before Entry
LONG Trade Checklist:
Price above purple EMA 200
Blue line above red line
Price above both blue AND red lines
ADX number is green (above 22)
RSI between 50-70
Background is light green
At least 12 bars since last trade
Signal marker appeared (triangle or letter)
SHORT Trade Checklist:
Price below purple EMA 200
Blue line below red line
Price below both blue AND red lines
ADX number is green (above 22)
RSI between 30-50
Background is light red
At least 12 bars since last trade
Signal marker appeared (triangle or letter)
Tips for Success
Best Signal Type: Bounce (B) signals typically have highest win rate
ADX is Critical: Do not trade when ADX is red - wait for trends
Be Patient: 2-3 trades per day on 15m is normal and healthy
Trust the System: Do not second-guess the signals
Respect Cooldown: Waiting prevents emotional trading
Monitor Win Rate: Keep above 50% for profitability with 2:1 R:R
Adjustable Settings
If you want to modify strategy performance:
For Higher Win Rate Fewer Trades:
Increase "Minimum ADX" to 25
Increase "Cooldown Bars" to 15
Turn OFF breakout signals
For More Trades Slightly Lower Win Rate:
Decrease "Minimum ADX" to 20
Decrease "Cooldown Bars" to 8
Keep all signal types enabled
For Better Risk:Reward:
Increase "Risk:Reward Ratio" to 2.5 or 3.0
This means bigger targets, letting winners run more
What NOT to Do
Do not trade without ADX confirmation (when number is red)
Do not enter during cooldown period
Do not trade when price is chopping around EMA 200
Do not override the stop loss - let it work
Do not take signals when Tenkan and Kijun are flat/parallel
Do not force trades - wait for all conditions
Do not trade if you see no background shading
Notes
Current Performance: 67% win rate (2/3 trades)
Timeframe: 15-minute (3 hours = 12 bars cooldown)
Profit Factor Target: Above 1.5 is excellent
Strategy works best during: European and US trading sessions when volatility is higher
DYOR NFA
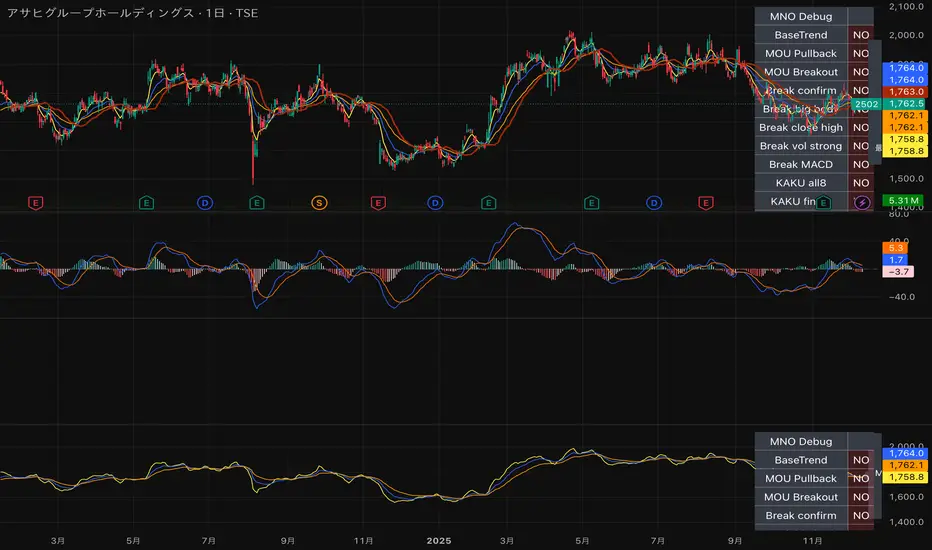
MNO_2Step_Strategy_MOU_KAKU (Publish-Clear)//@version=5
strategy("MNO_2Step_Strategy_MOU_KAKU (Publish-Clear)", overlay=true, pyramiding=0,
max_labels_count=500, max_lines_count=500,
initial_capital=100000,
default_qty_type=strategy.percent_of_equity, default_qty_value=10)
// =========================
// Inputs
// =========================
emaSLen = input.int(5, "EMA Short (5)")
emaMLen = input.int(13, "EMA Mid (13)")
emaLLen = input.int(26, "EMA Long (26)")
macdFast = input.int(12, "MACD Fast")
macdSlow = input.int(26, "MACD Slow")
macdSignal = input.int(9, "MACD Signal")
macdZeroTh = input.float(0.2, "MOU: MACD near-zero threshold", step=0.05)
volLookback = input.int(5, "Volume MA days", minval=1)
volMinRatio = input.float(1.3, "MOU: Volume ratio min", step=0.1)
volStrong = input.float(1.5, "Strong volume ratio (Breakout/KAKU)", step=0.1)
volMaxRatio = input.float(3.0, "Volume ratio max (filter)", step=0.1)
wickBodyMult = input.float(2.0, "Pinbar: lowerWick >= body*x", step=0.1)
pivotLen = input.int(20, "Resistance lookback", minval=5)
pullMinPct = input.float(5.0, "Pullback min (%)", step=0.1)
pullMaxPct = input.float(15.0, "Pullback max (%)", step=0.1)
breakLookbackBars = input.int(5, "Pullback route: valid bars after break", minval=1)
// --- Breakout route (押し目なし初動ブレイク) ---
useBreakoutRoute = input.bool(true, "Enable MOU Breakout Route (no pullback)")
breakConfirmPct = input.float(0.3, "Break confirm: close > R*(1+%)", step=0.1)
bigBodyLookback = input.int(20, "Break candle body MA length", minval=5)
bigBodyMult = input.float(1.2, "Break candle: body >= MA*mult", step=0.1)
requireCloseNearHigh = input.bool(true, "Break candle: close near high")
closeNearHighPct = input.float(25.0, "Close near high threshold (% of range)", step=1.0)
allowMACDAboveZeroInstead = input.bool(true, "Breakout route: allow MACD GC above zero instead")
// 表示
showEMA = input.bool(true, "Plot EMAs")
showMouLabels = input.bool(true, "Show MOU/MOU-B labels")
showKakuLabels = input.bool(true, "Show KAKU labels")
showDebugTbl = input.bool(true, "Show debug table (last bar)")
showStatusLbl = input.bool(true, "Show status label (last bar always)")
locChoice = input.string("Below Bar", "Label location", options= )
lblLoc = locChoice == "Below Bar" ? location.belowbar : location.abovebar
// =========================
// 必ず決済が起きる設定(投稿クリア用)
// =========================
enableTPSL = input.bool(true, "Enable TP/SL")
tpPct = input.float(2.0, "Take Profit (%)", step=0.1, minval=0.1) // ←投稿クリア向けに近め
slPct = input.float(1.0, "Stop Loss (%)", step=0.1, minval=0.1) // ←投稿クリア向けに近め
maxHoldBars = input.int(30, "Max bars in trade (force close)", minval=1)
entryMode = input.string("MOU or KAKU", "Entry trigger", options= )
// ✅ 保険:トレード0件を避ける(投稿クリア用)
// 1回でもクローズトレードができたら自動で沈黙
publishAssist = input.bool(true, "Publish Assist (safety entry if 0 trades)")
// =========================
// EMA
// =========================
emaS = ta.ema(close, emaSLen)
emaM = ta.ema(close, emaMLen)
emaL = ta.ema(close, emaLLen)
plot(showEMA ? emaS : na, color=color.new(color.yellow, 0), title="EMA 5")
plot(showEMA ? emaM : na, color=color.new(color.blue, 0), title="EMA 13")
plot(showEMA ? emaL : na, color=color.new(color.orange, 0), title="EMA 26")
emaUpS = emaS > emaS
emaUpM = emaM > emaM
emaUpL = emaL > emaL
goldenOrder = emaS > emaM and emaM > emaL
above26_2days = close > emaL and close > emaL
baseTrendOK = (emaUpS and emaUpM and emaUpL) and goldenOrder and above26_2days
// =========================
// MACD
// =========================
= ta.macd(close, macdFast, macdSlow, macdSignal)
macdGC = ta.crossover(macdLine, macdSig)
macdUp = macdLine > macdLine
macdNearZero = math.abs(macdLine) <= macdZeroTh
macdGCAboveZero = macdGC and macdLine > 0 and macdSig > 0
macdMouOK = macdGC and macdNearZero and macdUp
macdBreakOK = allowMACDAboveZeroInstead ? (macdMouOK or macdGCAboveZero) : macdMouOK
// =========================
// Volume
// =========================
volMA = ta.sma(volume, volLookback)
volRatio = volMA > 0 ? (volume / volMA) : na
volumeMouOK = volRatio >= volMinRatio and volRatio <= volMaxRatio
volumeStrongOK = volRatio >= volStrong and volRatio <= volMaxRatio
// =========================
// Candle patterns
// =========================
body = math.abs(close - open)
upperWick = high - math.max(open, close)
lowerWick = math.min(open, close) - low
pinbar = (lowerWick >= wickBodyMult * body) and (lowerWick > upperWick) and (close >= open)
bullEngulf = close > open and close < open and close >= open and open <= close
bigBull = close > open and open < emaM and close > emaS and (body > ta.sma(body, 20))
candleOK = pinbar or bullEngulf or bigBull
// =========================
// Resistance / Pullback route
// =========================
res = ta.highest(high, pivotLen)
pullbackPct = res > 0 ? (res - close) / res * 100.0 : na
pullbackOK = pullbackPct >= pullMinPct and pullbackPct <= pullMaxPct
brokeRes = ta.crossover(close, res )
barsSinceBreak = ta.barssince(brokeRes)
afterBreakZone = (barsSinceBreak >= 0) and (barsSinceBreak <= breakLookbackBars)
pullbackRouteOK = afterBreakZone and pullbackOK
// =========================
// Breakout route (押し目なし初動ブレイク)
// =========================
breakConfirm = close > res * (1.0 + breakConfirmPct / 100.0)
bullBreak = close > open
bodyMA = ta.sma(body, bigBodyLookback)
bigBodyOK = bodyMA > 0 ? (body >= bodyMA * bigBodyMult) : false
rng = math.max(high - low, syminfo.mintick)
closeNearHighOK = not requireCloseNearHigh ? true : ((high - close) / rng * 100.0 <= closeNearHighPct)
mou_breakout = useBreakoutRoute and baseTrendOK and breakConfirm and bullBreak and bigBodyOK and closeNearHighOK and volumeStrongOK and macdBreakOK
mou_pullback = baseTrendOK and volumeMouOK and candleOK and macdMouOK and pullbackRouteOK
mou = mou_pullback or mou_breakout
// =========================
// KAKU (Strict): 8条件 + 最終三点
// =========================
cond1 = emaUpS and emaUpM and emaUpL
cond2 = goldenOrder
cond3 = above26_2days
cond4 = macdGCAboveZero
cond5 = volumeMouOK
cond6 = candleOK
cond7 = pullbackOK
cond8 = pullbackRouteOK
all8_strict = cond1 and cond2 and cond3 and cond4 and cond5 and cond6 and cond7 and cond8
final3 = pinbar and macdGCAboveZero and volumeStrongOK
kaku = all8_strict and final3
// =========================
// Entry (strategy)
// =========================
entrySignal = entryMode == "KAKU only" ? kaku : (mou or kaku)
canEnter = strategy.position_size == 0
newEntryKaku = canEnter and kaku and entrySignal
newEntryMouB = canEnter and (not kaku) and mou_breakout and entrySignal
newEntryMou = canEnter and (not kaku) and mou_pullback and entrySignal
// --- Publish Assist(保険エントリー) ---
// 条件が厳しすぎて「トレード0件」だと投稿時に警告が出る。
// closedtradesが0の間だけ、軽いEMAクロスで1回だけ拾う(その後は沈黙)。
assistFast = ta.ema(close, 5)
assistSlow = ta.ema(close, 20)
assistEntry = publishAssist and strategy.closedtrades == 0 and canEnter and ta.crossover(assistFast, assistSlow)
// 実エントリー
if newEntryKaku or newEntryMouB or newEntryMou or assistEntry
strategy.entry("LONG", strategy.long)
// ラベル(視認)
if showMouLabels and newEntryMou
label.new(bar_index, low, "猛(IN)", style=label.style_label_up, color=color.new(color.lime, 0), textcolor=color.black)
if showMouLabels and newEntryMouB
label.new(bar_index, low, "猛B(IN)", style=label.style_label_up, color=color.new(color.lime, 0), textcolor=color.black)
if showKakuLabels and newEntryKaku
label.new(bar_index, low, "確(IN)", style=label.style_label_up, color=color.new(color.yellow, 0), textcolor=color.black)
if assistEntry
label.new(bar_index, low, "ASSIST(IN)", style=label.style_label_up, color=color.new(color.aqua, 0), textcolor=color.black)
// =========================
// Exit (TP/SL + 強制クローズ)
// =========================
inPos = strategy.position_size > 0
tpPx = inPos ? strategy.position_avg_price * (1.0 + tpPct/100.0) : na
slPx = inPos ? strategy.position_avg_price * (1.0 - slPct/100.0) : na
if enableTPSL
strategy.exit("TP/SL", from_entry="LONG", limit=tpPx, stop=slPx)
// 最大保有バーで強制決済(これが「レポート無し」回避の最後の保険)
var int entryBar = na
if strategy.position_size > 0 and strategy.position_size == 0
entryBar := bar_index
if strategy.position_size == 0
entryBar := na
forceClose = inPos and not na(entryBar) and (bar_index - entryBar >= maxHoldBars)
if forceClose
strategy.close("LONG")
// =========================
// 利確/損切/強制クローズのラベル
// =========================
closedThisBar = (strategy.position_size > 0) and (strategy.position_size == 0)
avgPrev = strategy.position_avg_price
tpPrev = avgPrev * (1.0 + tpPct/100.0)
slPrev = avgPrev * (1.0 - slPct/100.0)
hitTP = closedThisBar and high >= tpPrev
hitSL = closedThisBar and low <= slPrev
// 同一足TP/SL両方は厳密に判断できないので、表示は「TP優先」で簡略(投稿ギリギリ版)
if hitTP
label.new(bar_index, high, "利確", style=label.style_label_down, color=color.new(color.lime, 0), textcolor=color.black)
else if hitSL
label.new(bar_index, low, "損切", style=label.style_label_up, color=color.new(color.red, 0), textcolor=color.white)
else if closedThisBar and forceClose
label.new(bar_index, close, "時間決済", style=label.style_label_left, color=color.new(color.gray, 0), textcolor=color.white)
// =========================
// Signals (猛/猛B/確)
// =========================
plotshape(showMouLabels and mou_pullback and not kaku, title="MOU_PULLBACK", style=shape.labelup, text="猛",
color=color.new(color.lime, 0), textcolor=color.black, location=lblLoc, size=size.tiny)
plotshape(showMouLabels and mou_breakout and not kaku, title="MOU_BREAKOUT", style=shape.labelup, text="猛B",
color=color.new(color.lime, 0), textcolor=color.black, location=lblLoc, size=size.tiny)
plotshape(showKakuLabels and kaku, title="KAKU", style=shape.labelup, text="確",
color=color.new(color.yellow, 0), textcolor=color.black, location=lblLoc, size=size.small)
// =========================
// Alerts
// =========================
alertcondition(mou, title="MNO_MOU", message="MNO: MOU triggered")
alertcondition(mou_breakout, title="MNO_MOU_BREAKOUT", message="MNO: MOU Breakout triggered")
alertcondition(mou_pullback, title="MNO_MOU_PULLBACK", message="MNO: MOU Pullback triggered")
alertcondition(kaku, title="MNO_KAKU", message="MNO: KAKU triggered")
alertcondition(assistEntry, title="MNO_ASSIST_ENTRY", message="MNO: ASSIST ENTRY (publish safety)")
// =========================
// Status label(最終足に必ず表示)
// =========================
var label status = na
if showStatusLbl and barstate.islast
label.delete(status)
statusTxt =
"MNO RUNNING " +
"ClosedTrades: " + str.tostring(strategy.closedtrades) + " " +
"BaseTrend: " + (baseTrendOK ? "OK" : "NO") + " " +
"MOU: " + (mou ? "YES" : "no") + " (猛=" + (mou_pullback ? "Y" : "n") + " / 猛B=" + (mou_breakout ? "Y" : "n") + ") " +
"KAKU: " + (kaku ? "YES" : "no") + " " +
"VolRatio: " + (na(volRatio) ? "na" : str.tostring(volRatio, format.mintick)) + " " +
"Pull%: " + (na(pullbackPct) ? "na" : str.tostring(pullbackPct, format.mintick)) + " " +
"Pos: " + (inPos ? "IN" : "OUT")
status := label.new(bar_index, high, statusTxt, style=label.style_label_left, textcolor=color.white, color=color.new(color.black, 0))
// =========================
// Debug table(最終足のみ)
// =========================
var table t = table.new(position.top_right, 2, 14, border_width=1, border_color=color.new(color.white, 60))
fRow(_name, _cond, _r) =>
bg = _cond ? color.new(color.lime, 70) : color.new(color.red, 80)
tx = _cond ? "OK" : "NO"
table.cell(t, 0, _r, _name, text_color=color.white, bgcolor=color.new(color.black, 0))
table.cell(t, 1, _r, tx, text_color=color.white, bgcolor=bg)
if showDebugTbl and barstate.islast
table.cell(t, 0, 0, "MNO Debug", text_color=color.white, bgcolor=color.new(color.black, 0))
table.cell(t, 1, 0, "", text_color=color.white, bgcolor=color.new(color.black, 0))
fRow("BaseTrend", baseTrendOK, 1)
fRow("MOU Pullback", mou_pullback, 2)
fRow("MOU Breakout", mou_breakout, 3)
fRow("Break confirm", breakConfirm, 4)
fRow("Break big body", bigBodyOK, 5)
fRow("Break close high", closeNearHighOK, 6)
fRow("Break vol strong", volumeStrongOK, 7)
fRow("Break MACD", macdBreakOK, 8)
fRow("KAKU all8", all8_strict, 9)
fRow("KAKU final3", final3, 10)
fRow("AssistEntry", assistEntry, 11)
fRow("ClosedTrades>0", strategy.closedtrades > 0, 12)
DR/IDR Break .5 TPDR/IDR Extension Breakout with Custom Stop
This strategy is a systematic, counter-trend, and momentum-based system designed for intraday trading. It operates on the principle of an Opening Range Breakout (ORB), utilizing the initial market consolidation to project high-probability targets, while offering multiple methods for managing risk.
1. Market Identification (The Opening Range)
The strategy begins by defining the market's initial boundaries and volatility:
Session Window: The strategy calculates the Opening Range (OR) over a user-defined time period (default: 9:30 AM to 10:30 AM New York Time).
ORB Levels: Two key price levels are established and locked once the time window closes:
Wick High/Low: The absolute highest and lowest prices of the session. These serve as the entry trigger lines.
Body High/Low (Shaded Range): The highest and lowest open/close prices of the session. The height of this range is used to calculate the Take Profit and Stop Loss levels.
2. Entry Rule (The Breakout)
The strategy is passive until the range is violated, looking for a strong move out of the consolidation area.
Trigger Condition: A trade is signaled when a candle closes either:
Above the Wick High (for a Long entry).
Below the Wick Low (for a Short entry).
Execution: The entry is a Market Order executed on the candle that meets the trigger condition, subject to a user-defined Entry Delay (default 0 bars, meaning the entry is taken immediately upon the breakout candle's close).
Direction Control: The user can select to trade Long Only, Short Only, or Both.
3. Exit and Risk Management
All trades are placed with simultaneous Take Profit and Stop Loss orders (a bracket order) once the entry is filled.
A. Take Profit (TP)
The Take Profit is set at the 0.5 Extension of the Shaded Range (Body Range).
Calculation: The distance from the Body High/Low to the TP level is exactly 50% of the total height of the Shaded Range.
B. Stop Loss (SL)
The Stop Loss is dynamically calculated based on a user-selected method for risk control:
Range 0.5 (Body Range): The Stop Loss is placed an equal distance (0.5 times the Body Range height) outside the opposite side of the Body Range.
Example (Long): If entry is above the Wick High, the SL is set 0.5 times the Body Range height below the Body Low.
ATR Multiple: The Stop Loss distance is determined by the asset's recent volatility.
Calculation: The distance is calculated as a user-defined Multiplier (default 2.0) times the Average True Range (ATR).
Recent Swing Low/High: The Stop Loss is placed based on a structural level defined by recent price action.
Long Entry: SL is placed at the Lowest Swing Low within a user-defined lookback period.
Short Entry: SL is placed at the Highest Swing High within a user-defined lookback period.
Summary of Workflow
The market sets the Wick and Body boundaries (e.g., 9:30–10:30 AM).
Price breaks and closes beyond a Wick boundary, triggering a signal.
The trade enters after the specified delay.
A bracket order is placed: TP is fixed at the 0.5 Extension, and SL is set based on the user's chosen risk method.
The trade is closed upon reaching either the TP or the SL level.

Multi-MA + RSI Pullback Strategy (Jordan)1️⃣ Strategy logic I’ll code
From your screenshots:
Indicators
• EMAs: 600 / 200 / 100 / 50
• RSI: length 6, levels 80 / 20
Rules (simplified so a script can handle them):
• Use a higher-timeframe trend filter (15m or 1h) using the EMAs.
• Take entries on the chart timeframe (you can use 1m or 5m).
• Long:
• Higher-TF trend is up.
• Price is pulling back into a zone (between 50 EMA and 100 EMA on the entry timeframe – this approximates your 50–61% retrace).
• RSI crosses below 20 (oversold).
• Short:
• Higher-TF trend is down.
• Price pulls back between 50 & 100 EMAs.
• RSI crosses above 80 (overbought).
• Exits: ATR-based stop + take-profit with adjustable R:R (2:1 or 3:1).
• Max 4 trades per day.
News filter & “only trade gold” you handle manually (run it on XAUUSD and avoid news times yourself – TradingView can’t read the economic calendar from code).

Simple ICT Sweep + FVG (LuxAlgo Swings FIXED)something i created if anyone can improve it or change for better visual

NQ BB+PS StrategyBollinger Band and ProScalper combined strategy/indicators. Designed to take quick 1:1 Risk to Reward trades. Entry on close of signal bar, set auto SL and TP levels to 50 ticks. If a signal in the opposing direction populates, close open trade and follow current signal or simply reverse positions. There is a "+" Sign above signals that fire in the direction of the current EMA trend signaling an A+ set up. Recommended following the first 4-6 signals of the day prior to 11am before the mid day "chop".

Optimized BTC Mean Reversion (RSI 20/65)📈 Optimized BTC Mean Reversion (RSI 20/65)
Optimized BTC Mean Reversion (RSI 20/65) is a rule-based trading strategy designed to capture mean-reversion moves in strong market structures, primarily optimized for Bitcoin, but adaptable to other liquid cryptocurrencies.
The strategy combines RSI extremes, Stochastic momentum, and EMA trend filtering to identify high-probability reversal zones while maintaining strict risk management.
🔍 Strategy Logic
This system focuses on entering trades when price temporarily deviates from equilibrium, while still respecting the broader trend.
✅ Long Conditions
RSI below 20 (oversold)
Stochastic below 25
Price trading above the 200 EMA (or within a controlled deviation)
Designed to buy sharp pullbacks in bullish conditions
❌ Short Conditions
RSI above 65 (overbought)
Stochastic above 75
Price trading below the 200 EMA
Designed to sell relief rallies in bearish conditions
🛡 Risk Management
Fixed Stop Loss: 4%
Fixed Take Profit: 6%
Risk/Reward: 1 : 1.5
No pyramiding (single position at a time)
Full equity position sizing (adjustable)
All exits are predefined at entry, ensuring consistency and emotional discipline.
📊 Indicators Used
200 EMA – Trend direction filter
RSI (14) – Mean-reversion trigger (20 / 65 levels)
Stochastic Oscillator – Momentum confirmation
👁 Visual Features
EMA plotted directly on chart
Real-time Stop Loss, Take Profit, and Entry Price lines
Clear long/short entry markers
Works on all timeframes (optimized for intraday and swing trading)
🔔 Alerts
Long entry alerts
Short entry alerts
(Perfect for automation or discretionary execution)
⚠️ Disclaimer
This strategy is intended for educational and research purposes only. Past performance does not guarantee future results. Always test on a demo account and adjust risk parameters to your own trading plan.

Hammer Strategy (CLOSE ON NEXT BAR) [WORKING]Adjustable hammer and inverted hammer candle
Ham? INV? is the hammer
Entry on HAM, INV OR HAM?, INV? close next bar

VWAP Mean Reversion (RSI + Deviation + ATR Risk)33this is an indicator that relies on other indicators. it relies on volume price action fvgs.OBS. and standard deviations.

VWAP Mean Reversion v2 nice indicator based on volume and price action. it pays attention to RSI ema.VWAP. and many more indicators

Volatility Trend FollowerThe script combines several classic technical analysis techniques:
SuperTrend / Adaptive Band - The main idea comes from the SuperTrend indicator, which uses ATR (Average True Range) to create a trailing band that adapts to volatility
ATR (Average True Range) - A volatility measure developed by J. Welles Wilder Jr.
EMA (Exponential Moving Average) - Used as a global trend filter
Heikin Ashi - An option to smooth prices and reduce noise

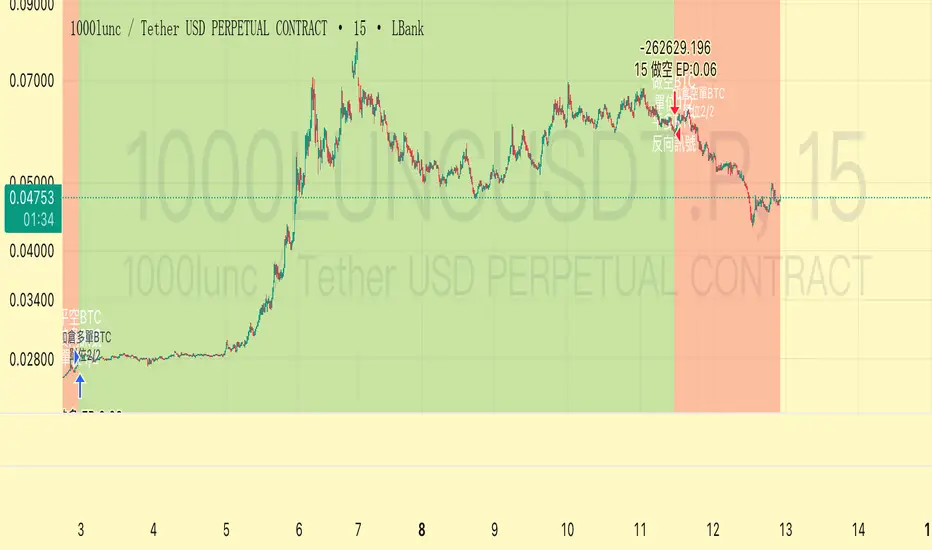
Trend Following $BTC - Multi-Timeframe Structure + ReversTREND FOLLOWING STRATEGY - MULTI-TIMEFRAME STRUCTURE BREAKOUT SYSTEM
Strategy Overview
This is an enhanced Turtle Trading system designed for cryptocurrency spot trading. It combines Donchian Channel breakouts with multi-timeframe structure filtering and ATR-based dynamic risk management. The strategy trades both long and short positions using reverse signal exits to maximize trend capture.
Core Features
Multi-Timeframe Structure Filtering
The strategy uses Swing High/Low analysis to identify market structure trends. You can customize the structure timeframe (default: 3 minutes) to match your trading style. Only enters trades aligned with the identified trend direction, avoiding counter-trend positions that often lead to losses.
Reverse Signal Exit System
Instead of using fixed stop-losses or time-based exits, this strategy exits positions only when a reverse entry signal triggers. This approach maximizes trend profits and reduces premature exits during normal market retracements.
ATR Dynamic Pyramiding
Automatically adds positions when price moves 0.5 ATR in your favor. Supports up to 2 units maximum (adjustable). This pyramid scaling enhances profitability during strong trends while maintaining disciplined risk management.
Complete Risk Management
Fixed position sizing at 5000 USD per unit. Includes realistic commission fees of 0.06% (Binance spot rate). Initial capital set at 10,000 USD. All backtest parameters reflect real-world trading conditions.
Trading Logic
Entry Conditions
Long Entry: Close price breaks above the 20-period high AND structure trend is bullish (price breaks above Swing High)
Short Entry: Close price breaks below the 20-period low AND structure trend is bearish (price breaks below Swing Low)
Position Scaling
Long positions: Add when price rises 0.5 ATR or more
Short positions: Add when price falls 0.5 ATR or more
Maximum 2 units including initial entry
Exit Conditions
Long Exit: Triggers when short entry signal appears (price breaks 20-period low + structure turns bearish)
Short Exit: Triggers when long entry signal appears (price breaks 20-period high + structure turns bullish)
Default Parameters
Channel Settings
Entry Channel Period: 20 (Donchian Channel breakout period)
Exit Channel Period: 10 (reserved parameter)
ATR Settings
ATR Period: 20
Stop Loss ATR Multiplier: 2.0
Add Position ATR Multiplier: 0.5
Structure Filter
Swing Length: 300 (Swing High/Low calculation period)
Structure Timeframe: 3 minutes
Adjust these based on your trading timeframe and asset volatility
Position Management
Maximum Units: 2 (including initial entry)
Capital Per Unit: 5000 USD
Visualization Features
Background Colors
Light Green: Bullish market structure
Light Red: Bearish market structure
Dark Green: Long position entry
Dark Red: Short position entry
Optional Display Elements (Default: OFF)
Entry and exit channel lines
Structure high/low reference lines
ATR stop-loss indicator
Next position add level
Entry/exit labels
Alert Message Format
The strategy sends notifications with the following format:
Entry: "5m Long EP:90450.50"
Add Position: "15m Add Long 2/2 EP:91000.25"
Exit: "5m Close Long Reverse Signal"
Where the first part shows your current chart timeframe and EP indicates Entry Price
Backtest Settings
Capital Allocation
Initial Capital: 10,000 USD
Per Entry: 5,000 USD (split into 2 potential entries)
Leverage: 0x (spot trading only)
Trading Costs
Commission: 0.06% (Binance spot VIP0 rate)
Slippage: 0 (adjust based on your experience)
Best Use Cases
Ideal Scenarios
Trending markets with clear directional movement
Moderate to high volatility assets
Timeframes from 1-minute to 4-hour charts
Best suited for major cryptocurrencies with good liquidity
Not Recommended For
Highly volatile choppy/ranging markets
Low liquidity small-cap coins
Extreme market conditions or black swan events
Usage Recommendations
Timeframe Guidelines
1-5 minute charts: Use for scalping, consider Swing Length 100-160
15-30 minute charts: Good for short-term trading, Swing Length 50-100
1-4 hour charts: Suitable for swing trading, Swing Length 20-50
Optimization Tips
Always backtest on historical data before live trading
Adjust swing length based on asset volatility and your timeframe
Different cryptocurrencies may require different parameter settings
Enable visualization options initially to understand entry/exit points
Monitor win rate and drawdown during backtesting
Technical Details
Built on Pine Script v6
No repainting - uses proper bar referencing with offset
Prevents lookahead bias with lookahead=off parameter
Strategy mode with accurate commission and slippage modeling
Multi-timeframe security function for structure analysis
Proper position state tracking to avoid duplicate signals
Risk Disclaimer
This strategy is provided for educational and research purposes only. Past performance does not guarantee future results. Backtesting results may differ from live trading due to slippage, execution delays, and changing market conditions. The strategy performs best in trending markets and may experience drawdowns during ranging conditions. Always practice proper risk management and never risk more than you can afford to lose. It is recommended to paper trade first and start with small position sizes when going live.
How to Use
Add the strategy to your TradingView chart
Select your desired timeframe (1m to 4h recommended)
Adjust parameters based on your risk tolerance and trading style
Review backtest results in the Strategy Tester tab
Set up alerts for automated notifications
Consider paper trading before risking real capital
Tags
Trend Following, Turtle Trading, Donchian Channel, Structure Breakout, ATR, Cryptocurrency, Spot Trading, Risk Management, Pyramiding, Multi-Timeframe Analysis
---
Strategy Name: Trend Following BTC
Version: v1.0
Pine Script Version: v6
Last Updated: December 2025