Symmetrical Geometric MandalaSymmetrical Geometric Mandala
Overview
The Symmetrical Geometric Mandala is an advanced geometric trading tool that applies phi (φ) harmonic relationships to price-time analysis. This indicator automatically detects swing ranges and constructs a scale-invariant geometric framework based on the square root of phi (√φ), revealing natural support/resistance zones and harmonic price-time balance points.
Core Concept
Traditional technical analysis often treats price and time as separate dimensions. This indicator harmonizes them using the mathematical constant √φ (approximately 1.272), creating a geometric "squaring" of price and time that remains proportionally consistent across different chart scales.
The Mathematics
When you select a price range (from swing low to swing high or vice versa), the indicator calculates:
PBR (Price-to-Bar Ratio) = Range / Number of Bars
Harmonic PBR = PBR × √φ (1.272019649514069)
Phi Extension = Range × φ (1.618033988749895)
The Harmonic PBR is the critical value - this is the chart scaling factor that creates perfect geometric harmony between price and time for your selected range.
Visual Components
1. Horizontal Boundary Lines
Two horizontal lines extend from the selected range at a distance of Range × φ (golden ratio extension):
Upper line: Extended above the swing high (for uplegs) or swing low (for downlegs)
Lower line: Extended below the swing low (for uplegs) or swing high (for downlegs)
These lines mark the natural harmonic boundaries of the price movement.
2. Rectangle Diagonal Lines
Two diagonal lines that create a "rectangle" effect, connecting:
Overlap points on horizontal boundaries to swing extremes
These lines go in the opposite direction of the price leg (creating the symmetrical mandala pattern)
When extended, they reveal future geometric support/resistance zones
3. Phi Harmonic Circles (Optional)
Two precisely calculated circles (drawn as smooth polylines):
Circle A: Centered at the first swing extreme (Nodal A)
Circle B: Centered at the second swing extreme (Nodal B)
Radius = Range × φ, causing them to perfectly touch the horizontal boundary lines
These circles visualize the geometric harmony and create a mandala-like pattern that reveals natural price zones.
How to Use
Step 1: Select Your Range
Set the Start Date at your swing low or swing high
Set the End Date at the opposite extreme
The indicator automatically detects whether it's an upleg or downleg
Step 2: Read the Harmonic PBR
Check the highlighted yellow row in the table: "PBR × √φ"
This is your chart scaling value
Step 3: Apply Chart Scaling (Optional)
For perfect geometric visualization:
Right-click on your chart's price axis
Select "Scale price chart only"
Enter the PBR × √φ value
The geometry will now display in perfect harmonic proportion
Step 4: Interpret the Geometry
Horizontal lines: Key support/resistance zones at phi extensions
Diagonal lines: Dynamic trend channels and future price-time balance points
Circle intersections: Natural harmonic turning points
Central diamond area: Core price-time equilibrium zone
Key Features
✅ Automatic swing detection - identifies upleg/downleg automatically
✅ Scale-invariant geometry - maintains proportions across timeframes
✅ Phi harmonic calculations - based on golden ratio mathematics
✅ Professional color scheme - clean, non-intrusive visuals
✅ Customizable display - toggle circles, lines, and table independently
✅ Smooth circle rendering - adjustable segments (16-360) for optimal smoothness
Settings
Show Horizontal Boundary Lines: Display phi extension levels
Show Rectangle Diagonal Lines: Display the geometric framework
Show Phi Harmonic Circles: Display circular geometry (optional)
Circle Smoothness: Adjust polyline segments (default: 96)
Colors: Fully customizable color scheme for all elements
Theory Background
This indicator draws inspiration from:
W.D. Gann's price-time squaring techniques
Bradley Cowan's geometric market analysis
Phi/golden ratio harmonic theory
Mathematical constants in market structure
Unlike traditional Fibonacci retracements, this tool uses √φ instead of φ as the primary scaling constant, creating a unique geometric relationship that "squares" price movement with time passage.
Best Practices
Use on significant swings - Works best on major swing highs/lows
Multiple timeframe analysis - Apply to different timeframes for confluence
Combine with other tools - Use alongside support/resistance and trend analysis
Respect the geometry - Pay attention when price interacts with geometric elements
Chart scaling optional - The geometry works at any scale, but scaling enhances visualization
Notes
The indicator draws geometry from left to right (from Nodal A to Nodal B)
All lines extend infinitely for future projections
The table shows real-time calculations for the selected range
Date range selection uses confirm dialogs to prevent accidental changes
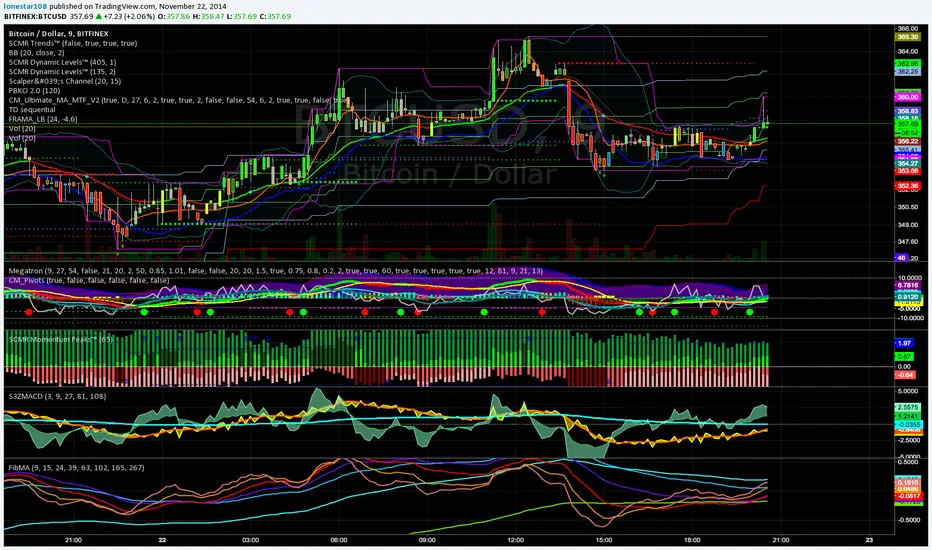
PHI

Bitcoin Golden Pi CyclesTops are signaled by the fast top MA crossing above the slow top MA, and bottoms are signaled by the slow bottom MA crossing above the fast bottom MA. Alerts can be set on top and bottom prints. Does not repaint.
Similar to the work of Philip Swift regarding the Bitcoin Pi Cycle Top, I’ve recently come across a similar mathematically curious ratio that corresponds to Bitcoin cycle bottoms. This ratio was extracted from skirmantas’ Bitcoin Super Cycle indicator . Cycle bottoms are signaled when the 700D SMA crosses above the 137D SMA (because this indicator is closed source, these moving averages were reverse-engineered). Such crossings have historically coincided with the January 2015 and December 2018 bottoms. Also, although yet to be confirmed as a bottom, a cross occurred June 19, 2022 (two days prior to this article)
The original pi cycle uses the doubled 350D SMA and the 111D SMA . As pointed out this gives the original pi cycle top ratio:
350/111 = 3.1532 ≈ π
Also, as noted by Swift, 111 is the best integer for dividing 350 to approximate π. What is mathematically interesting about skirmanta’s ratio?
700/138 = 5.1095
After playing around with this for a while I realized that 5.11 is very close to the product of the two most numerologically significant geometrical constants, π and the golden ratio, ϕ:
πϕ = 5.0832
However, 138 turns out to be the best integer denominator to approximate πϕ:
700/138 = 5.0725 ≈ πϕ
This is what I’ve dubbed the Bitcoin Golden Pi Bottom Ratio.
In the spirit of numerology I must mention that 137 does have some things going for it: it’s a prime number and is very famously almost exactly the reciprocal of the fine structure constant (α is within 0.03% of 1/137).
Now why 350 and 700 and not say 360 and 720? After all, 360 is obviously much more numerologically significant than 350, which is proven by the fact that 360 has its own wikipedia page, and 350 does not! Using 360/115 and 720/142, which are also approximations of π and πϕ respectively, this also calls cycle tops and bottoms.
There are infinitely many such ratios that could work to approximate π and πϕ (although there are a finite number whose daily moving averages are defined). Further analysis is needed to find the range(s) of numerators (the numerator determines the denominator when maintaining the ratio) that correctly produce bottom and top signals.

Divina - Support and ResistanceGiven the positive feedback received on the first Dynamic Support/Resistance script, I've decided to rewrite it on Pine Script v5 and publish it with open source code.
The main Divina area (box) is derived from change in price and volume, while the other support and resistance levels are based on the golden ratio (Divina proportione) or Fibonacci numbers.
The box will start to paint if the previous closed bar satisfy a condition and it will be never be repainted in the future. Anyway the box and the levels will be extended until a new signal is detected.
The Divina Support and Resistance will help you to find good price zones on wich the market might take trading decision. It is not a strategy by per se, it should be used with other good trading techniques.

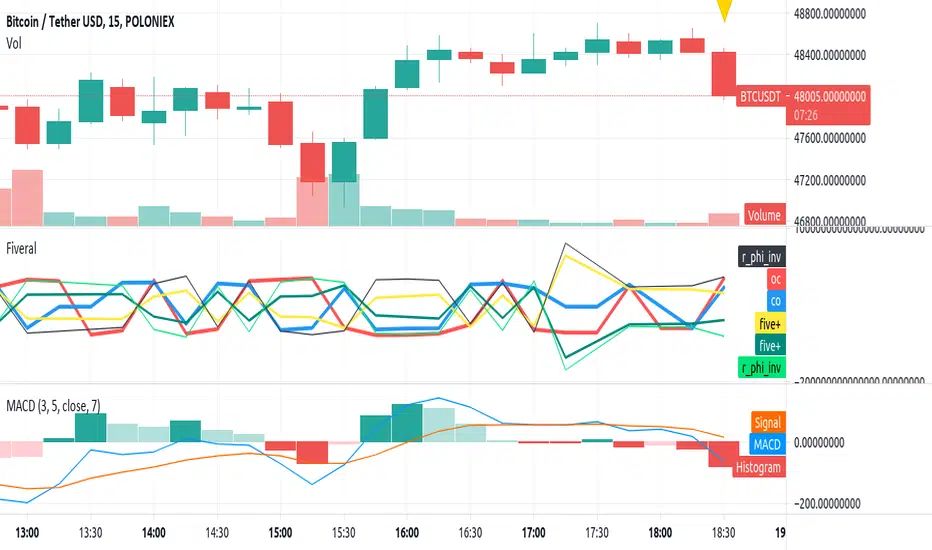
Fiveral: Repulsion/Golden Radio HackAnother in a series of experimental indicators using logarithmic scale visualisation.
This one extends into some work on I've been doing on 'the cube', but Pine isn't liking multiple log lines even when the equations are included for each plotted variable, meaning, no variables used in the definition of a variable, as is done here. As a result, accuracy of this indicator can't be guaranteed between scales, or during use.
Have at it, and enjoy!
Golden Ratio MultiplesI call this "Phi Ribbons." The Golden Ratio, also known as Phi, is fantastic at predicting areas of price reversal.
Every moving average is a fibonacci multiple of the base function 355 SMA .
The rainbow above is an array of fibonacci multiples that are greater than one (1.618, 2, 2.618, 3, 5, 8, 13, 21)
The rainbow below is an array of fibonacci multiples that are less than one (0.786, 0.618, 0.5, 0.382, 0.236, 0.14)
Notice the precision of marking areas of potential price reversals
EASTER EGG: The two moving averages at the top of the script are 355 SMA & 113 SMA . This is one of the lowest ratios that closely approximates Pi (3.14159).
Simply plotting the 133 SMA will add a unique feature:
355/133 = 3.14159
When the 113 crosses below the 355 it tends to mark the end of major bullish impulses, and a crossover is a bullish sign.

EMA & SMA with FRACTAL DEVIATION BANDS by @XeL_ArjonaEMA & SMA with FRACTAL DEVIATION BANDS
Ver. 1.0.25.08.2015
By Ricardo M Arjona @XeL_Arjona
DISCLAIMER:
DISCLAIMER:
The Following indicator/code IS NOT intended to be a formal investment advice or recommendation by the author, nor should be construed as such. Users will be fully responsible by their use regarding their own trading vehicles/assets. The embedded code and ideas within this work are FREELY AND PUBLICLY available on the Web for NON LUCRATIVE ACTIVITIES and must remain as is.
WHAT IS THIS?
This is the adaptation of the FRACTAL DEVIATION BANDS to be used on Traditional Moving Averages (Simple & Exponential).
ALL NEW IDEAS OR MODIFICATIONS to these indicator(s) are Welcome in favor to deploy a better and more accurate readings. I will be very glad to be notified at Twitter or TradingVew accounts at: @XeL_Arjona
Any important addition to this work MUST REMAIN PUBLIC by means of CreativeCommons CC & TradingView.
2015

PhiMACDHere is a modified moving average which uses phi as the scaling interval between moving average periods. Each MACD line is derived by determining EMAs for 8 period frames, each of which is related to the other proportionally by phi, and calculating each line by comparing it against its immediate predecessor. Actual period values are 9 15 24 39 63 102 165 and 267