Cycles DividerCycles divider draws vertical lines that divide the chart into 4 cycles on each cycle for the QTIndicatorby Gauntlet_Man12
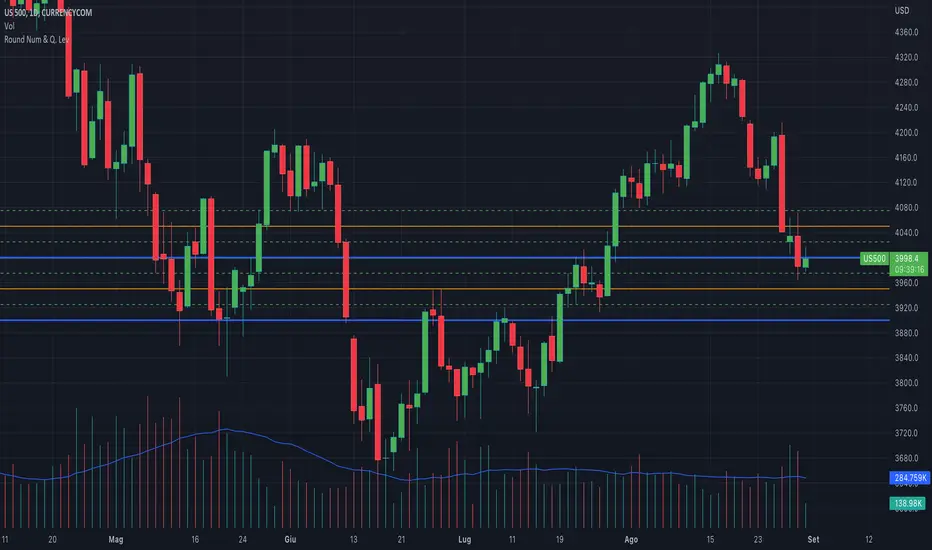
Round NumbersRound Numbers highlights the key psychological price levels around the current market by drawing round, half, and quarter number levels around price. The goal is simple: make round numbers easier to see, improve chart readability, and help you stay visually oriented without cluttering the chart with unrelated logic. How it works Automatically adapts level spacing across different markets using daily range and decimal-place anchoring. Works with Forex, cryptocurrencies, indices, commoditiIndicatorby PriceFirstUpdated 682
Temporal Bias Architect [JOAT]Temporal Bias Architect Introduction Temporal Bias Architect is an open-source time-structure indicator that maps price action onto three nested cycle frameworks simultaneously: weekly, daily, and 90-minute. Each framework divides its period into four sequential phases — Accumulation (A), Manipulation (M), Distribution (D), and Continuation/Reversal (X) — derived from Daye Quarterly Theory. These phases correspond to observable behavioral patterns at each time level: accumulation of positiIndicatorby officialjackofalltrades29
Quarterly Theory: Intraday Quarters - 6h Sessions, 90m & 22.5mThis indicator is a significantly modified and expanded version of the 90 Minute Cycle by HandlesHandled. It has been redesigned to align with Quarterly Theory principles while ensuring full compliance with TradingView’s House Rules regarding modified scripts by providing original functionality and a unified user interface. Core Enhancements & Original Features While the foundational 90-minute session times are derived from the original source, this version introduces several exclusive features:Indicatorby RichBvwyUpdated 6211
Quarterly Divider The "Quarterly Divider" script draws vertical lines at the start of each quarter (January, April, July, October) on the Trading View chart. It also labels each line with the corresponding quarter (Q1, Q2, Q3, Q4) at the bottom of the line, making it easy to visualize the start of each trading quarter. The color and thickness of the lines are customizable NB. works effectively is used on the weekly timeframe Indicatorby TheClairvoyant_TraderUpdated 70
OCM Quarter Point Autopilot - A Multi-Timeframe Quarter TheoryDescription: The OCM Quarter Point Autopilot indicator automates the application of Quarters Theory across multiple timeframes and instruments. It creates a comprehensive grid of support and resistance levels based on two user-defined price points (Monthly QTPs). Key Features: - Automatically calculates and displays quarter points across 5 timeframes: • Monthly (Black lines) • Weekly (Blue lines) • Daily (Green lines) • 4-Hour (Red lines) • 1-Hour (Purple lines) - Shows both upper anIndicatorby CandlesofKarmaUpdated 1100
Range SlicerThis is a tool I quickly put together to work along side of my round number and Quarter Theory Scripts. This script allows you to set a price range between to values and slice them up into equal price zones. Happy Trading!Indicatorby melodicfishUpdated 108
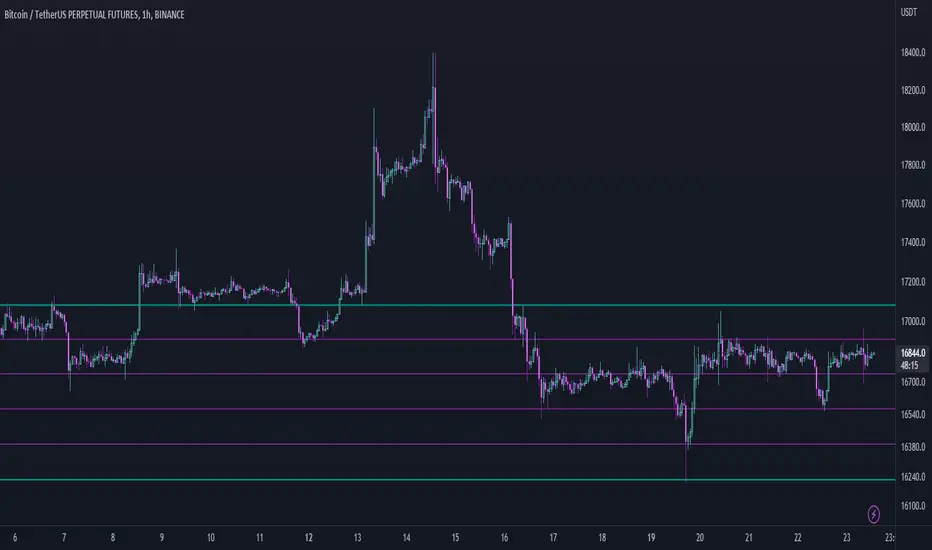
Quarter Theory LevelsQuarter Theory Levels is a script that will create level lines based on major round numbers and spilt those levels into half and quarter ranges. This tool is intended to help traders see major levels that price will likely react to in the future. The Script is inspired by Quarters Theory. Indicatorby melodicfishUpdated 1337
Round Numbers and Quarter LevelsThis script is based on "Round Numbers Above and Below" by BitcoinJesus-Not-Roger-Ver, but unlike this script that only shows "Round Numbers" levels, my script also shows "Quarter Number" levels like 25 and 75 that are very important for those who follow the quarters theory. Also the original script doesn't have different colors for different levels while my script has different colors and different styles for every level, this way it will be much easyer to recognize the levels at first sight. Indicatorby bluebeardit7 1.6 K
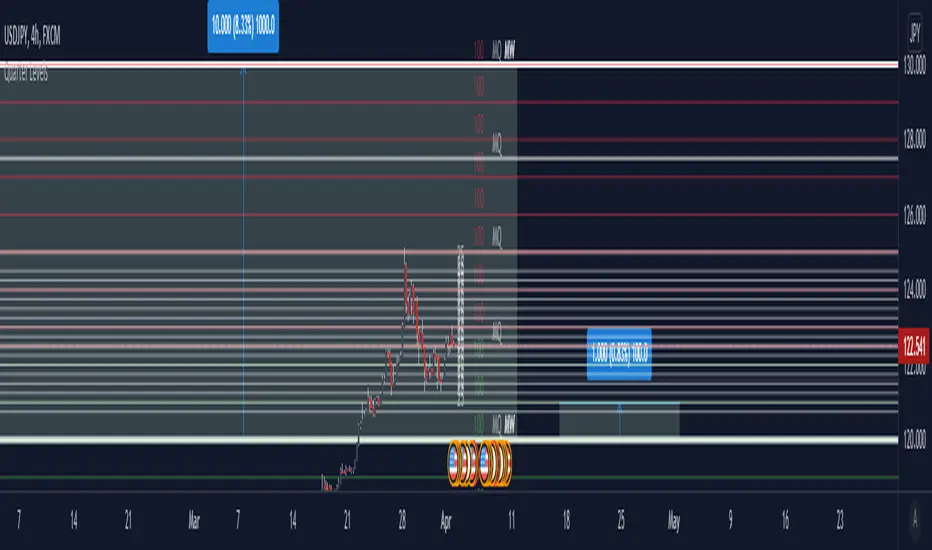
Institutional Price LevelsInstitutional price levels (AKA round numbers, Perfect Price Levels-PPL) Institutional Price Levels (IPL) script shows the closest round numbers from the current price. Some traders uses round numbers as a support resistance levels. For example: 0.000 0.500 1.000 levels. Additional levels are 0.200 0.800. So I made a simple script that shows round numbers and the quarter levels(Not exactly quarter but minor levels) Quarter level option is planned on next update. Default range is 300 pips andIndicatorby MunkhturUpdated 8617
MTF previous high and low quarter levelsDescription An experimental script that prints quarter levels of the previous timeframe's high and low to the current timeframe. The idea is quite simple and is basically the Fibonacci pivoted on the previous high and low with quarter level settings (0,0.25,0.5,0.75,1 etc). The default setting is the previous daily high and low but can be customized on user discretion. New quarter levels are printed after the close of the previous timeframe and open of the new timeframe (user's timeframe settIndicatorby geneclash1177
Quarter theory and whole numbersThis is an indicator that marks off Major whole/quarter levels Between each major whole they are 1000 pips and that can be quarter and give you major quarter levels of 250 pips Each of the major whole number can be divided into 10 - 100 pip ranges(giving you minor whole number), and you can in turn quarter these to give you 25 pips. This is the lowest value you would need as price moves in 25 pip. You can use this on any market as long as you can figure out the conversion from priceIndicatorby Rain53698295
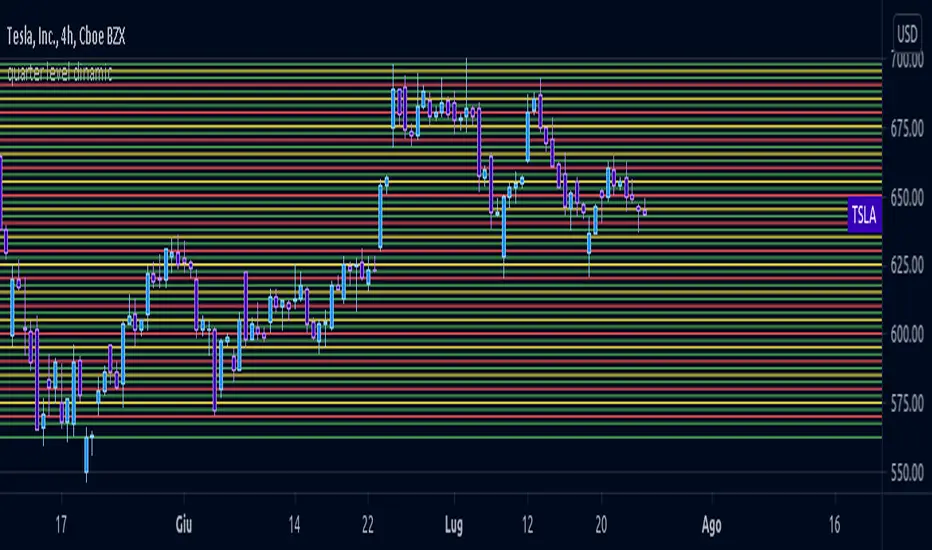
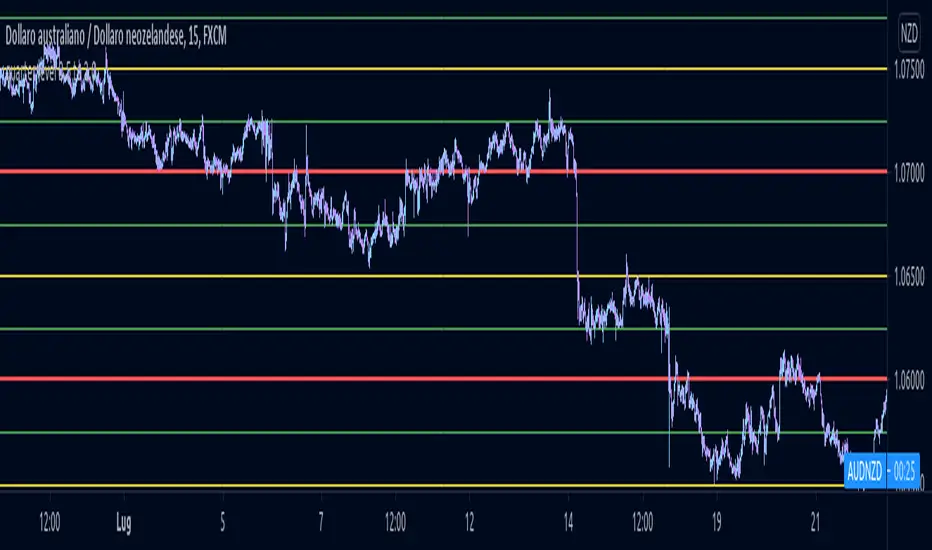
quarter level dinamicLimited quarter level script but more flexible in compared to my FX script, same logic behindIndicatorby SimoneMicucci00164
quarter level 0.5 to 2.0This script could help to see edged level for a reverse on forex, not for yen pairs and is based on quarter and round number theory. I suggest to use it on H4 timeframe or lower to have a confermation on support or resistance level.Indicatorby SimoneMicucci005278
Automated Quarters Theory With BTC and ETHThis is based on "Automatic Quarters Theory Lines" by monzakaamera. Added calculations for BTC and ETH and fixed script to work on the weekends. Indicatorby kkudumuUpdated 128
Evan Cabral's Quarter Theory by MrTuanDoanThis indicator is based on Evan Cabral's Market Timing Strategy. In Binary Option or High Frequency Forex (HFX), it's very common to see the market make reversals at hours and half hours. This indicator just simply draw vertical lines at each quarter of the hour. You should change the color and opacity to fit your chart style. With this indicator, you're going to know when to positions yourself with more accuracy on trade setups. Note It works best if you take your reversal trade at tIndicatorby MrTuanDoanUpdated 2209
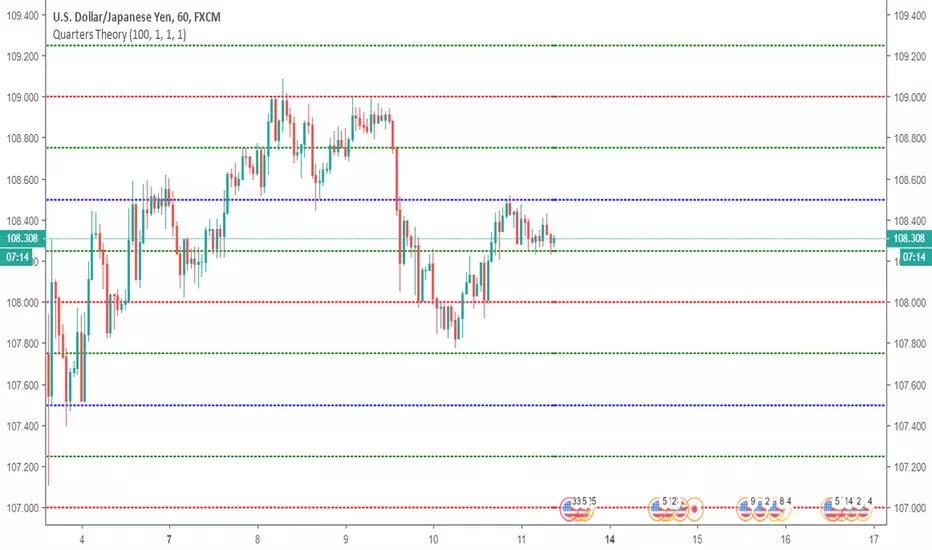
Automatic Quarters Theory Lines This indicator puts Quarter Theory lines on your chart. Works on any chart. You can change how many pips is one whole level and disable Quarter and Half levels. Works very well on JPY pairs. Indicatorby monzakaamera14 1.6 K
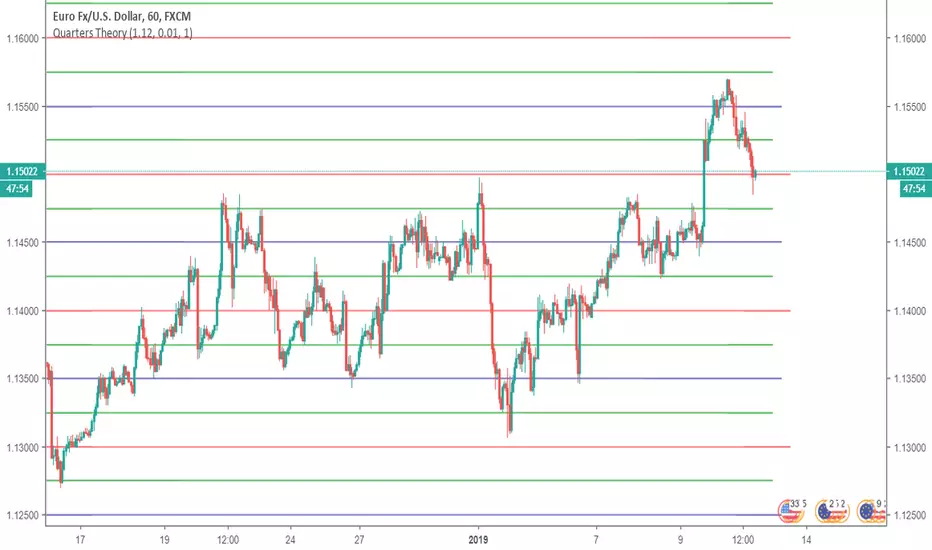
Quarters TheoryIndicator that lets you to put Whole (red), Half (blue) and Quarter (green) levels on a chart, which work as support/resistance levels. Defaults are only for EURUSD, for other symbols you have to change the settings. First input is "Starting Price (Bottom)", which should be the lowest point you want your levels to be. There are only 10 Whole levels on this indicator, but if you want you could add them from pine editor. The next input is "Next Whole Level" this is the price from one whole level tIndicatorby monzakaamera1387
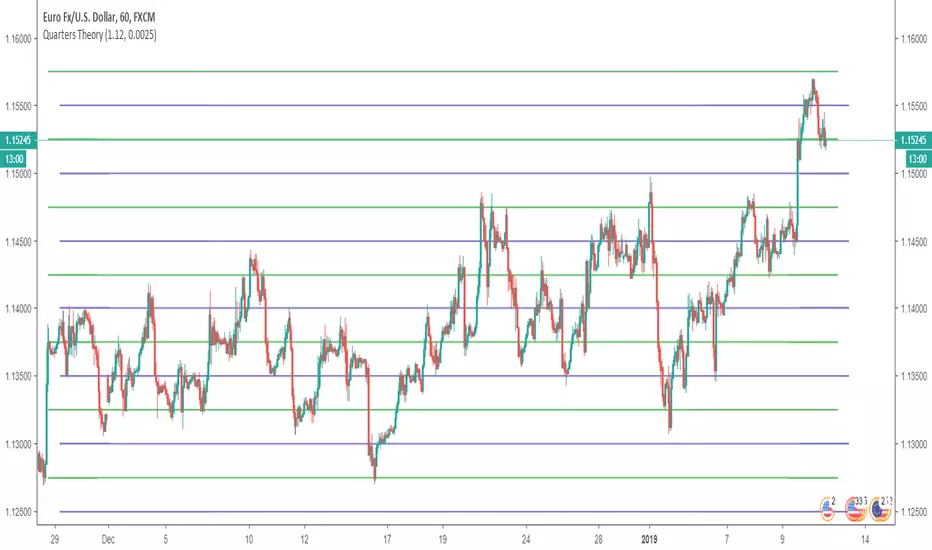
Quarters TheoryThis indicator helps you to put Quarter Theory lines on your chart. It's defaults are meant for EURUSD , but you can change it for other charts. There are 16 lines in this indicator. For EURUSD recommended settings right now are: Starting Price (Bottom):1.12 and Gap: 0.0025 USDCAD: Starting Price (Bottom):1.315 and Gap: 0.005 EURAUD: Starting Price (Bottom):1.59 and Gap: 0.005 USDJPY: Starting Price (Bottom):107 and Gap: 0.5 USDCHF: Starting Price (Bottom):0.97 and Gap: 0.0025 BTCUSD: StaIndicatorby monzakaameraUpdated 2334
Horizontal LinesHorizontal lines help you to put Quarter Theory lines on your chart. It's defaults are meant for EURUSD , but you can change it for other charts. There are 16 lines in this indicator. For EURUSD recommended settings right now are: Starting Price (Bottom):1.12 and Gap: 0.0025 USDCAD: Starting Price (Bottom):1.315 and Gap: 0.005 EURAUD: Starting Price (Bottom):1.59 and Gap: 0.005 USDJPY: Starting Price (Bottom):107 and Gap: 0.5 USDCHF: Starting Price (Bottom):0.97 and Gap: 0.0025 BTCUSD: StIndicatorby monzakaameraUpdated 3889
Quarters TheoryThis is a simple Quarters Theory script. Works best by default with JPY pairs. You can adjust to better fit your chart.Indicatorby rmunoz311