Liquidity Entry Triggers (4-Model System) | WarRoomXYZLiquidity Entry Triggers is an open-source, price-action-based analytical framework designed to highlight recurring institutional liquidity behaviors that appear across all liquid markets.
The script focuses on how and where liquidity is taken, rather than attempting to predict direction using oscillators or lagging indicators.
It is optimized for XAUUSD, FX pairs, indices, and crypto , particularly on 1m–15m timeframes where session behavior and liquidity reactions are most visible.
This tool is not a buy/sell signal generator .
It provides contextual entry zones based on structural liquidity logic, allowing traders to apply their own execution rules.
Core Philosophy
Markets move because of:
•Trapped traders
•Forced liquidations
•Session-based liquidity cycles
•Reactions at prior institutional participation zones
This script visualizes four repeatable entry triggers that emerge from those mechanisms.
🔹 1. Failed Breakout / Trapped Trader Model
When price breaks a clearly defined range high or low, breakout traders often enter expecting continuation.
If price fails to hold outside the range and closes back inside, those traders become trapped.
The script detects:
•Breaks beyond recent highs/lows
•Immediate rejection back into the range
•Structural failure of momentum
These conditions frequently lead to mean reversion or reversal moves as trapped traders exit and fuel movement in the opposite direction.
Markers are plotted at the point of failure to highlight potential trap zones.
🔹 2. Liquidation Flush Detection
Sharp impulsive candles with abnormally large wicks often represent liquidation cascades rather than healthy trend continuation.
The script identifies liquidation behavior by measuring:
•Wick-to-body imbalance
•Sudden expansion followed by rejection
•Temporary price inefficiencies
These flushes commonly occur near:
•Session highs/lows
•Range extremes
•Trend exhaustion points
Such events often lead to rebalance moves , where price partially or fully fills the wick.
🔹 3. Orderblock Reaction Zones
Orderblocks represent areas where heavy participation occurred before a strong displacement move.
The script highlights:
•Clean bullish and bearish orderblock structures
•Zones formed during consolidation prior to expansion
•Areas likely to be defended when revisited
Orderblocks with minimal noise and clean departure are prioritized, as they often reflect institutional positioning rather than retail activity.
These zones are intended as reaction areas , not automatic entry signals.
🔹 4. London Session Liquidity Sweep Model
The London session frequently establishes the initial daily high or low.
Later in the session or during New York, price often:
•Sweeps internal liquidity around that level
•Rejects after the sweep
•Continues with the higher-timeframe bias
The script monitors London session behavior and marks:
•Liquidity runs above/below London highs and lows
•Rejections back inside the prior structure
This model is especially effective when combined with broader daily context.
🔹4. How the Components Work Together
The framework is designed as a context stack , not a checklist of signals:
Liquidity Event → Location → Timing → Trader Execution
Each model reinforces the others:
•Failed breakouts often occur after liquidity sweeps
•Liquidation wicks frequently form near orderblocks
•London sweeps often trigger failed momentum moves
•Confluence increases probability, not certainty
🔹 Practical Usage Guide
✔ Identify context
Determine whether price is approaching a range extreme, session level, or prior participation zone.
✔ Wait for a liquidity event
Look for a sweep, failed breakout, or liquidation wick.
✔ Observe reaction
Rejection, displacement, or reclaim behavior provides confirmation.
✔ Execute manually
Stops are commonly placed beyond the liquidity extreme.
Targets are typically internal liquidity, prior highs/lows, or imbalance zones.
The indicator does not manage trades or enforce rules.
Execution and risk management remain the trader’s responsibility.
🔹 5. Originality & Design Notes
This script does not replicate or bundle existing indicators.
It introduces:
•A multi-model liquidity entry framework
•Structural failed breakout detection
•Wick-based liquidation imbalance logic
•Session-aware liquidity sweep visualization
•A unified, minimal, non-lagging design
All concepts are based on observable market behavior and integrated into a single analytical tool.
🔹 6. Suitable Markets & Timeframes
Works best on:
•XAUUSD
•Major FX pairs
•Indices
•Liquid crypto markets
Recommended timeframes:
•1m
•5m
•15m
•30m
🔹7. Limitations & Notes
•This is an analytical framework , not a trading system
•All markings are confirmed at candle close (non-repainting)
•No open interest or order flow data is used
•Results depend on user interpretation and execution
•Best used alongside session bias and higher-timeframe structure
Disclaimer
This script is provided for educational and informational purposes only.
It does not constitute financial advice, investment advice, or a recommendation to buy or sell any instrument.
Trading involves risk, and losses can exceed initial deposits.
The author assumes no responsibility for trading decisions made using this tool.
Users are strongly encouraged to test this script in demo or simulation environments and to apply proper risk management, position sizing, and personal discretion at all times.
By using this script, you acknowledge and accept all associated risks.
Scripts

Aroon + Chaiki OscillatorThis is an Chaiki Oscillator that facilitates more straightforward trendline analysis utilizing the Aroon setup for bars.
This is a simple Pinescript designed for incorporation into your charting analysis.
As always, none of this is investment or financial advice. Please do your own due diligence and research.

Correlation HeatMap [TradingFinder] Sessions Data Science Stats🔵 Introduction
n financial markets, correlation describes the statistical relationship between the price movements of two assets and how they interact over time. It plays a key role in both trading and investing by helping analyze asset behavior, manage portfolio risk, and understand intermarket dynamics. The Correlation Heatmap is a visual tool that shows how the correlation between multiple assets and a central reference asset (the Main Symbol) changes over time.
It supports four market types forex, stocks, crypto, and a custom mode making it adaptable to different trading environments. The heatmap uses a color-coded grid where warmer tones represent stronger negative correlations and cooler tones indicate stronger positive ones. This intuitive color system allows traders to quickly identify when assets move together or diverge, offering real-time insights that go beyond traditional correlation tables.
🟣 How to Interpret the Heatmap Visually ?
Each cell represents the correlation between the main symbol and one compared asset at a specific time.
Warm colors (e.g. red, orange) suggest strong negative correlation as one asset rises, the other tends to fall.
Cool colors (e.g. blue, green) suggest strong positive correlation both assets tend to move in the same direction.
Lighter shades indicate weaker correlations, while darker shades indicate stronger correlations.
The heatmap updates over time, allowing users to detect changes in correlation during market events or trading sessions.
One of the standout features of this indicator is its ability to overlay global market sessions such as Tokyo, London, New York, or major equity opens directly onto the heatmap timeline. This alignment lets traders observe how correlation structures respond to real-world session changes. For example, they can spot when assets shift from being inversely correlated to moving together as a new session opens, potentially signaling new momentum or macro flow. The customizable symbol setup (including up to 20 compared assets) makes it ideal not only for forex and crypto traders but also for multi-asset and sector-based stock analysis.
🟣 Use Cases and Advantages
Analyze sector rotation in equities by tracking correlation to major indices like SPX or DJI.
Monitor altcoin behavior relative to Bitcoin to find early entry opportunities in crypto markets.
Detect changes in currency alignment with DXY across trading sessions in forex.
Identify correlation breakdowns during market volatility, signaling possible new trends.
Use correlation shifts as confirmation for trade setups or to hedge multi-asset exposure
🔵 How to Use
Correlation is one of the core concepts in financial analysis and allows traders to understand how assets behave in relation to one another. The Correlation Heatmap extends this idea by going beyond a simple number or static matrix. Instead, it presents a dynamic visual map of how correlations shift over time.
In this indicator, a Main Symbol is selected as the reference point for analysis. In standard modes such as forex, stocks, or crypto, the symbol currently shown on the main chart is automatically used as the main symbol. This allows users to begin correlation analysis right away without adjusting any settings.
The horizontal axis of the heatmap shows time, while the vertical axis lists the selected assets. Each cell on the heatmap shows the correlation between that asset and the main symbol at a given moment.
This approach is especially useful for intermarket analysis. In forex, for example, tracking how currency pairs like OANDA:EURUSD EURUSD, FX:GBPUSD GBPUSD, and PEPPERSTONE:AUDUSD AUDUSD correlate with TVC:DXY DXY can give insight into broader capital flow.
If these pairs start showing increasing positive correlation with DXY say, shifting from blue to light green it could signal the start of a new phase or reversal. Conversely, if negative correlation fades gradually, it may suggest weakening relationships and more independent or volatile movement.
In the crypto market, watching how altcoins correlate with Bitcoin can help identify ideal entry points in secondary assets. In the stock market, analyzing how companies within the same sector move in relation to a major index like SP:SPX SPX or DJ:DJI DJI is also a highly effective technique for both technical and fundamental analysts.
This indicator not only visualizes correlation but also displays major market sessions. When enabled, this feature helps traders observe how correlation behavior changes at the start of each session, whether it's Tokyo, London, New York, or the opening of stock exchanges. Many key shifts, breakouts, or reversals tend to happen around these times, and the heatmap makes them easy to spot.
Another important feature is the market selection mode. Users can switch between forex, crypto, stocks, or custom markets and see correlation behavior specific to each one. In custom mode, users can manually select any combination of symbols for more advanced or personalized analysis. This makes the heatmap valuable not only for forex traders but also for stock traders, crypto analysts, and multi-asset strategists.
Finally, the heatmap's color-coded design helps users make sense of the data quickly. Warm colors such as red and orange reflect stronger negative correlations, while cool colors like blue and green represent stronger positive relationships. This simplicity and clarity make the tool accessible to both beginners and experienced traders.
🔵 Settings
Correlation Period: Allows you to set how many historical bars are used for calculating correlation. A higher number means a smoother, slower-moving heatmap, while a lower number makes it more responsive to recent changes.
Select Market: Lets you choose between Forex, Stock, Crypto, or Custom. In the first three options, the chart’s active symbol is automatically used as the Main Symbol. In Custom mode, you can manually define the Main Symbol and up to 20 Compared Symbols.
Show Open Session: Enables the display of major trading sessions such as Tokyo, London, New York, or equity market opening hours directly on the timeline. This helps you connect correlation shifts with real-world market activity.
Market Mode: Lets you select whether the displayed sessions relate to the forex or stock market.
🔵 Conclusion
The Correlation Heatmap is a robust and flexible tool for analyzing the relationship between assets across different markets. By tracking how correlations change in real time, traders can better identify alignment or divergence between symbols and gain valuable insights into market structure.
Support for multiple asset classes, session overlays, and intuitive visual cues make this one of the most effective tools for intermarket analysis.
Whether you’re looking to manage portfolio risk, validate entry points, or simply understand capital flow across markets, this heatmap provides a clear and actionable perspective that you can rely on.

Advanced Optimized VSA - 15 MinThis script is written in Pine Script and is designed to be run on the TradingView trading platform. It is an advanced technical analysis indicator that utilizes various methods and indicators to generate trading signals based on a Volume Spread Analysis (VSA) approach.
Here's a detailed breakdown of its functionalities:
### Customizable Parameters:
1. `scoreLabel` and `TDLabel`: Customizable labels for score and trend direction.
2. `labelColorScore` and `labelColorTD`: Colors for the score and trend direction labels.
### Base Indicators and Variables:
1. `spread`: Calculates the difference between the high and low of a candle.
2. `emaVolume`: Exponential moving average of volume over a 21-period range.
3. `rsi14`: Relative Strength Index (RSI) over a 14-period range.
4. `sma200` and `ema50`: Simple moving average over a 200-period range and exponential moving average over a 50-period range, respectively.
5. `volatility`: Calculates the 14-period Average True Range (ATR) to determine volatility.
6. `trendDirection`: Establishes the trend direction based on the SMA200.
### Risk Management:
1. `atrValue`: Calculates the value of the ATR.
2. `stopLoss` and `takeProfit`: Calculates the stop-loss and take-profit levels based on the ATR.
### MACD:
Computes the MACD line, signal line, and histogram.
### Volume Analysis:
1. `weightedVol`: Weighted volume.
2. `forceFactor`: Measures the strength of price movement in relation to volume.
### Support and Resistance:
1. `support` and `resistance`: Calculates support and resistance levels based on the most recent 50 periods.
### Liquidity Check:
1. `isLiquid`: Checks if an asset is sufficiently liquid.
### Score Calculation:
Evaluates various factors such as price position relative to support/resistance levels, RSI, MACD, strength of movement, and volatility to generate a score.
### Criteria for Final Signals:
1. `isBullSpread` and `isBearSpread`: Generates a bullish or bearish signal based on various factors, including the score, trend direction, and liquidity.
### Notifications:
Generates alert conditions for bullish and bearish signals.
### Graphical Elements:
Displays various indicators and signals on the chart, including stop-loss, take-profit, SMA200, EMA50, and support and resistance lines.
### Debugging Labels:
Shows labels on the chart for score and trend direction.
The goal is to provide a comprehensive picture of the current asset, taking into consideration various factors and generating potentially profitable trading signals.
################################################################### ITALIANO ########################################################################################
##############################################################################################################################################################################################
Questo script è scritto in Pine Script e progettato per essere eseguito sulla piattaforma di trading TradingView. È un indicatore di analisi tecnica avanzata che utilizza diversi metodi e indicatori per generare segnali di trading basati su un approccio Volume Spread Analysis (VSA).
Ecco un riepilogo dettagliato delle funzionalità:
### Parametri personalizzabili:
1. `scoreLabel` e `TDLabel`: Etichette personalizzabili per i punteggi e la direzione del trend.
2. `labelColorScore` e `labelColorTD`: Colori delle etichette per punteggio e direzione del trend.
### Indicatori e variabili base:
1. `spread`: Calcola la differenza tra il massimo e il minimo di una candela.
2. `emaVolume`: Media mobile esponenziale del volume con un periodo di 21.
3. `rsi14`: RSI (Relative Strength Index) con un periodo di 14.
4. `sma200` e `ema50`: Media mobile semplice con un periodo di 200 e media mobile esponenziale con un periodo di 50, rispettivamente.
5. `volatility`: Calcola l'Average True Range (ATR) con un periodo di 14 per determinare la volatilità.
6. `trendDirection`: Stabilisce la direzione del trend basata sulla SMA200.
### Gestione del rischio:
1. `atrValue`: Calcola il valore dell'ATR.
2. `stopLoss` e `takeProfit`: Calcola i livelli di stop-loss e take-profit basati sull'ATR.
### MACD:
Calcola le linee MACD, segnale e l'istogramma.
### Analisi del volume:
1. `weightedVol`: Volume ponderato.
2. `forceFactor`: Misura la forza del movimento del prezzo in relazione al volume.
### Supporto e resistenza:
1. `support` e `resistance`: Calcola i livelli di supporto e resistenza basati sui 50 periodi più recenti.
### Verifica della liquidità:
1. `isLiquid`: Verifica se un asset è sufficientemente liquido.
### Calcolo del punteggio:
Valuta diversi fattori come la posizione del prezzo rispetto ai livelli di supporto/resistenza, RSI, MACD, forza del movimento e volatilità per generare un punteggio.
### Criteri per i segnali finali:
1. `isBullSpread` e `isBearSpread`: Genera un segnale rialzista o ribassista basato su vari fattori, incluso il punteggio, la direzione del trend e la liquidità.
### Notifiche:
Genera condizioni di allarme per segnali rialzisti e ribassisti.
### Elementi grafici:
Visualizza diversi indicatori e segnali sul grafico, inclusi stop-loss, take-profit, SMA200, EMA50, e linee di supporto e resistenza.
### Etichette di debug:
Mostra etichette sul grafico per il punteggio e la direzione del trend.
L'obiettivo è fornire un quadro completo dell'asset corrente, prendendo in considerazione diversi fattori e generando segnali di trading potenzialmente profittevoli.

Cumulative RSI StrategyI suppose nothing drives a point home like a 10+ year backtest! A couple of weeks ago I published a custom indicator called the Cumulative RSI. This indicator was straight out of chapter 9 of "Short Term Trading Strategies That Work." Today I am publishing a basic sample strategy in that uses the Cumulative RSI as its only entry and exit signals on a Nasdaq 100 leveraged index ETF (TQQQ). In this example, the indicator is being used as a longer term strategy with just 10% leverage over the account equity and a $25k start balance.
If I had it 10 years ago I would probably be retired! I'm sharing because I've found that it can provide an edge when determining exit/take profit points for trades. Many traders wait for a price reversal / trailing-stop to exit a trade when it starts losing. I've found that, using tools like the Cumulative RSI, you can achieve better exit points over the long term. Disclaimer: Even though this example significantly beats buy and hold, I wouldn't advise using it as a stand-alone strategy without significant additions/modifications to strategy and risk management functions.

Keltner Channels times 4!Have you always wanted the ultimate MOMO buying script? Well here you go, KC stacked on top of one another.
As Trump would say,
ENJOY!

Big Shadow IndicatorNaked Forex Big Shadow Indicator for TradingView
Big Shadow Indicator is a pattern recognition indicator for Forex, Stocks, Indices, Futures, Commodities, and Cryptos.
When you have a Big Shadow on your chart then this is a strong signal meaning that you might be ahead of a reversal. You can take other elements (momentum, trend, volatility, price action, fundamentals) to build a complete strategy and confirm your entries. Beware that you might not make money just following the arrows generated by the pattern recognition.
The Big Shadow pattern is a simple and effective pattern to trade.
The strategy that comes with the Big Shadow is based on price action.
Inputs:
MaxBars: number of bars back used to calculate the indicator
BuySignals (true/false): you can filter signals and decide to show BUY signals or not. Default settings is true (no filter).
SellSignals (true/false): you can filter signals and decide to show SELL signals or not. Default settings is true (no filter).
Alerts:
The alerts are managed by TradingView trading platform features and not by the indicator itself. You must use Big Shadow Sell less than zero and Big Shadow Buy greater than zero as settings for the alerts.
Trading rules:
For BUY: wait for a bullish Big Shadow to print on a support zone after a down trend. Wait for price to break high of the Big Shadow candle (5 pips above the high for H1 and higher time frames). Immediately enter in the trade once high is broken. You also can use a BUY STOP order placed 5 pips above the high of the candle (plus spread). Stop Loss should be placed below the low of the Big Shadow candle. If order is not triggered in the next candle then trade is invalidated and should be canceled.
For SELL: wait for a bearish Big Shadow to print on resistance zone after an up trend. Wait for price to break the low of the Big Shadow candle (5 pips below the low for H1 and higher time frames). Immediately enter in the trade once low is broken. You also can use a SELL STOP order place 5 pips below the low of the candle. Stop Loss should be placed above the high of the Big Shadow candle. If order is not triggered in the next candle then trade is invalidated and should be canceled.
The Big Shadow indicator can be used with any time frame.
The Big Shadow indicator can be used with any class of asset: Forex, Stocks, Indices, Futures, Commodities and Cryptos.
Other indicators: you might also be interested in the Kangaroo Tail Indicator (very good pattern which is part of the Naked Forex)
For updates of this description please visit our website (see signature below). Beware that due to TradingView house rules we are not allowed to update the present description nor to mention our website. At the time you are reading this description it might be outdated information.
For any question or request please feel free to contact me in private. I usually answer all requests at reception.

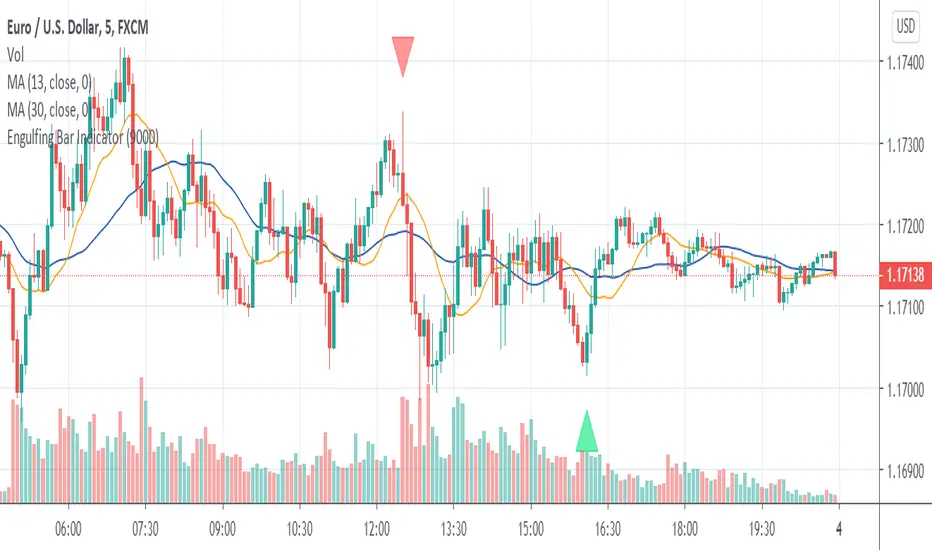
Engulfing Bar IndicatorEngulfing Bar indicator is a pattern recognition indicator for Forex, Stocks, Indices, Futures, Commodities and Cryptos.
The Engulfing Bar indicator is an enhanced pattern of the popular Engulfing Bar to keep only the best patterns produced in the market.
The strategy that comes with the Engulfing Bar is based on price action.
Inputs of the indicator are:
MaxBars: number of bars back used to calculate the indicator
BuySignals (true/false): you can filter signals and decide to show BUY signals or not. Default settings is true (no filter).
SellSignals (true/false): you can filter signals and decide to show SELL signals or not. Default settings is true (no filter).
Alerts:
The alerts are managed by TradingView trading platform features and not by the indicator itself. You must use Engulfing Sell less than zero and Engulfing Buy greater than zero as settings for the alerts.
Trading rules:
For BUY: wait for a bullish Engulfing Bar to print on a support zone after a down trend. Wait for the price to break high of the Engulfing Bar (5 pips above the high for H1 and higher timeframes, 1 pip for M5). Immediately enter in the trade once high is broken. You also can use a BUY STOP order placed 5 pips above the high of the candle (plus spread). Stop Loss should be placed below the low of the Engulfing Bar. If order is not triggered in the next candle, then trade is invalidated and should be canceled.
For SELL: wait for a bearish Engulfing Bar to print on resistance zone after an up trend. Wait for price to break the low of the Engulfing (5 pips below the low for H1 and higher timeframes, 1 pip for M5). Immediately enter in the trade once low is broken. You also can use a SELL STOP order to place 5 pips below the low of the candle. Stop Loss should be placed above the high of the Engulfing Bar. If order is not triggered in the next candle then trade is invalidated and should be canceled.
The Engulfing Bar indicator can be used with any timeframe.
The Engulfing Bar indicator can be used with any class of asset: Forex, Stocks, Indices, Futures, Commodities and Cryptos.
For updates of the present description please visit our website (see signature below). We are not allowed by house rules of TradingView to update the present description nor to mention our web page directly in the description.
For any question or assistance please feel free to send a message to my TradingView inbox or contact us over our website if you prefer. I will answer as soon as I receive your request.

RedK_Directional Index / K xDMIHere's a modern take on the famous DMI/ADX. i first wrote this on another platform few years ago, so i'm happy to be able to share it on TradingView
quick refresher: what does DMI/ADX tell us:
------------------------------------------------------
in simple terms, at the core of this indicator, there are 3 main calculations / lines: the Plus Directional Index ( +DI ) which represents how much the bulls are able to push the high of a bar compared to previous one, the Minus Directional Index ( -DI ), showing how much the bears are able to push the low of a bar from previous one, then the Average Directional index ( ADX ) line, which creates an oscillator of the +DI and -DI to represent the strength of a trend -- usually the lines will be colored accordingly (bulls = green, bears = red, and any different color for the ADX )
Similar to my version of the RSI , we take a classic concept, then use the computing and visualization "super powers" available to us today, to extend and improve on what those masters created in the past. I guess they sort of expected us to do exactly that :)
this "extended" version of DMI/ADX provides couple of highly needed features (in my opinion) -- let's explore:
trying as much as possible to avoid jargon - pls forgive me if i failed in some places.
-------------------------------------------------------------------------------------------------
1 - the big change: the ability to visualize the ADX in a way that makes some more sense.
- the original calculation restricted the ADX to oscillate below zero - i'm sure they had a good reason to build it that way in the past - but to me, it becomes super hard to interpret what the ADX line means, especially when a negative trend (the bears) take over. by removing that restriction and allowing the ADX to oscillate up or down (and we're free to do that, so the indicator shows *us* what *we need* to see), we end up with an improved representation of the trend and the trend strength.
- also the original calculation applies a moving average (default 14 bars) of a moving average (another 14 of the Directional Indexes, which represent the strength of bulls vs bears) to calculate the ADX - that makes the ADX very "removed" from the base price values - i change that, and just smooth the initial +Di / -Di then calculate the ADX from there. again, this shows me the outcome of the (relatively) immediate moves.
2 - i use weighted average WMA () in all my averaging calculations .. i believe this type of average is the best to express the importance of recent days / bars vs the ones further in the past, compared to other averaging techniques
3 - ability to make the DMI volume-weighted .. but contrary to my RSI , this is not set by default.
4 - couple of options to view the unrestricted ADX (as an area or as histogram/columns .. which i call Vertical Bars) for improved visualization
other stuff:
5 - a "step" option for the ADX .. you can set the step option to an increment of, say 5 or 10. this is in case you prefer to see the trend more in "quality" terms - so the equivalent of weak, medium, strong, v. strong...etc -- since in reality, a number like 47.7683 doesn't really mean anything specific
6 - optional "strong trend" adjustable level
Settings & usage suggestion:
-----------------------------------
i prefer to use the defaults (length = 7, smoothing = 3, ..etc) -- i believe these are more suitable to the much faster trading that we have now. you can review the comparison chart and see if this works for you, and adjust as you need.
from a "signal" standpoint, you can use the xDMI as you use the classic DMI/ADX, bulls (or bears) are in control when the corresponding DI line crosses the other going up, *AND* moving above the "strong trend" level that you can set as an extra filter (usually a value between 20 to 30), while ADX will show the quality/strength of the trend.
i suggest you also utilize this indicator with other trend / momentum confirmation methods, and additional analysis and not in isolation - as well as inspecting the prevailing / longer time frame to ensure you're acting in the direction of the broader move / trend.
the above chart includes a side-by-side comparison between our new xDMI with the classic DMI/ADX using the same settings - then we add at the bottom panel also the xDMI, but with my default (faster) settings and showing other visualization options that can be utilized - the Moving Averages on the top / price panel is just to help put the price movement into perspective in terms of trend and trend strength.
The code is open and commented - please feel free to use, share, comment & provide feedback. if you're a DMI fan, and you find this useful in your trading, i would be more than happy to hear about it
Good luck!

Easy Loot Trailing Stop Bot - (PSAR) StrategyHello World,
Today I am bringing you a Parabolic Stop and Reverse Strategy that uses a 5% trailing stop loss.
Tested the strategy on the 1D timeframe of Bitcoin from the time period starting from 2018 onwards.
As you may know the price in the start of 2018 for Bitcoin was around $11,000 meaning if you bought and HODL'd since then you'd be down a good %, as current price is $8650.
Below is the strategy testing results, up 844% profits in the last two years.
Easy Loot Members Only, contact me if you'd like access to the strategy.
Parabolic Stop and Reverse (PSAR) Strategy
Parabolic SAR is a time and price technical analysis tool primarily used to identify points of potential stops and reverses. In fact, the SAR in Parabolic SAR stands for "Stop and Reverse". The indicator's calculations create a parabola which is located below price during a Bullish Trend and above Price during a Bearish Trend.
Trailing Stop Loss
A trailing stop-loss order is a special type of trade order where the stop-loss price is not set at a single, absolute dollar amount, but instead is set at a certain percentage or a certain dollar amount below the market price.

The 1h Wick Wicky - Bitcoin BeatsThis script Uses a bunch of different indicators in order to catch wicks.
Included are:
SAR
JME
Range Filter
ADX
RSI
MACD
Automatic Plotted TP
Unconfirmed entries followed by confirmed entries
This is a combination of different indicators therefore the credit shall not go to me but I have changed certain parameters in order to benefit backtesting profitability.
Trade at your own risk!

Hermes v1.0Hello
Today, I'm releasing Hermès my Eth Trading Script.
Hermès is a variation of my BTCUSDT Script Hadès.
It's looking for specific money/price patterns and compares the results with the "retails sentiment" then, the potential signals are filtered out with an advance/exclusive trend detector. ("Apóllôn" module).
Because this script is expected to be used with Bitmex, you should have a solid trading knowledge(money/Risk Management) .
On the last 4 Months:
* High Profits (~242% fees included)
* Extreme Accuracy (~92.86%)
* Very Low drawdown (-6%)
* About 4-5 Trades a month.
This indicator has been developed for BITMEX:ETHUSD /15Mins/Candles only.
As usual with my scripts:
- No repaint.
- Two Weeks of trial. (Minimum 1 Full trade/nothing to lose!)
Don't hesitate to claim your trial to check on its performance.
More information in my signature.(again don't hesitate to send me a message if you have questions)
Have a Good Day!

(EMI 2)Epic Market Indicator 2, v1.1Had to do a lot of research and gain more experience. If you take, you should also give. That's why I'm honored to present this new version of EMI 2 to the community. After so many modifications I decided to release a new version; EMI 2 v1.1.
Symbols:
Green Diamond = A possible bottom
Red Diamond = A possible top
update:
-Modified Top & Bottom conditions
-Modified Volume/Money Flow equations
-Modified Up & Down trend conditions
-Modified colors for better oversight
-tip: Use color theme 'Dark'
For full potential usage of this indicator, is knowledge about MACD is recommended. Last advice before using these indicators, 'practice makes perfect'.


B3 MTF OHLCMy idea by using Linear regression and some other filters. Great results without repaint :)

Relative Strength Index + DMI DivergencesHi guys I combine RSI and DMI in one study with alerts when price is Overbought, Oversold. Buy and sell divergences in the DMI and strength of the trend in the background I hope its useful for you as its to me

TiZ - cross overLooks for +/- 20 on the scale on histogram for either side bullish or bearish movement.
Best is to work on a daily or weekly timeframe :)
Cheers!!


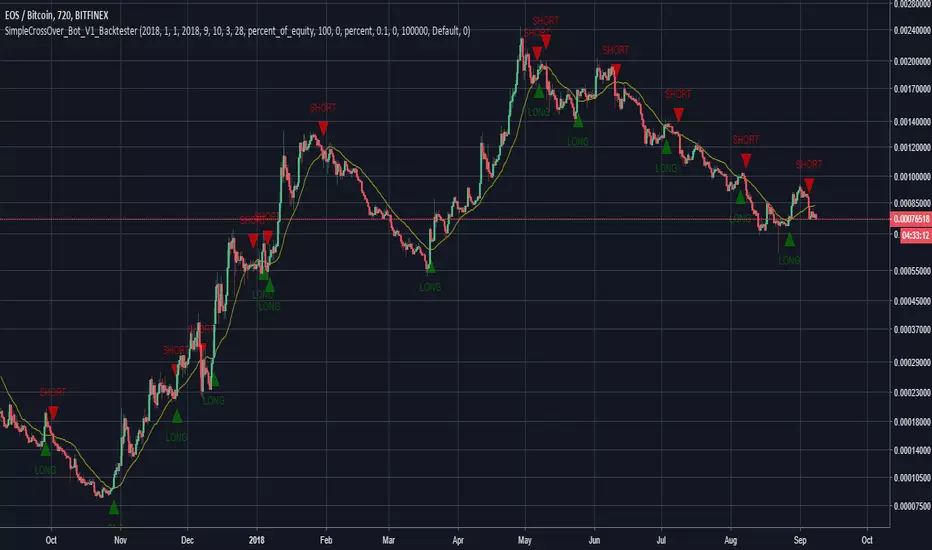
SimpleCrossOver_BotThis is a simple example of how you can compile your own strategy
This script contains the code for alerts and for backtesting.
In order to use the backtester, comment out the sections to be used for signals, and comment in the sections to be used on the back tester, and visa versa for using the script for alerts in order to automate your own bot.
Heffae Resolution Commander (RAW)This is a script to call resolutions with some math on top of your base resolution.
Using the modulo operator to quantize integer values, it works by converting the modified resolution integer to a 4 digit string value.
Use the function within your own scripts to call funny resolutions otherwise difficult to calculate.
You cannot add series expressions to the resolution value since pine does not allow "series" as a resolution for a security call
However, you could easily stack a crapload of these together and use an expression to switch the referenced security function for your purposes.
This is the raw timeframe output as integer, not string.
To go back to string outputs (for use in security calls etc) unslash line 52 //resvalue
For those interested in the verbose version of the timeframe mod function, showing all the steps, here is a pastebin:
pastebin.com
Cheers! Drop a line / comment if you enjoy or have any questions on how to integrate this into your script@!
The Modulo operator is so much fun!
Heffae Resolution CommanderThis is a script to call resolutions with some math on top of your base resolution.
THIS IS NOT AN INDICATOR TO USE ON A CHART!!! The resolution call function is really useful for your own scripting ideas!
Using the modulo operator to quantize integer values, it works by converting the modified resolution integer to a 4 digit string value.
The function within this script is what is valuable, use it within your own scripts to call funny resolutions otherwise difficult to calculate.
You cannot add series expressions to the resolution value since pine does not allow "series " as a resolution for a security call
However, you could easily stack a crapload of these together and use
an expression to switch the referenced security function for your purposes.
The SMA and plot overlay are just there to show a visual example of how the function works.
You can view the raw timeframe output integer by getting rid of tostring(x) and // out the security calls,
plotting the raw function outputs.
For those interested in the verbose version of the timeframe mod function, showing all the steps, here is a pastebin:
pastebin.com
Cheers! Drop a line / comment if you enjoy or have any questions on how to integrate this into your script@!
The Modulo operator is so much fun!
Fibonacci Exponential Moving Averages ( EMA )Here you can have 4 EMA on one indicator. The inputs are for 8, 13, 21 and 55 previous open&close which are from Fibonacci sequence.
How to : To use the script, click on "Add to Favourite Scripts", then load the script from Indicators on the Chart.