Backtesting & Trading Engine [PineCoders]The PineCoders Backtesting and Trading Engine is a sophisticated framework with hybrid code that can run as a study to generate alerts for automated or discretionary trading while simultaneously providing backtest results. It can also easily be converted to a TradingView strategy in order to run TV backtesting. The Engine comes with many built-in strats for entries, filters, stops and exits, but you can also add you own.
If, like any self-respecting strategy modeler should, you spend a reasonable amount of time constantly researching new strategies and tinkering, our hope is that the Engine will become your inseparable go-to tool to test the validity of your creations, as once your tests are conclusive, you will be able to run this code as a study to generate the alerts required to put it in real-world use, whether for discretionary trading or to interface with an execution bot/app. You may also find the backtesting results the Engine produces in study mode enough for your needs and spend most of your time there, only occasionally converting to strategy mode in order to backtest using TV backtesting.
As you will quickly grasp when you bring up this script’s Settings, this is a complex tool. While you will be able to see results very quickly by just putting it on a chart and using its built-in strategies, in order to reap the full benefits of the PineCoders Engine, you will need to invest the time required to understand the subtleties involved in putting all its potential into play.
Disclaimer: use the Engine at your own risk.
Before we delve in more detail, here’s a bird’s eye view of the Engine’s features:
More than 40 built-in strategies,
Customizable components,
Coupling with your own external indicator,
Simple conversion from Study to Strategy modes,
Post-Exit analysis to search for alternate trade outcomes,
Use of the Data Window to show detailed bar by bar trade information and global statistics, including some not provided by TV backtesting,
Plotting of reminders and generation of alerts on in-trade events.
By combining your own strats to the built-in strats supplied with the Engine, and then tuning the numerous options and parameters in the Inputs dialog box, you will be able to play what-if scenarios from an infinite number of permutations.
USE CASES
You have written an indicator that provides an entry strat but it’s missing other components like a filter and a stop strategy. You add a plot in your indicator that respects the Engine’s External Signal Protocol, connect it to the Engine by simply selecting your indicator’s plot name in the Engine’s Settings/Inputs and then run tests on different combinations of entry stops, in-trade stops and profit taking strats to find out which one produces the best results with your entry strat.
You are building a complex strategy that you will want to run as an indicator generating alerts to be sent to a third-party execution bot. You insert your code in the Engine’s modules and leverage its trade management code to quickly move your strategy into production.
You have many different filters and want to explore results using them separately or in combination. Integrate the filter code in the Engine and run through different permutations or hook up your filtering through the external input and control your filter combos from your indicator.
You are tweaking the parameters of your entry, filter or stop strat. You integrate it in the Engine and evaluate its performance using the Engine’s statistics.
You always wondered what results a random entry strat would yield on your markets. You use the Engine’s built-in random entry strat and test it using different combinations of filters, stop and exit strats.
You want to evaluate the impact of fees and slippage on your strategy. You use the Engine’s inputs to play with different values and get immediate feedback in the detailed numbers provided in the Data Window.
You just want to inspect the individual trades your strategy generates. You include it in the Engine and then inspect trades visually on your charts, looking at the numbers in the Data Window as you move your cursor around.
You have never written a production-grade strategy and you want to learn how. Inspect the code in the Engine; you will find essential components typical of what is being used in actual trading systems.
You have run your system for a while and have compiled actual slippage information and your broker/exchange has updated his fees schedule. You enter the information in the Engine and run it on your markets to see the impact this has on your results.
FEATURES
Before going into the detail of the Inputs and the Data Window numbers, here’s a more detailed overview of the Engine’s features.
Built-in strats
The engine comes with more than 40 pre-coded strategies for the following standard system components:
Entries,
Filters,
Entry stops,
2 stage in-trade stops with kick-in rules,
Pyramiding rules,
Hard exits.
While some of the filter and stop strats provided may be useful in production-quality systems, you will not devise crazy profit-generating systems using only the entry strats supplied; that part is still up to you, as will be finding the elusive combination of components that makes winning systems. The Engine will, however, provide you with a solid foundation where all the trade management nitty-gritty is handled for you. By binding your custom strats to the Engine, you will be able to build reliable systems of the best quality currently allowed on the TV platform.
On-chart trade information
As you move over the bars in a trade, you will see trade numbers in the Data Window change at each bar. The engine calculates the P&L at every bar, including slippage and fees that would be incurred were the trade exited at that bar’s close. If the trade includes pyramided entries, those will be taken into account as well, although for those, final fees and slippage are only calculated at the trade’s exit.
You can also see on-chart markers for the entry level, stop positions, in-trade special events and entries/exits (you will want to disable these when using the Engine in strategy mode to see TV backtesting results).
Customization
You can couple your own strats to the Engine in two ways:
1. By inserting your own code in the Engine’s different modules. The modular design should enable you to do so with minimal effort by following the instructions in the code.
2. By linking an external indicator to the engine. After making the proper selections in the engine’s Settings and providing values respecting the engine’s protocol, your external indicator can, when the Engine is used in Indicator mode only:
Tell the engine when to enter long or short trades, but let the engine’s in-trade stop and exit strats manage the exits,
Signal both entries and exits,
Provide an entry stop along with your entry signal,
Filter other entry signals generated by any of the engine’s entry strats.
Conversion from strategy to study
TradingView strategies are required to backtest using the TradingView backtesting feature, but if you want to generate alerts with your script, whether for automated trading or just to trigger alerts that you will use in discretionary trading, your code has to run as a study since, for the time being, strategies can’t generate alerts. From hereon we will use indicator as a synonym for study.
Unless you want to maintain two code bases, you will need hybrid code that easily flips between strategy and indicator modes, and your code will need to restrict its use of strategy() calls and their arguments if it’s going to be able to run both as an indicator and a strategy using the same trade logic. That’s one of the benefits of using this Engine. Once you will have entered your own strats in the Engine, it will be a matter of commenting/uncommenting only four lines of code to flip between indicator and strategy modes in a matter of seconds.
Additionally, even when running in Indicator mode, the Engine will still provide you with precious numbers on your individual trades and global results, some of which are not available with normal TradingView backtesting.
Post-Exit Analysis for alternate outcomes (PEA)
While typical backtesting shows results of trade outcomes, PEA focuses on what could have happened after the exit. The intention is to help traders get an idea of the opportunity/risk in the bars following the trade in order to evaluate if their exit strategies are too aggressive or conservative.
After a trade is exited, the Engine’s PEA module continues analyzing outcomes for a user-defined quantity of bars. It identifies the maximum opportunity and risk available in that space, and calculates the drawdown required to reach the highest opportunity level post-exit, while recording the number of bars to that point.
Typically, if you can’t find opportunity greater than 1X past your trade using a few different reasonable lengths of PEA, your strategy is doing pretty good at capturing opportunity. Remember that 100% of opportunity is never capturable. If, however, PEA was finding post-trade maximum opportunity of 3 or 4X with average drawdowns of 0.3 to those areas, this could be a clue revealing your system is exiting trades prematurely. To analyze PEA numbers, you can uncomment complete sets of plots in the Plot module to reveal detailed global and individual PEA numbers.
Statistics
The Engine provides stats on your trades that TV backtesting does not provide, such as:
Average Profitability Per Trade (APPT), aka statistical expectancy, a crucial value.
APPT per bar,
Average stop size,
Traded volume .
It also shows you on a trade-by-trade basis, on-going individual trade results and data.
In-trade events
In-trade events can plot reminders and trigger alerts when they occur. The built-in events are:
Price approaching stop,
Possible tops/bottoms,
Large stop movement (for discretionary trading where stop is moved manually),
Large price movements.
Slippage and Fees
Even when running in indicator mode, the Engine allows for slippage and fees to be included in the logic and test results.
Alerts
The alert creation mechanism allows you to configure alerts on any combination of the normal or pyramided entries, exits and in-trade events.
Backtesting results
A few words on the numbers calculated in the Engine. Priority is given to numbers not shown in TV backtesting, as you can readily convert the script to a strategy if you need them.
We have chosen to focus on numbers expressing results relative to X (the trade’s risk) rather than in absolute currency numbers or in other more conventional but less useful ways. For example, most of the individual trade results are not shown in percentages, as this unit of measure is often less meaningful than those expressed in units of risk (X). A trade that closes with a +25% result, for example, is a poor outcome if it was entered with a -50% stop. Expressed in X, this trade’s P&L becomes 0.5, which provides much better insight into the trade’s outcome. A trade that closes with a P&L of +2X has earned twice the risk incurred upon entry, which would represent a pre-trade risk:reward ratio of 2.
The way to go about it when you think in X’s and that you adopt the sound risk management policy to risk a fixed percentage of your account on each trade is to equate a currency value to a unit of X. E.g. your account is 10K USD and you decide you will risk a maximum of 1% of it on each trade. That means your unit of X for each trade is worth 100 USD. If your APPT is 2X, this means every time you risk 100 USD in a trade, you can expect to make, on average, 200 USD.
By presenting results this way, we hope that the Engine’s statistics will appeal to those cognisant of sound risk management strategies, while gently leading traders who aren’t, towards them.
We trade to turn in tangible profits of course, so at some point currency must come into play. Accordingly, some values such as equity, P&L, slippage and fees are expressed in currency.
Many of the usual numbers shown in TV backtests are nonetheless available, but they have been commented out in the Engine’s Plot module.
Position sizing and risk management
All good system designers understand that optimal risk management is at the very heart of all winning strategies. The risk in a trade is defined by the fraction of current equity represented by the amplitude of the stop, so in order to manage risk optimally on each trade, position size should adjust to the stop’s amplitude. Systems that enter trades with a fixed stop amplitude can get away with calculating position size as a fixed percentage of current equity. In the context of a test run where equity varies, what represents a fixed amount of risk translates into different currency values.
Dynamically adjusting position size throughout a system’s life is optimal in many ways. First, as position sizing will vary with current equity, it reproduces a behavioral pattern common to experienced traders, who will dial down risk when confronted to poor performance and increase it when performance improves. Second, limiting risk confers more predictability to statistical test results. Third, position sizing isn’t just about managing risk, it’s also about maximizing opportunity. By using the maximum leverage (no reference to trading on margin here) into the trade that your risk management strategy allows, a dynamic position size allows you to capture maximal opportunity.
To calculate position sizes using the fixed risk method, we use the following formula: Position = Account * MaxRisk% / Stop% [, which calculates a position size taking into account the trade’s entry stop so that if the trade is stopped out, 100 USD will be lost. For someone who manages risk this way, common instructions to invest a certain percentage of your account in a position are simply worthless, as they do not take into account the risk incurred in the trade.
The Engine lets you select either the fixed risk or fixed percentage of equity position sizing methods. The closest thing to dynamic position sizing that can currently be done with alerts is to use a bot that allows syntax to specify position size as a percentage of equity which, while being dynamic in the sense that it will adapt to current equity when the trade is entered, does not allow us to modulate position size using the stop’s amplitude. Changes to alerts are on the way which should solve this problem.
In order for you to simulate performance with the constraint of fixed position sizing, the Engine also offers a third, less preferable option, where position size is defined as a fixed percentage of initial capital so that it is constant throughout the test and will thus represent a varying proportion of current equity.
Let’s recap. The three position sizing methods the Engine offers are:
1. By specifying the maximum percentage of risk to incur on your remaining equity, so the Engine will dynamically adjust position size for each trade so that, combining the stop’s amplitude with position size will yield a fixed percentage of risk incurred on current equity,
2. By specifying a fixed percentage of remaining equity. Note that unless your system has a fixed stop at entry, this method will not provide maximal risk control, as risk will vary with the amplitude of the stop for every trade. This method, as the first, does however have the advantage of automatically adjusting position size to equity. It is the Engine’s default method because it has an equivalent in TV backtesting, so when flipping between indicator and strategy mode, test results will more or less correspond.
3. By specifying a fixed percentage of the Initial Capital. While this is the least preferable method, it nonetheless reflects the reality confronted by most system designers on TradingView today. In this case, risk varies both because the fixed position size in initial capital currency represents a varying percentage of remaining equity, and because the trade’s stop amplitude may vary, adding another variability vector to risk.
Note that the Engine cannot display equity results for strategies entering trades for a fixed amount of shares/contracts at a variable price.
SETTINGS/INPUTS
Because the initial text first published with a script cannot be edited later and because there are just too many options, the Engine’s Inputs will not be covered in minute detail, as they will most certainly evolve. We will go over them with broad strokes; you should be able to figure the rest out. If you have questions, just ask them here or in the PineCoders Telegram group.
Display
The display header’s checkbox does nothing.
For the moment, only one exit strategy uses a take profit level, so only that one will show information when checking “Show Take Profit Level”.
Entries
You can activate two simultaneous entry strats, each selected from the same set of strats contained in the Engine. If you select two and they fire simultaneously, the main strat’s signal will be used.
The random strat in each list uses a different seed, so you will get different results from each.
The “Filter transitions” and “Filter states” strats delegate signal generation to the selected filter(s). “Filter transitions” signals will only fire when the filter transitions into bull/bear state, so after a trade is stopped out, the next entry may take some time to trigger if the filter’s state does not change quickly. When you choose “Filter states”, then a new trade will be entered immediately after an exit in the direction the filter allows.
If you select “External Indicator”, your indicator will need to generate a +2/-2 (or a positive/negative stop value) to enter a long/short position, providing the selected filters allow for it. If you wish to use the Engine’s capacity to also derive the entry stop level from your indicator’s signal, then you must explicitly choose this option in the Entry Stops section.
Filters
You can activate as many filters as you wish; they are additive. The “Maximum stop allowed on entry” is an important component of proper risk management. If your system has an average 3% stop size and you need to trade using fixed position sizes because of alert/execution bot limitations, you must use this filter because if your system was to enter a trade with a 15% stop, that trade would incur 5 times the normal risk, and its result would account for an abnormally high proportion in your system’s performance.
Remember that any filter can also be used as an entry signal, either when it changes states, or whenever no trade is active and the filter is in a bull or bear mode.
Entry Stops
An entry stop must be selected in the Engine, as it requires a stop level before the in-trade stop is calculated. Until the selected in-trade stop strat generates a stop that comes closer to price than the entry stop (or respects another one of the in-trade stops kick in strats), the entry stop level is used.
It is here that you must select “External Indicator” if your indicator supplies a +price/-price value to be used as the entry stop. A +price is expected for a long entry and a -price value will enter a short with a stop at price. Note that the price is the absolute price, not an offset to the current price level.
In-Trade Stops
The Engine comes with many built-in in-trade stop strats. Note that some of them share the “Length” and “Multiple” field, so when you swap between them, be sure that the length and multiple in use correspond to what you want for that stop strat. Suggested defaults appear with the name of each strat in the dropdown.
In addition to the strat you wish to use, you must also determine when it kicks in to replace the initial entry’s stop, which is determined using different strats. For strats where you can define a positive or negative multiple of X, percentage or fixed value for a kick-in strat, a positive value is above the trade’s entry fill and a negative one below. A value of zero represents breakeven.
Pyramiding
What you specify in this section are the rules that allow pyramiding to happen. By themselves, these rules will not generate pyramiding entries. For those to happen, entry signals must be issued by one of the active entry strats, and conform to the pyramiding rules which act as a filter for them. The “Filter must allow entry” selection must be chosen if you want the usual system’s filters to act as additional filtering criteria for your pyramided entries.
Hard Exits
You can choose from a variety of hard exit strats. Hard exits are exit strategies which signal trade exits on specific events, as opposed to price breaching a stop level in In-Trade Stops strategies. They are self-explanatory. The last one labelled When Take Profit Level (multiple of X) is reached is the only one that uses a level, but contrary to stops, it is above price and while it is relative because it is expressed as a multiple of X, it does not move during the trade. This is the level called Take Profit that is show when the “Show Take Profit Level” checkbox is checked in the Display section.
While stops focus on managing risk, hard exit strategies try to put the emphasis on capturing opportunity.
Slippage
You can define it as a percentage or a fixed value, with different settings for entries and exits. The entry and exit markers on the chart show the impact of slippage on the entry price (the fill).
Fees
Fees, whether expressed as a percentage of position size in and out of the trade or as a fixed value per in and out, are in the same units of currency as the capital defined in the Position Sizing section. Fees being deducted from your Capital, they do not have an impact on the chart marker positions.
In-Trade Events
These events will only trigger during trades. They can be helpful to act as reminders for traders using the Engine as assistance to discretionary trading.
Post-Exit Analysis
It is normally on. Some of its results will show in the Global Numbers section of the Data Window. Only a few of the statistics generated are shown; many more are available, but commented out in the Plot module.
Date Range Filtering
Note that you don’t have to change the dates to enable/diable filtering. When you are done with a specific date range, just uncheck “Date Range Filtering” to disable date filtering.
Alert Triggers
Each selection corresponds to one condition. Conditions can be combined into a single alert as you please. Just be sure you have selected the ones you want to trigger the alert before you create the alert. For example, if you trade in both directions and you want a single alert to trigger on both types of exits, you must select both “Long Exit” and “Short Exit” before creating your alert.
Once the alert is triggered, these settings no longer have relevance as they have been saved with the alert.
When viewing charts where an alert has just triggered, if your alert triggers on more than one condition, you will need the appropriate markers active on your chart to figure out which condition triggered the alert, since plotting of markers is independent of alert management.
Position sizing
You have 3 options to determine position size:
1. Proportional to Stop -> Variable, with a cap on size.
2. Percentage of equity -> Variable.
3. Percentage of Initial Capital -> Fixed.
External Indicator
This is where you connect your indicator’s plot that will generate the signals the Engine will act upon. Remember this only works in Indicator mode.
DATA WINDOW INFORMATION
The top part of the window contains global numbers while the individual trade information appears in the bottom part. The different types of units used to express values are:
curr: denotes the currency used in the Position Sizing section of Inputs for the Initial Capital value.
quote: denotes quote currency, i.e. the value the instrument is expressed in, or the right side of the market pair (USD in EURUSD ).
X: the stop’s amplitude, itself expressed in quote currency, which we use to express a trade’s P&L, so that a trade with P&L=2X has made twice the stop’s amplitude in profit. This is sometimes referred to as R, since it represents one unit of risk. It is also the unit of measure used in the APPT, which denotes expected reward per unit of risk.
X%: is also the stop’s amplitude, but expressed as a percentage of the Entry Fill.
The numbers appearing in the Data Window are all prefixed:
“ALL:” the number is the average for all first entries and pyramided entries.
”1ST:” the number is for first entries only.
”PYR:” the number is for pyramided entries only.
”PEA:” the number is for Post-Exit Analyses
Global Numbers
Numbers in this section represent the results of all trades up to the cursor on the chart.
Average Profitability Per Trade (X): This value is the most important gauge of your strat’s worthiness. It represents the returns that can be expected from your strat for each unit of risk incurred. E.g.: your APPT is 2.0, thus for every unit of currency you invest in a trade, you can on average expect to obtain 2 after the trade. APPT is also referred to as “statistical expectancy”. If it is negative, your strategy is losing, even if your win rate is very good (it means your winning trades aren’t winning enough, or your losing trades lose too much, or both). Its counterpart in currency is also shown, as is the APPT/bar, which can be a useful gauge in deciding between rivalling systems.
Profit Factor: Gross of winning trades/Gross of losing trades. Strategy is profitable when >1. Not as useful as the APPT because it doesn’t take into account the win rate and the average win/loss per trade. It is calculated from the total winning/losing results of this particular backtest and has less predictive value than the APPT. A good profit factor together with a poor APPT means you just found a chart where your system outperformed. Relying too much on the profit factor is a bit like a poker player who would think going all in with two’s against aces is optimal because he just won a hand that way.
Win Rate: Percentage of winning trades out of all trades. Taken alone, it doesn’t have much to do with strategy profitability. You can have a win rate of 99% but if that one trade in 100 ruins you because of poor risk management, 99% doesn’t look so good anymore. This number speaks more of the system’s profile than its worthiness. Still, it can be useful to gauge if the system fits your personality. It can also be useful to traders intending to sell their systems, as low win rate systems are more difficult to sell and require more handholding of worried customers.
Equity (curr): This the sum of initial capital and the P&L of your system’s trades, including fees and slippage.
Return on Capital is the equivalent of TV’s Net Profit figure, i.e. the variation on your initial capital.
Maximum drawdown is the maximal drawdown from the highest equity point until the drop . There is also a close to close (meaning it doesn’t take into account in-trade variations) maximum drawdown value commented out in the code.
The next values are self-explanatory, until:
PYR: Avg Profitability Per Entry (X): this is the APPT for all pyramided entries.
PEA: Avg Max Opp . Available (X): the average maximal opportunity found in the Post-Exit Analyses.
PEA: Avg Drawdown to Max Opp . (X): this represents the maximum drawdown (incurred from the close at the beginning of the PEA analysis) required to reach the maximal opportunity point.
Trade Information
Numbers in this section concern only the current trade under the cursor. Most of them are self-explanatory. Use the description’s prefix to determine what the values applies to.
PYR: Avg Profitability Per Entry (X): While this value includes the impact of all current pyramided entries (and only those) and updates when you move your cursor around, P&L only reflects fees at the trade’s last bar.
PEA: Max Opp . Available (X): It’s the most profitable close reached post-trade, measured from the trade’s Exit Fill, expressed in the X value of the trade the PEA follows.
PEA: Drawdown to Max Opp . (X): This is the maximum drawdown from the trade’s Exit Fill that needs to be sustained in order to reach the maximum opportunity point, also expressed in X. Note that PEA numbers do not include slippage and fees.
EXTERNAL SIGNAL PROTOCOL
Only one external indicator can be connected to a script; in order to leverage its use to the fullest, the engine provides options to use it as either an entry signal, an entry/exit signal or a filter. When used as an entry signal, you can also use the signal to provide the entry’s stop. Here’s how this works:
For filter state: supply +1 for bull (long entries allowed), -1 for bear (short entries allowed).
For entry signals: supply +2 for long, -2 for short.
For exit signals: supply +3 for exit from long, -3 for exit from short.
To send an entry stop level with an entry signal: Send positive stop level for long entry (e.g. 103.33 to enter a long with a stop at 103.33), negative stop level for short entry (e.g. -103.33 to enter a short with a stop at 103.33). If you use this feature, your indicator will have to check for exact stop levels of 1.0, 2.0 or 3.0 and their negative counterparts, and fudge them with a tick in order to avoid confusion with other signals in the protocol.
Remember that mere generation of the values by your indicator will have no effect until you explicitly allow their use in the appropriate sections of the Engine’s Settings/Inputs.
An example of a script issuing a signal for the Engine is published by PineCoders.
RECOMMENDATIONS TO ASPIRING SYSTEM DESIGNERS
Stick to higher timeframes. On progressively lower timeframes, margins decrease and fees and slippage take a proportionally larger portion of profits, to the point where they can very easily turn a profitable strategy into a losing one. Additionally, your margin for error shrinks as the equilibrium of your system’s profitability becomes more fragile with the tight numbers involved in the shorter time frames. Avoid <1H time frames.
Know and calculate fees and slippage. To avoid market shock, backtest using conservative fees and slippage parameters. Systems rarely show unexpectedly good returns when they are confronted to the markets, so put all chances on your side by being outrageously conservative—or a the very least, realistic. Test results that do not include fees and slippage are worthless. Slippage is there for a reason, and that’s because our interventions in the market change the market. It is easier to find alpha in illiquid markets such as cryptos because not many large players participate in them. If your backtesting results are based on moving large positions and you don’t also add the inevitable slippage that will occur when you enter/exit thin markets, your backtesting will produce unrealistic results. Even if you do include large slippage in your settings, the Engine can only do so much as it will not let slippage push fills past the high or low of the entry bar, but the gap may be much larger in illiquid markets.
Never test and optimize your system on the same dataset , as that is the perfect recipe for overfitting or data dredging, which is trying to find one precise set of rules/parameters that works only on one dataset. These setups are the most fragile and often get destroyed when they meet the real world.
Try to find datasets yielding more than 100 trades. Less than that and results are not as reliable.
Consider all backtesting results with suspicion. If you never entertained sceptic tendencies, now is the time to begin. If your backtest results look really good, assume they are flawed, either because of your methodology, the data you’re using or the software doing the testing. Always assume the worse and learn proper backtesting techniques such as monte carlo simulations and walk forward analysis to avoid the traps and biases that unchecked greed will set for you. If you are not familiar with concepts such as survivor bias, lookahead bias and confirmation bias, learn about them.
Stick to simple bars or candles when designing systems. Other types of bars often do not yield reliable results, whether by design (Heikin Ashi) or because of the way they are implemented on TV (Renko bars).
Know that you don’t know and use that knowledge to learn more about systems and how to properly test them, about your biases, and about yourself.
Manage risk first , then capture opportunity.
Respect the inherent uncertainty of the future. Cleanse yourself of the sad arrogance and unchecked greed common to newcomers to trading. Strive for rationality. Respect the fact that while backtest results may look promising, there is no guarantee they will repeat in the future (there is actually a high probability they won’t!), because the future is fundamentally unknowable. If you develop a system that looks promising, don’t oversell it to others whose greed may lead them to entertain unreasonable expectations.
Have a plan. Understand what king of trading system you are trying to build. Have a clear picture or where entries, exits and other important levels will be in the sort of trade you are trying to create with your system. This stated direction will help you discard more efficiently many of the inevitably useless ideas that will pop up during system design.
Be wary of complexity. Experienced systems engineers understand how rapidly complexity builds when you assemble components together—however simple each one may be. The more complex your system, the more difficult it will be to manage.
Play! . Allow yourself time to play around when you design your systems. While much comes about from working with a purpose, great ideas sometimes come out of just trying things with no set goal, when you are stuck and don’t know how to move ahead. Have fun!
@LucF
NOTES
While the engine’s code can supply multiple consecutive entries of longs or shorts in order to scale positions (pyramid), all exits currently assume the execution bot will exit the totality of the position. No partial exits are currently possible with the Engine.
Because the Engine is literally crippled by the limitations on the number of plots a script can output on TV; it can only show a fraction of all the information it calculates in the Data Window. You will find in the Plot Module vast amounts of commented out lines that you can activate if you also disable an equivalent number of other plots. This may be useful to explore certain characteristics of your system in more detail.
When backtesting using the TV backtesting feature, you will need to provide the strategy parameters you wish to use through either Settings/Properties or by changing the default values in the code’s header. These values are defined in variables and used not only in the strategy() statement, but also as defaults in the Engine’s relevant Inputs.
If you want to test using pyramiding, then both the strategy’s Setting/Properties and the Engine’s Settings/Inputs need to allow pyramiding.
If you find any bugs in the Engine, please let us know.
THANKS
To @glaz for allowing the use of his unpublished MA Squize in the filters.
To @everget for his Chandelier stop code, which is also used as a filter in the Engine.
To @RicardoSantos for his pseudo-random generator, and because it’s from him that I first read in the Pine chat about the idea of using an external indicator as input into another. In the PineCoders group, @theheirophant then mentioned the idea of using it as a buy/sell signal and @simpelyfe showed a piece of code implementing the idea. That’s the tortuous story behind the use of the external indicator in the Engine.
To @admin for the Volatility stop’s original code and for the donchian function lifted from Ichimoku .
To @BobHoward21 for the v3 version of Volatility Stop .
To @scarf and @midtownsk8rguy for the color tuning.
To many other scripters who provided encouragement and suggestions for improvement during the long process of writing and testing this piece of code.
To J. Welles Wilder Jr. for ATR, used extensively throughout the Engine.
To TradingView for graciously making an account available to PineCoders.
And finally, to all fellow PineCoders for the constant intellectual stimulation; it is a privilege to share ideas with you all. The Engine is for all TradingView PineCoders, of course—but especially for you.
Look first. Then leap.
Search in scripts for "backtesting"

Backtesting on Non-Standard Charts: Caution! - PineCoders FAQMuch confusion exists in the TradingView community about backtesting on non-standard charts. This script tries to shed some light on the subject in the hope that traders make better use of those chart types.
Non-standard charts are:
Heikin Ashi (HA)
Renko
Kagi
Point & Figure
Range
These chart types are called non-standard because they all transform market prices into synthetic views of price action. Some focus on price movement and disregard time. Others like HA use the same division of bars into fixed time intervals but calculate artificial open, high, low and close (OHLC) values.
Non-standard chart types can provide traders with alternative ways of interpreting price action, but they are not designed to test strategies or run automated traded systems where results depend on the ability to enter and exit trades at precise price levels at specific times, whether orders are issued manually or algorithmically. Ironically, the same characteristics that make non-standard chart types interesting from an analytical point of view also make them ill-suited to trade execution. Why? Because of the dislocation that a synthetic view of price action creates between its non-standard chart prices and real market prices at any given point in time. Switching from a non-standard chart price point into the market always entails a translation of time/price dimensions that results in uncertainty—and uncertainty concerning the level or the time at which orders are executed is detrimental to all strategies.
The delta between the chart’s price when an order is issued (which is assumed to be the expected price) and the price at which that order is filled is called slippage . When working from normal chart types, slippage can be caused by one or more of the following conditions:
• Time delay between order submission and execution. During this delay the market may move normally or be subject to large orders from other traders that will cause large moves of the bid/ask levels.
• Lack of bids for a market sell or lack of asks for a market buy at the current price level.
• Spread taken by middlemen in the order execution process.
• Any other event that changes the expected fill price.
When a market order is submitted, matching engines attempt to fill at the best possible price at the exchange. TradingView strategies usually fill market orders at the opening price of the next candle. A non-standard chart type can produce misleading results because the open of the next candle may or may not correspond to the real market price at that time. This creates artificial and often beneficial slippage that would not exist on standard charts.
Consider an HA chart. The open for each candle is the average of the previous HA bar’s open and close prices. The open of the HA candle is a synthetic value, but the real market open at the time the new HA candle begins on the chart is the unrelated, regular open at the chart interval. The HA open will often be lower on long entries and higher on short entries, resulting in unrealistically advantageous fills.
Another example is a Renko chart. A Renko chart is a type of chart that only measures price movement. The purpose of a Renko chart is to cluster price action into regular intervals, which consequently removes the time element. Because Trading View does not provide tick data as a price source, it relies on chart interval close values to construct Renko bricks. As a consequence, a new brick is constructed only when the interval close penetrates one or more brick thresholds. When a new brick starts on the chart, it is because the previous interval’s close was above or below the next brick threshold. The open price of the next brick will likely not represent the current price at the time this new brick begins, so correctly simulating an order is impossible.
Some traders have argued with us that backtesting and trading off HA charts and other non-standard charts is useful, and so we have written this script to show traders what happens when order fills from backtesting on non-standard charts are compared to real-world fills at market prices.
Let’s review how TV backtesting works. TV backtesting uses a broker emulator to execute orders. When an order is executed by the broker emulator on historical bars, the price used for the fill is either the close of the order’s submission bar or, more often, the open of the next. The broker emulator only has access to the chart’s prices, and so it uses those prices to fill orders. When backtesting is run on a non-standard chart type, orders are filled at non-standard prices, and so backtesting results are non-standard—i.e., as unrealistic as the prices appearing on non-standard charts. This is not a bug; where else is the broker emulator going to fetch prices than from the chart?
This script is a strategy that you can run on either standard or non-standard chart types. It is meant to help traders understand the differences between backtests run on both types of charts. For every backtest, a label at the end of the chart shows two global net profit results for the strategy:
• The net profits (in currency) calculated by TV backtesting with orders filled at the chart’s prices.
• The net profits (in currency) calculated from the same orders, but filled at market prices (fetched through security() calls from the underlying real market prices) instead of the chart’s prices.
If you run the script on a non-standard chart, the top result in the label will be the result you would normally get from the TV backtesting results window. The bottom result will show you a more realistic result because it is calculated from real market fills.
If you run the script on a normal chart type (bars, candles, hollow candles, line, area or baseline) you will see the same result for both net profit numbers since both are run on the same real market prices. You will sometimes see slight discrepancies due to occasional differences between chart prices and the corresponding information fetched through security() calls.
Features
• Results shown in the Data Window (third icon from the top right of your chart) are:
— Cumulative results
— For each order execution bar on the chart, the chart and market previous and current fills, and the trade results calculated from both chart and market fills.
• You can choose between 2 different strategies, both elementary.
• You can use HA prices for the calculations determining entry/exit conditions. You can use this to see how a strategy calculated from HA values can run on a normal chart. You will notice that such strategies will not produce the same results as the real market results generated from HA charts. This is due to the different environment backtesting is running on where for example, position sizes for entries on the same bar will be calculated differently because HA and standard chart close prices differ.
• You can choose repainting/non-repainting signals.
• You can show MAs, entry/exit markers and market fill levels.
• You can show candles built from the underlying market prices.
• You can color the background for occurrences where an order is filled at a different real market price than the chart’s price.
Notes
• On some non-standard chart types you will not obtain any results. This is sometimes due to how certain types of non-standard types work, and sometimes because the script will not emit orders if no underlying market information is detected.
• The script illustrates how those who want to use HA values to calculate conditions can do so from a standard chart. They will then be getting orders emitted on HA conditions but filled at more realistic prices because their strategy can run on a standard chart.
• On some non-standard chart types you will see market results surpass chart results. While this may seem interesting, our way of looking at it is that it points to how unreliable non-standard chart backtesting is, and why it should be avoided.
• In order not to extend an already long description, we do not discuss the particulars of executing orders on the realtime bar when using non-standard charts. Unless you understand the minute details of what’s going on in the realtime bar on a particular non-standard chart type, we recommend staying away from this.
• Some traders ask us: Why does TradingView allow backtesting on non-standard chart types if it produces unrealistic results? That’s somewhat like asking a hammer manufacturer why it makes hammers if hammers can hurt you. We believe it’s a trader’s responsibility to understand the tools he is using.
Takeaways
• Non-standard charts are not bad per se, but they can be badly used.
• TV backtesting on non-standard charts is not broken and doesn’t require fixing. Traders asking for a fix are in dire need of learning more about trading. We recommend they stop trading until they understand why.
• Stay away from—even better, report—any vendor presenting you with strategies running on non-standard charts and implying they are showing reliable results.
• If you don’t understand everything we discussed, don’t use non-standard charts at all.
• Study carefully how non-standard charts are built and the inevitable compromises used in calculating them so you can understand their limitations.
Thanks to @allanster and @mortdiggiddy for their help in editing this description.
Look first. Then leap.

Backtesting- IndicatorFor anyone interested, Here is an example of how to put backtesting results into an Indicator. This calculates the same values as you find in the Summary Screen of the built in Strategy backtester. This will use the same result size as the standard backtester i.e. 5 minute chart grabs roughly 1 month of data, 1 minute chart grabs 1 week of data, etc... I tried to keep this as self-contained as possible so I put most of the code for the results in the bottom of the Indicator. The results stop at the last completed trade signal i.e. a Buy has a Sell to it. This is the same indicator I posted earlier with the PCT Trailing StopLoss so you will see that code in here as well. As said in my previous posting, the indicator is just a simple EMA crossover to give it something to do and I would not recommend using this indicator on its own, but instead copy the code to your own indicator if you find it useful. I also left the code in so that you can switch back to a Strategy if you want to verify the results.
Additional Notes:
- The results are within an acceptable margin of error due to the fact that the Indicator is having to calculate based on when the Buy and Sell Signal occur as opposed to when actual trades occur like in the Strategy Backtester
- I was trying to find a way to set the number of Buy Signals to use i.e. show me the results from the past 100 trades but couldn't sort out the logic. I am open to suggestions. Also keep in mind I am not a coder by profession so if you have any ideas on that front, please explain it to me as though I am a 5 year old child and provide code examples if possible :)
- I included the Strategy results in the Screen Shots so that you can see where the results line up.
Additional Additional Note:
This is not financial advice. Use at your own risk.

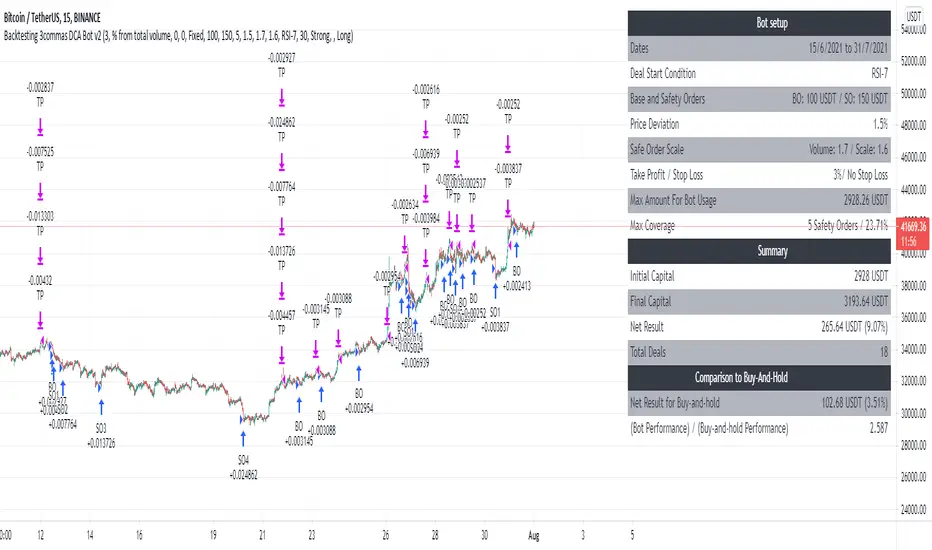
Vigilant Asset Allocation G4 Backtesting EngineThis script was based off of an idea that @CubanEmissary had so the description and some of the code that @CubanEmissary built on TradingView was used.
Vigilant Asset Allocation G4 (VAA G4) is a dual-momentum based investment strategy that aggressively monitors the market and reallocates portfolio funds based on the relative momentums of user-defined risk assets and safety assets. It was created by Wouter Keller and JW Keuning, based on their paper "Breadth Momentum and Vigilant Asset Allocation." In contrast to traditional dual momentum strategies, VAA G4 monitors the market itself through the two asset types. When all risk assets have positive momentum, the portfolio is allocated entirely into the risk asset with the strongest momentum At any other time, the portfolio is allocated entirely into the safety asset with the strongest momentum. The combination of breadth momentum with a very defensive reallocation trigger results in a strategy which captures alpha consistently.
The Strategy Rules:
1. Calculate each asset's momentum score on each monthly close:
momentumScore = (12*(currentMonthlyClose/lastMonthlyClose))+(4*(currentMonthlyClose/thirdLastMonthlyClose))+(2*(currentMonthlyClose/sixthLastMonthlyClose))+(currentMonthlyClose/twelvethLastMonthlyClose)-19
2. If all risk asset momentums are positive, allocate entire portfolio to the risk asset with the strongest momentum.
3. If any risk asset's momentum is negative, allocate entire portfolio to the safety asset with the strongest momentum.
4. Reevaluate at the end of each month.
Caveats:
1. It seems like TradingView only has limited price data for these tickers that are listed in the strategy. So it is best to start the strategy when they all have ample data (~ June 2nd, 2008)
2. This backtesting engine is basic and doesn't account for slippage and trading fees. So I implemented a basic "trading fee" input that will subtract a trading fee whenever the strategy makes a trade at the end of the month.
3. It is assumed in this engine that the trades will be made the exact second a new monthly bar opens up.
4. MUST USE ON MONTHLY CHART. It is hard-coded to work on monthly chart, if you open it on a daily chart , the Sharpe, Sortino, & CAGR calculations might not be right as well as the momentum score

[Sextan] Backtesting with L2 Reversal Labels as an input sourceLevel: 1
NOTE: This is ONLY an EXAMPLE on HOW-TO produce a customized "{Sextan} PINEv4 Sextans Backtest Framework" intput signal with "(blackcat) L2 Reversal Labels", and you can define your own indicator in the highlighted area in compliance with the uniform format, which guarantee when you use "Indicator on Indicator" function, it would not produce any error.
I use two simple moving average crossings to produce long and short entry signal with SMA3 and SMA8 in the example.
Background
Backtesting of technical indicators and strategies is the most common way to understand a quantitative strategy. However, the complicated configuration and adaptation work of backtesting many quantitative tools makes many traders who do not understand the code daunted. Moreover, although I have written a lot of strategies, I am still not very satisfied with the backtest configuration and writing efficiency. Therefore, I have been thinking about how to build a backtesting framework that can quickly and easily evaluate the backtesting performance of any indicator with a "long/short entry" indicator, that is, a "simple backtesting tool for dummies". The performance requirements should be stable, and the operation should be simple and convenient. It is best to "copy", "paste", and "a few mouse clicks" to complete the quick backtest and evaluation of a new indicator.
Luckily, I recently realized that TradingView provides an "Indicator on Indicator" feature, which is the perfect foundation for doing "hot swap" backtesting. My basic idea is to use a two-layer design. The first layer is the technical indicator signal source that needs to be embedded, which is only used to provide buy and sell signals of custom strategies; the second layer is the trading system, which is used to receive the output signals of the first layer, and filter the signals according to the agreed specifications. , Take Profit, Stop Loss, draw buy and sell signals and cost lines, define and send custom buy and sell alert messages to mobile phones, social software or trading interfaces. In general, this two-layer design is a flexible combination of "death and alive", which can meet the needs of most traders to quickly evaluate the performance of a certain technical indicator. The first layer here is flexible. Users can insert their own strategy codes according to my template, and they can draw buy and sell signals and output them to the second layer. The second layer is fixed, and the overall framework is solidified to ensure the stability and unity of the trading system. It is convenient to compare different or similar strategies under the same conditions. Finally, all trading signals are drawn on the chart, and the output strategy returns. test report.
The main function:
The first layer: "{Sextan} Your Indicator Source", the script provides a template for personalized strategy input, and the signal and definition interfaces ensure full compatibility with the second layer. Backtesting is performed stably in the backtesting framework of the layer. The first layer of this script is also relatively simple: enter your script in the highlighted custom script area, and after ensuring the final buy and sell signals long = bool condition, short = bool condition, the design of the first layer is considered complete. Input it into the PINE script editor of TradingView, save it and add it to the chart, you can see the pulse sequence in yellow (buy) and purple (sell) on the sub-picture, corresponding to the main picture, you can subjectively judge that the quality of the trading point of the strategy is good Bad.
The second layer: "{Sextan} PINEv4 Sextans Backtest Framework". This script is the standardized trading system strategy execution and alarm, used to generate the final report of the strategy backtest and some key indicators that I have customized that I find useful, such as: winning rate , Odds, Winning Surface, Kelly Ratio, Take Profit and Stop Loss Thresholds, Trading Frequency, etc. are evaluated according to the Kelly formula. To use the second layer, first load it into the TrainingView chart, no markers will appear on the chart, since you have not specified any strategy source signals, click on the gear-shaped setting next to the "{Sextan} PINEv4 Sextans BTFW" header button, you can open the backtest settings, the first item is to select your custom strategy source. Because we have added the strategy source to the chart in the previous step, you can easily find an option "{Sextan} Your Indicator Source: Signal" at the bottom of the list, this is the strategy source input we need, select and confirm , you can see various markers on the main graph, and quickly generate a backtesting profit graph and a list of backtesting reports. You can generate files and download the backtesting reports locally. You can also click the gear on the backtest chart interface to customize some conditions of the backtest, including: initial capital amount, currency type, percentage of each order placed, amount of pyramid additions, commission fees, slippage, etc. configuration. Note: The configuration in the interface dialog overrides the same configuration implemented by the code in the backtest script.
How to output charts:
The first layer: "{Sextan} Your Indicator Source", the output of this script is the pulse value of yellow and purple, yellow +1 means buy, purple -1 means sell.
The second layer: PINEv4 Sextans Backtest Framework". The output of this script is a bit complicated. After all, it is the entire trading system with a lot of information:
1. Blue and red arrows. The blue upward arrow indicates long position, the red downward arrow indicates short position, and the horizontal bar at the end of the purple arrow indicates take profit or stop loss exit.
2. Red and green lines. This is the holding cost line of the strategy, green represents the cost of holding a long position, and red represents the cost of holding a short position. The cost line is a continuous solid line and the price action is relatively close.
3. Green and yellow long take profit and stop loss area and green and yellow long take profit and stop loss fork. Once a long position is held, there is a conditional order for take profit and stop loss. The green horizontal line is the long take profit ratio line, and the yellow is the long stop loss ratio line; the green cross indicates the long take profit price, and the yellow cross indicates the long position. Stop loss price. It's worth noting that the prongs and wires don't necessarily go together. Because of the optimization of the algorithm, for a strong market, the take profit will occur after breaking the take profit line, and the profit will not be taken until the price falls.
4. The purple and red short take profit and stop loss area and the purple red short stop loss fork. Once a short position is held, there will be a take profit and stop loss conditional order, the red is the short take profit ratio line, and the purple is the short stop loss ratio line; the red cross indicates the short take profit price, and the purple cross indicates the short stop loss price.
5. In addition to the above signs, there are also text and numbers indicating the profit and loss values of long and short positions. "L" means long; "S" means short; "XL" means close long; "XS" means close short.
TradingView Strategy Tester Panel:
The overview graph is an intuitive graph that plots the blue (gain) and red (loss) curves of all backtest periods together, and notes: the absolute value and percentage of net profit, the number of all closed positions, the winning percentage, the profit factor, The maximum trading loss, the absolute value and ratio of the average trading profit and loss, and the average number of K-lines held in all trades.
Another is the performance summary. This is to display all long and short statistical indicators of backtesting in the form of a list, such as: net profit, gross profit, Sharpe ratio, maximum position, commission, times of profit and loss, etc.
Finally, the transaction list is a table indexed by the transaction serial number, showing the signal direction, date and time, price, profit and loss, accumulated profit and loss, maximum transaction profit, transaction loss and other values.
Remarks
Finally, I will explain that this is just the beginning of this model. I will continue to optimize the trading system of the second layer. Various optimization feedback and suggestions are welcome. For valuable feedback, I am willing to provide some L4/L5 technical indicators as rewards for free subscription rights.

Simple APF Strategy Backtesting [The Quant Science]Simple backtesting strategy for the quantitative indicator Autocorrelation Price Forecasting. This is a Buy & Sell strategy that operates exclusively with long orders. It opens long positions and generates profit based on the future price forecast provided by the indicator. It's particularly suitable for trend-following trading strategies or directional markets with an established trend.
Main functions
1. Cycle Detection: Utilize autocorrelation to identify repetitive market behaviors and cycles.
2. Forecasting for Backtesting: Simulate trades and assess the profitability of various strategies based on future price predictions.
Logic
The strategy works as follow:
Entry Condition: Go long if the hypothetical gain exceeds the threshold gain (configurable by user interface).
Position Management: Sets a take-profit level based on the future price.
Position Sizing: Automatically calculates the order size as a percentage of the equity.
No Stop-Loss: this strategy doesn't includes any stop loss.
Example Use Case
A trader analyzes a dayli period using 7 historical bars for autocorrelation.
Sets a threshold gain of 20 points using a 5% of the equity for each trade.
Evaluates the effectiveness of a long-only strategy in this period to assess its profitability and risk-adjusted performance.
User Interface
Length: Set the length of the data used in the autocorrelation price forecasting model.
Thresold Gain: Minimum value to be considered for opening trades based on future price forecast.
Order Size: percentage size of the equity used for each single trade.
Strategy Limit
This strategy does not use a stop loss. If the price continues to drop and the future price forecast is incorrect, the trader may incur a loss or have their capital locked in the losing trade.
Disclaimer!
This is a simple template. Use the code as a starting point rather than a finished solution. The script does not include important parameters, so use it solely for educational purposes or as a boilerplate.

High Low Cloud Strategy BacktestingHigh Low Cloud Strategy Backtesting: this is a breakout and reversal previous trend strategy
A. Indicator: row 6 to row 17
1. Fast Cloud
Upper line = ema of High with 60 periods
Lower line = ema of Low with 60 periods
1. Slow Cloud
Upper line = ema of High with 240 periods
Lower line = ema of Low with 240 periods
B. Strategy Backtesting
1. Chart IDC, Time frame: M30
2. Long condition: row 20 to row 34
a. Entry =
* Upper line of Fast Cloud below Lower line of Slow Cloud
* Price crossover Upper line of Slow Cloud
b. Stoploss =
* Price crossunder bottom of 240 periods (~ bottom of 5 days)
c. Takeprofit =
* Lower line of Fast Cloud above Upper line of Slow Cloud
* Price crossunder Lower line of Fast Cloud
3. Short condition: row 37 to row 49
a. Entry =
* Lower line of Fast Cloud above Upper line of Slow Cloud
* Price crossunder Lower line of Slow Cloud
b. Stoploss =
* Price crossover peak of 240 periods (~ bottom of 5 days)
c. Takeprofit =
* Upper line of Fast Cloud below Lower line of Slow Cloud
* Price crossover Upper line of Fast Cloud

Grid Bot BacktestingBinance, Bybit, Bitget, and other cross-exchange (grid) trading bot backtesting.
Auto bound: Automatically setting upper and lower price bounds.
Manual: Setting upper and lower price bounds manually.
The graph below represents the overall asset changes (initial investment amount + current position profit + grid profit).
Try using backtesting when setting up a grid bot on the exchange!
바이낸스, 바이비트, 비트겟 등 교차거래(그리드) 봇 백테스팅
Auto bound : 자동으로 상,하단 가격 설정
Manual : 직접 상,하단 가격 설정
아래 그래프는 총 자산 변화입니다.(초기투자금액 + 현재 포지션 수익 + 그리드 수익)
거래소에서 그리드 봇 설정할 때 백테스팅 유용하게 써보세요!

[-_-] Level Breakout, Auto Backtesting StrategyDescription:
A Long only strategy based on breakout from a certain level formed by High price. It has auto-backtesting capabilities (you set ranges for the three main parameters: Lookback, TP and SL; the strategy then goes through different combinations of those parameters and displays a table with results that you can sort by Percentage of profitable trades AND/OR Net profit AND/OR Number of trades). So you can, for example, sort only by Net profit to find combination of parameters that gives highest net profit, or sort by Net profit and Percentage profitable to find a combination of parameters that gives the best balance between profitability and profit. The auto-backtesting also takes into account the commission which is set in % in the inputs (make sure to set the same value in properties of the strategy so that auto-backtesting and real backtesting results match).
NOTE: auto-backtesting only find the best combinations and displays them in a table, you will then need to manually set the Lookback, TP and SL inputs for real backtesting to match.
Parameters:
- Lookback -> # of bars for filtering signals; recommended range from 2 to 5
- TP (%) -> take profit; recommended range from 5 to 10
- SL (%) -> stop loss; recommended range from 1 to 5
- Commission (%) -> commission per trade
- Min/Max Lookback -> lookback range for auto-backtesting
- Min/Max TP -> take profit range for auto-backtesting
- Min/Max SL -> stop loss range for auto-backtesting
- Percentage profitable -> sort by percentage of profitable trades
- Net profit -> sort by net profit
- Number of trades -> sort by number of trades

Replica of TradingView's Backtesting Engine with ArraysHello everyone,
Here is a perfectly replicated TradingView backtesting engine condensed into a single library function calculated with arrays. It includes TradingView's calculations for Net profit, Total Trades, Percent of Trades Profitable, Profit Factor, Max Drawdown (absolute and percent), and Average Trade (absolute and percent). Here's how TradingView defines each aspect of its backtesting system:
Net Profit: The overall profit or loss achieved.
Total Trades: The total number of closed trades, winning and losing.
Percent Profitable: The percentage of winning trades, the number of winning trades divided by the total number of closed trades.
Profit Factor: The amount of money the strategy made for every unit of money it lost, gross profits divided by gross losses.
Max Drawdown: The greatest loss drawdown, i.e., the greatest possible loss the strategy had compared to its highest profits.
Average Trade: The sum of money gained or lost by the average trade, Net Profit divided by the overall number of closed trades.
Here's how each variable is defined in the library function:
_backtest(bool _enter, bool _exit, float _startQty, float _tradeQty)
bool _enter: When the strategy should enter a trade (entry condition)
bool _exit: When the strategy should exit a trade (exit condition)
float _startQty: The starting capital in the account (for BTCUSD, it is the amount of USD the account starts with)
float _tradeQty: The amount of capital traded (if set to 1000 on BTCUSD, it will trade 1000 USD on each trade)
Currently, this library only works with long strategies, and I've included a commented out section under DEMO STRATEGY where you can replicate my results with TradingView's backtesting engine. There's tons I could do with this beyond what is shown, but this was a project I worked on back in June of 2022 before getting burned out. Feel free to comment with any suggestions or bugs, and I'll try to add or fix them all soon. Here's my list of thing to add to the library currently (may not all be added):
Add commission calculations.
Add support for shorting
Add a graph that resembles TradingView's overview graph.
Clean and optimize code.
Clean up in a way that makes it easy to add other TradingView calculations (such as Sharpe and Sortino ratio).
Separate all variables, so they become accessible outside of calculations (such as gross profit, gross loss, number of winning trades, number of losing trades, etc.).
Thanks for reading,
OztheWoz

Descriptive Backtesting Framework (DBF)As the name suggests, this is a backtesting framework made to offer full backtesting functionality to any custom indicator in a visually descriptive way.
Any trade taken will be very clear to visualize on the chart and the equity line will be updated live allowing us to use the REPLAY feature to view the strategy performing in real time.
Stops and Targets will also get draw on the chart with labels and tooltips and there will be a table on the top right corner displaying lots of descriptive metrics to measure your strategy's performance.
IF YOU DECIDE TO USE THIS FRAMEWORK, PLEASE READ **EVERYTHING** BELOW
HOW TO USE IT
Step 1 - Insert Your Strategy Indicators:
Inside this framework's code, right at the beginning, you will find a dedicated section where you can manually insert any set of indicators you desire.
Just replace the example code in there with your own strategy indicators.
Step 2 - Specify The Conditions To Take Trades:
After that, there will be another section where you need to specify your strategy's conditions to enter and exit trades.
When met, those conditions will fire the trading signals to the trading engine inside the framework.
If you don't wish to use some of the available signals, please just assign false to the signal.
DO NOT DELETE THE SIGNAL VARIABLES
Step 3 - Specify Entry/Exit Prices, Stops & Targets:
Finally you'll reach the last section where you'll be able to specify entry/exit prices as well as add stops and targets.
On most cases, it's easier and more reliable to just use the close price to enter and exit trades.
If you decide to use the open price instead, please remember to change step 2 so that trades are taken on the open price of the next candle and not the present one to avoid the look ahead bias.
Stops and targets can be set in any way you want.
Also, please don't forget to update the spread. If your broker uses commissions instead of spreads or a combination of both, you'll need to manually incorporate those costs in this step.
And that's it! That's all you have to do.
Below this section you'll now see a sign warning you about not making any changes to the code below.
From here on, the framework will take care of executing the trades and calculating the performance metrics for you and making sure all calculations are consistent.
VISUAL FEATURES:
Price candles get painted according to the current trade.
They will be blue during long trades, purple on shorts and white when no trade is on.
When the framework receives the signals to start or close a trade, it will display those signals as shapes on the upper and lower limits of the chart:
DIAMOND: represents a signal to open a trade, the trade direction is represented by the shape's color;
CROSS: means a stop loss was triggered;
FLAG: means a take profit was triggered;
CIRCLE: means an exit trade signal was fired;
Hovering the mouse over the trade labels will reveal:
Asset Quantity;
Entry/Exit Prices;
Stops & Targets;
Trade Profit;
Profit As Percentage Of Trade Volume;
**Please note that there's a limit as to how many labels can be drawn on the chart at once.**
If you which to see labels from the beginning of the chart, you'll probably need to use the replay feature.
PERFORMANCE TABLE:
The performance table displays several performance metrics to evaluate the strategy.
All the performance metrics here are calculated by the framework. It does not uses the oficial pine script strategy tester.
All metrics are calculated in real time. If using the replay feature, they will be updated up to the last played bar.
Here are the available metrics and their definition:
INITIAL EQUITY: the initial amount of money we had when the strategy started, obviously...;
CURRENT EQUITY: the amount of money we have now. If using the replay feature, it will show the current equity up to the last bar played. The number on it's right side shows how many times our equity has been multiplied from it's initial value;
TRADE COUNT: how many trades were taken;
WIN COUNT: how many of those trades were wins. The percentage at the right side is the strategy WIN RATE;
AVG GAIN PER TRADE: the average percentage gain per trade. Very small values can indicate a fragile strategy that can behave in unexpected ways under high volatility conditions;
AVG GAIN PER WIN: the average percentage gain of trades that were profitable;
AVG GAIN PER LOSS: the average percentage loss on trades that were not profitable;
EQUITY MAX DD: the maximum drawdown experienced by our equity during the entire strategy backtest;
TRADE MAX DD: the maximum drawdown experienced by our equity after one single trade;
AVG MONTHLY RETURN: the compound monthly return that our strategy was able to create during the backtested period;
AVG ANNUAL RETURN: this is the strategy's CAGR (compound annual growth rate);
ELAPSED MONTHS: number of months since the backtest started;
RISK/REWARD RATIO: shows how profitable the strategy is for the amount of risk it takes. Values above 1 are very good (and rare). This is calculated as follows: (Avg Annual Return) / mod(Equity Max DD). Where mod() is the same as math.abs();
AVAILABLE SETTINGS:
SPREAD: specify your broker's asset spread
ENABLE LONGS / SHORTS: you can keep both enable or chose to take trades in only one direction
MINIMUM BARS CLOSED: to avoid trading before indicators such as a slow moving average have had time to populate, you can manually set the number of bars to wait before allowing trades.
INITIAL EQUITY: you can specify your starting equity
EXPOSURE: is the percentage of equity you wish to risk per trade. When using stops, the strategy will automatically calculate your position size to match the exposure with the stop distance. If you are not using stops then your trade volume will be the percentage of equity specified here. 100 means you'll enter trades with all your equity and 200 means you'll use a 2x leverage.
MAX LEVERAGE ALLOWED: In some situations a short stop distance can create huge levels of leverage. If you want to limit leverage to a maximum value you can set it here.
SEVERAL PLOTTING OPTIONS: You'll be able to specify which of the framework visuals you wish to see drawn on the chart.
FRAMEWORK **LIMITATIONS**:
When stop and target are both triggered in the same candle, this framework isn't able to enter faster timeframes to check which one was triggered first, so it will take the pessimistic assumption and annul the take profit signal;
This framework doesn't support pyramiding;
This framework doesn't support both long and short positions to be active at the same time. So for example, if a short signal is received while a long trade is open, the framework will close the long trade and then open a short trade;
FINAL CONSIDERATIONS:
I've been using this framework for a good time and I find it's better to use and easier to analyze a strategy's performance then relying on the oficial pine script strategy tester. However, I CANNOT GUARANTEE IT TO BE BUG FREE.
**PLEASE PERFORM A MANUAL BACKTEST BEFORE USING ANY STRATEGY WITH REAL MONEY**

Quantitative Backtesting Panel + ROI Table - ShortsThis script is an aggregate of a backtesting panel with quantitative metrics, ROI table and open ROI reader. It also contains a mechanism for having a fixed percentage stop loss, similar to native TV backtester. For shorts only.
Backtesting Panel:
- Certain metrics are color coded, with green being good performance, orange being neutral, red being undesirable.
• ROI : return with the system, in %
• ROI(COMP=1): return if money is compounded at a rate of 100%
• Hit rate: accuracy of the system, as a %
• Profit factor: gross profit/gross loss
• Maximum drawdown: the maximum value from a peak to a successive trough of the system's equity curve
• MAE: Maximum Adverse Excursion. The biggest loss of a trade suffered while the position is still open
• Total trades: total number of closed trades
• Max gain/max loss: shows the biggest win over the biggest loss suffered
• Sharpe ratio: measures the performance of the system with adjusted risk (no comparison to risk-free asset)
• CAGR: Compound Annual Growth Rate. The mean annual rate of growth of the system of n years (provided n>1)
• Kurtosis: measures how heavily the tails of the distribution differ from that of a normal distribution (symmetric on both sides of mean where mean=0, standard deviation=1). A normal distribution has a kurtosis of 3, and skewness of 0. The kurtosis indicates whether or not the tails of the returns contain extreme values
• Skewness: measures the symmetry of the distribution of returns
- Leptokurtic: K > 0. Having more kurtosis than a normal distribution. It's stretched up and to the side too (2nd pic down). High kurtosis (leptokurtic) is bad as the wider tails (called heavy tails) suggest there is relatively high probability of extreme events
- Mesokurtic: K =0. Having the same kurtosis as a normal distribution
- Platykurtic: K < 0. Having less kurtosis than a normal distribution. This suggests there are light tails and fewer extreme events in the distribution
- Skewness is good: +/- 0.5 (fairly symmetrical)
- Skewness is average: -1 to -0.5 or 0.5 to 1 (moderately skewed)
- Skewness is bad: > +/- 1 (highly skewed)
Evolving ROI table:
- The table of ROI values evolve with the year and month. The sum of each year is given. Please avoid using it on non-cryptocurrencies or any market whose trading session is not 24/7
Open ROI reader:
- At the top center is the open ROI of a trade

Quantitative Backtesting Panel + ROI Table - LongsThis script is an aggregate of a backtesting panel with quantitative metrics, ROI table and open ROI reader. It also contains a mechanism for having a fixed percentage stop loss, similar to native TV backtester. For longs only.
Backtesting Panel:
- Certain metrics are color coded, with green being good performance, orange being neutral, red being undesirable.
• ROI : return with the system, in %
• ROI(COMP=1): return if money is compounded at a rate of 100%
• Hit rate: accuracy of the system, as a %
• Profit factor: gross profit/gross loss
• Maximum drawdown: the maximum value from a peak to a successive trough of the system's equity curve
• MAE: Maximum Adverse Excursion. The biggest loss of a trade suffered while the position is still open
• Total trades: total number of closed trades
• Max gain/max loss: shows the biggest win over the biggest loss suffered
• Sharpe ratio: measures the performance of the system with adjusted risk (no comparison to risk-free asset)
• CAGR: Compound Annual Growth Rate. The mean annual rate of growth of the system of n years (provided n>1)
• Kurtosis: measures how heavily the tails of the distribution differ from that of a normal distribution (symmetric on both sides of mean where mean=0, standard deviation=1). A normal distribution has a kurtosis of 3, and skewness of 0. The kurtosis indicates whether or not the tails of the returns contain extreme values
• Skewness: measures the symmetry of the distribution of returns
- Leptokurtic: K > 0. Having more kurtosis than a normal distribution. It's stretched up and to the side too (2nd pic down). High kurtosis (leptokurtic) is bad as the wider tails (called heavy tails) suggest there is relatively high probability of extreme events
- Mesokurtic: K =0. Having the same kurtosis as a normal distribution
- Platykurtic: K < 0. Having less kurtosis than a normal distribution. This suggests there are light tails and fewer extreme events in the distribution
- Skewness is good: +/- 0.5 (fairly symmetrical)
- Skewness is average: -1 to -0.5 or 0.5 to 1 (moderately skewed)
- Skewness is bad: > +/- 1 (highly skewed)
Evolving ROI table:
- The table of ROI values evolve with the year and month. The sum of each year is given. Please avoid using it on non-cryptocurrencies or any market whose trading session is not 24/7
Open ROI reader:
- At the top center is the open ROI of a trade

Indian Market Sessions for BacktestingThis indicator is designed to increase the quality of your backtesting in the Indian Market.
NSE & BSE run from 9:15 am IST to 3:30 pm IST.
Naturally different times have different kinds of volatility.
On your chart you will find premarked -
Saffron - 9:15 am to 10:30 am - Opening Session - High Volatility Observed Historically
White - 10:35 am to 2:25 pm - Middle Session - Lower Volatility Observed Historically
Green - 2:30 pm to 3:30 pm - Closing Session - Medium to High Volatility Observed Historically
You will also find the start of each session marked with an arrow.
Feel free to change the times from the input settings and the color and visibility from the style settings.
_______________
Usage:
When you backtest any strategies, say moving average crossovers, also mark the sessions in your sheet which will help you further increase accuracy.
Feel free to drop your doubts in the comments.

Strategy Backtesting Template [MYN]A few people have been asking me to share my backtesting template. Currently I use this as my starting point for validating existing strategies and developing new ones.
Features:
Trading Date Range
Trade Direction
4 progressive take profits with target percents and percentage of position to take profit on (Thanks adolgo)
Variable percentage Stop Loss
Automatic ProfitView Alert Syntax builder for Longs and Shorts
ADX checkbox to automatically add conditional logic to your strategy

Rainbow Strategy BacktestingRainbow Strategy Backtesting base on "Rainbow Moving Average" Strategy as below:
1.Rainbow Moving Average setup
- Source: source of 1st MA
- Type: SMA/EMA
- Period: period of 1st MA
- Displacement: period of 2nd MA to 7th MA with source is previous MA
2.Trend Define
- Up Trend: Main MA moving at the top of Rainbow
- Down Trend: Main MA moving at the bottom of Rainbow
- Sideway: Main MA moving between the top and the bottom of Rainbow
3.Signal
- Buy Signal: When Rainbow change to Up Trend.
- Sell Signal: When Rainbow change to Down Trend.
- Exit: When Rainbow change to Sideway.
4.RSI Filter
- "Enable": Only signals have 1st RSI moving between Overbought and Oversold and 2nd RSI moving outside Middle Channel are accepted.
- The filter may help trader avoid bull trap, bear trap and choppy market.
5.Backtesting Infomation
- Ticker: BTCUSDT
- Timeframe: H1
- Rainbow parameter:
+ Source: hlc3
+ Type: SMA
+ Period: 12
+ Displacement: 3
- RSI Filter parameter:
+ Enable
+ 1st RSI filter: period 12, overbought 65, oversold 35
+ 2nd RSI filter: period 9, upper middle 56, lower middle 44
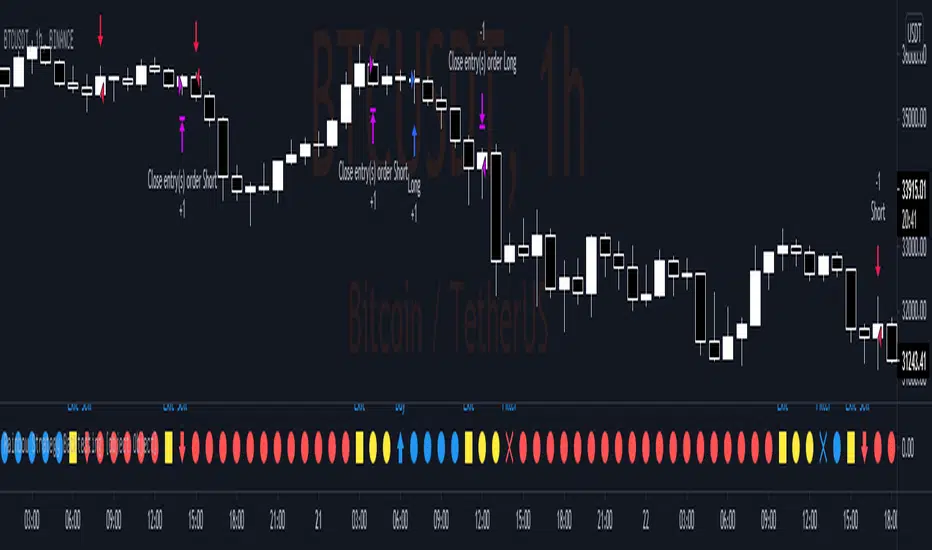
Signal for Backtesting-Trading Engine [PineCoders]This is a companion script to the PineCoders Backtesting-Trading Engine. It illustrates how to build a signal plot in another script, which can in turn be fed in the Engine to provide entry, exit, filter and stop information.
Connection to the Engine is done through its “External Indicator” input field at the very bottom of the Engine’s Settings/Inputs.
The Engine must be operating in study mode to be able to connect an external indicator to it.
The way this script builds the signal is straightforward, as you will see in the code. Two aspects are worth mentioning:
The “FudgeStop()” function used to fudge the stop value by one tick for the rare cases where it will match one of the protocol reserved values, i.e. 1, 2 or 3.
The priority and exclusivity given to the different types of signals in the signal-building “Signal = …” line. No two signals can be sent simultaneously through the signal plot, except for the entry and stop combination.
You can determine in this script’s Settings/Inputs the type of signals that will go through the signal plot.
This script respects the following protocol:
EXTERNAL SIGNAL PROTOCOL
Only one external indicator can be connected to a script; in order to leverage its use to the fullest, the engine provides options to use it as either an entry signal, an entry/exit signal or a filter. When used as an entry signal, you can also use the signal to provide the entry’s stop. Here’s how this works:
For filter state: supply +1 for bull (long entries allowed), -1 for bear (short entries allowed).
For entry signals: supply +2 for long, -2 for short.
For exit signals: supply +3 for exit from long, -3 for exit from short.
To send an entry stop level with an entry signal: Send positive stop level for long entry (e.g. 103.33 to enter a long with a stop at 103.33), negative stop level for short entry (e.g. -103.33 to enter a short with a stop at 103.33). If you use this feature, your indicator will have to check for exact stop levels of 1.0, 2.0 or 3.0 and their negative counterparts, and fudge them with a tick in order to avoid confusion with other signals in the protocol.
Remember that mere generation of the values by your indicator will have no effect until you explicitly allow their use in the appropriate sections of the Engine’s Settings/Inputs.
Look first. Then leap.
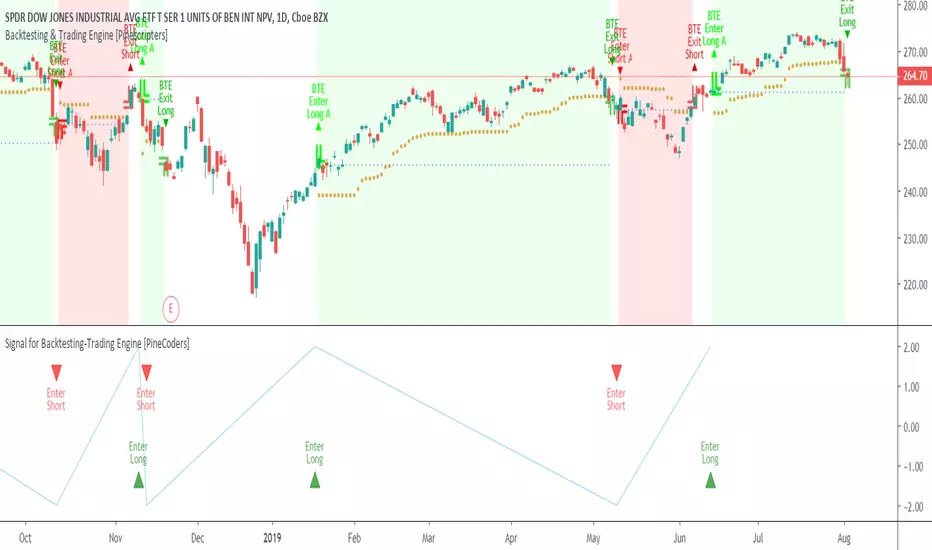
*Backtesting System ⚉ OVERVIEW ⚉
One of the best Systems for Backtesting your Strategies.
Incredibly flexible, simple, fast and feature-rich system — will solve most of your queries without much effort.
Many systems for setting StopLoss, TakeProfit, Risk Management and advanced Filters.
All you need to do is plug in your indicator and start Backtesting .
I intentionally left the option to use my System on Full Power before you load your indicator into it.
The system uses the built-in simple and popular moving average crossover signal for this purpose. (EMA 50 & 200).
Also Highly Recommend that you Fully use ALL of the features of this system so that you understand how they work before you ask questions.
Also tried to leave TIPS for each feature everywhere, read Tips, activate them and see how they work.
But before you use this system, I Recommend you to read the following description in Full.
—————— How to connect your indicator in 2 steps:
Adapt your indicator by adding only 2 lines of code and then connect it to this Backtesting System.
Step 1 — Create your connector, For doing so:
• 1 — Find or create in your indicator where are the conditions printing the Long-Buy and Short-Sell signals.
• 2 — Create an additional plot as below
I'm giving an example with a Two moving averages cross.
Please replicate the same methodology for your indicator wether it's a MACD, RSI , Pivots, or whatever indicator with Clear Buy and Sell conditions.
//@version=5
indicator('Moving Average Cross', overlay = true)
MA200 = ta.𝚎𝚖𝚊(close, 200)
MA50 = ta.𝚎𝚖𝚊(close, 50)
// Generate Buy and Sell conditions
buy = ta.crossover (MA200, MA50)
sell = ta.crossunder (MA200, MA50)
plot(MA200, color=color.green)
plot(MA50 , color=color.red )
bgcolor(color = buy ? color.green : sell ? color.red : na, title='SIGNALS')
// ———————————————— SIGNAL FOR SYSTEM ————————————————
Signal = buy ? +1 : sell ? -1 : 0
plot(Signal, title='🔌Connector🔌', display = display.none)
// —————— 🔥 The Backtesting System expects the value to be exactly +1 for the 𝚋𝚞𝚕𝚕𝚒𝚜𝚑 signal, and -1 for the 𝚋𝚎𝚊𝚛𝚒𝚜𝚑 signal
Basically, I identified my Buy & Sell conditions in the code and added this at the bottom of my indicator code
Now you can connect your indicator to the Backtesting System using the Step 2
Step 2 — Connect the connector
• 1 — Add your updated indicator to a TradingView chart and Add the Backtesting System as well to the SAME chart
• 2 — Open the Backtesting System settings and in the External Source field select your 🔌Connector🔌 (which comes from your indicator)
_______________________________
⚉ MAIN SETTINGS ⚉
‾‾‾‾‾‾‾‾‾‾‾‾‾‾‾‾‾‾‾‾‾‾‾‾‾‾‾‾‾‾‾
𝐄𝐱𝐭𝐞𝐫𝐧𝐚𝐥 𝐒𝐨𝐮𝐫𝐜𝐞 — Select your indicator. Add your indicator by following the 2 steps described above and select it in the menu. To familiarize yourself with the system until you select your indicator, you will have an in-built strategy of crossing the two moving EMA's of 50 and 200.
Long Deals — Enable/Disable Long Deals.
Short Deals — Enable/Disable Short Deals.
Wait End Deal — Enable/Disable waiting for a trade to close at Stop Loss/Take Profit. Until the trade closes on the Stop Loss or Take Profit, no new trade will open.
Reverse Deals — To force the opening of a trade in the opposite direction.
ReEntry Deal — Automatically open the same new deal after the deal is closed.
ReOpen Deal — Reopen the trade if the same signal is received. For example, if you are already in the long and a new signal is received in the long, the trade will reopen. * Does not work if Wait End Deal is enabled.
𝐓𝐚𝐤𝐞 𝐏𝐫𝐨𝐟𝐢𝐭:
None — Disables take profit. Useful if you only want to use dynamic stoplosses such as MA, Fast-Trailing, ATR Trail.
FIXED % — Fixed take profit in percent.
FIXED $ — Fixed Take in Money.
ATR — Fixed Take based on ATR.
R:R — Fixed Take based on the size of your stop loss. For example, if your stop is 10% and R:R=1, then the Take would be 10%. R:R=3 Take would be 30%, etc.
HH / LL — Fixed Take based on the previous maximum/minimum (extremum).
𝐒𝐭𝐨𝐩 𝐋𝐨𝐬𝐬:
None — Disables Stop Loss. Useful if you want to work without a stop loss. *Be careful if Wait End Deal is enabled, the trade may not close for a long time until it reaches the Take.
FIXED % — Fixed Stop in percent.
FIXED $ — Fixed Stop in Money.
TRAILING — Dynamic Trailing Stop like on the stock exchanges.
FAST TRAIL — Dynamic Fast Trailing Stop moves immediately in profit and stays in place if the price stands still or the price moves in loss.
ATR — Fixed Stop based on the ATR.
ATR TRAIL — Dynamic Trailing Stop based on the ATR.
LO / HI — A Fixed Stop based on the last Maximum/Minimum extemum. Allows you to place a stop just behind or above the low/high candle.
MA — Dynamic Stop based on selected Moving Average. * You will have 8 types of MA (EMA, SMA, HMA, etc.) to choose from, but you can easily add dozens of other MAs, which makes this type of stop incredibly flexible.
Add % — If true, then with the "𝗦𝘁𝗼𝗽 %" parameter you can add percentages to any of the current SL. Can be especially useful when using Stop - 𝗔𝗧𝗥 or 𝗠𝗔 or 𝗟𝗢/𝗛𝗜. For example with 𝗟𝗢/𝗛𝗜 to put a stop for the last High/Low and add 0.5% additional Stoploss.
Fixed R:R — If the stop loss is Dynamic (Trailing or MA) then if R:R true can also be made Dynamic * Use it carefully, the function is experimental.
_________________________________________
⚉ TAKE PROFIT LEVELS ⚉
‾‾‾‾‾‾‾‾‾‾‾‾‾‾‾‾‾‾‾‾‾‾‾‾‾‾‾‾‾‾‾‾‾‾‾‾‾‾‾‾‾
A unique method of constructing intermediate Take Profit Levels will allow you to select up to 5 intermediate Take Profit Levels and one intermediate Stop Loss.
Intermediate Take Profit Levels are perfectly calculated into 5 equal parts in the form of levels from the entry point to the final Take Profit target.
All you need to do is to choose the necessary levels for fixing and how much you want to fix at each level as a percentage. For example, TP 3 will always be exactly between the entry point and the Take Profit target. And the value of TP 3 = 50 will close 50% of the amount of the remaining size of the position.
Note: all intermediate SL/TP are closed from the remaining position amount and not from the initial position size, as TV does by default.
SL 0 Position — works in the same way as TP 1-5 but it's Stop. With this parameter you can set the position where the intermediate stop will be set.
Breakeven on TP — When activated, it allows you to put the stop loss at Breakeven after the selected TP is reached. For this function to work as it should - you need to activate an intermediate Take. For example, if TP 3 is activated and Breakeven on TP = 3, then after the price reaches this level, the Stop loss will go to Breakeven.
* This function will not work with Dynamic Stoplosses, because it simply does not make sense.
CoolDown # Bars — When activated, allows you to add a delay before a new trade is opened. A new trade after CoolDown will not be opened until # bars pass and a new signal appears.
_____________________________
⚉ TIME FILTERS ⚉
‾‾‾‾‾‾‾‾‾‾‾‾‾‾‾‾‾‾‾‾‾‾‾‾‾‾‾‾‾
Powerful time filter code that allows you to filter data based on specific time zones, dates, and session days. This code is ideal for those who need to analyze data from different time zones and weed out irrelevant data.
With Time Filter, you can easily set the starting and ending time zones by which you want to filter the data.
You can also set a start and end date for your data and choose which days of the week to include in the analysis. In addition, you can specify start and end times for a specific session, allowing you to focus your analysis on specific time periods.
_________________________________
⚉ SIGNAL FILTERS ⚉
‾‾‾‾‾‾‾‾‾‾‾‾‾‾‾‾‾‾‾‾‾‾‾‾‾‾‾‾‾‾‾‾‾
Signal Filters — allows you to easily customize and optimize your trading strategies based on 10 filters.
Each filter is designed to help you weed out inaccurate signals to minimize your risks.
Let's take a look at their features:
__________________________________
⚉ RISK MANAGEMENT ⚉
‾‾‾‾‾‾‾‾‾‾‾‾‾‾‾‾‾‾‾‾‾‾‾‾‾‾‾‾‾‾‾‾‾‾
Risk management tools that allow you to set the maximum number of losing trades in a row, a limit on the number of trades per day or week and other filters.
Loss Streak — Set Max number of consecutive loss trades.
Win Streak — Max Winning Streak Length.
Row Loss InDay — Max of consecutive days with a loss in a row.
DrawDown % — Max DrawDown (in % of strategy equity).
InDay Loss % — Set Max Intraday Loss.
Daily Trades — Limit the number of MAX trades per day.
Weekly Trades — Limit the number of MAX trades per week.
* 🡅 I would Not Recommend using these functions without understanding how they work.
Order Size — Position Size
• NONE — Use the default position size settings in Tab "Properties".
• EQUITY — The amount of the allowed position as a percentage of the initial capital.
• Use Net Profit — On/Off the use of profit in the following trades. *Only works if the type is EQUITY.
• SIZE — The size of the allowed position in monetary terms.
• Contracts — The size of the allowed position in the contracts. 1 Сontract = Сurrent price.
________________
⚉ NOTES ⚉
‾‾‾‾‾‾‾‾‾‾‾‾‾‾‾‾
It is important to note that I have never worked with Backtesting and the functions associated with them before.
It took me about a month of slow work to build this system.
I want to say Big Thanks:
• The PineScripters🌲 group, the guys suggested how to implement some features. Especially @allanster
• Thanks to all those people who share their developments for free on TV and not only.
• I also thank myself for not giving up and finishing the project, and not trying to monetize the system by selling it. * Although I really want the money :)
I tried hard to make it as fast and convenient as possible for everyone who will use my code.
That's why I didn't use any libraries and dozens of heavy functions, and I managed to fit in 8+-functions for the whole code.
Absolutely every block of code I tried to make full-fledged modular, that it was easy to import/edit for myself (you).
I have abused the Ternary Pine operator a little (a lot) so that the code was as compact as possible.
Nevertheless, I tried very hard to keep my code very understandable even for beginners.
At last I managed to write 500 lines of code, making it one of the fastest and most feature-rich systems out there.
I hope everyone enjoys my work.
Put comments and write likes.

Backtesting ModuleDo you often find yourself creating new 'strategy()' scripts for each trading system? Are you unable to focus on generating new systems due to fatigue and time loss incurred in the process? Here's a potential solution: the 'Backtesting Module' :)
INTRODUCTION
Every trading system is based on four basic conditions: long entry, long exit, short entry and short exit (which are typically defined as boolean series in Pine Script).
If you can define the conditions generated by your trading system as a series of integers, it becomes possible to use these variables in different scripts in efficient ways. (Pine Script is a convenient language that allows you to use the integer output of one indicator as a source in another.)
The 'Backtesting Module' is a dynamic strategy script designed to adapt to your signals. It boasts two notable features:
⮞ It produces a backtest report using the entry and exit variables you define.
⮞ It not only serves for system testing but also to combine independent signals into a single system. (This functionality enables to create complex strategies and report on their success!)
The module tests Golden and Death cross signals by default, when you enter your own conditions the default signals will be neutralized. The methodology is described below.
PREPARATION
There are three simple steps to connect your own indicator to the Module.
STEP 1
Firstly, you must define entry and exit variables in your own script. Let's elucidate it with a straightforward example. Consider a system generating long and short signals based on the intersections of two moving averages. Consequently, our conditions would be as follows:
// Signals
long = ta.crossover(ta.sma(close, 14), ta.sma(close, 28))
short = ta.crossunder(ta.sma(close, 14), ta.sma(close, 28))
Now, the question is: How can we convert boolean variables into integer variables? The answer is conditional ternary block, defined as follows:
// Entry & Exit
long_entry = long ? 1 : 0
long_exit = short ? 1 : 0
short_entry = short ? 1 : 0
short_exit = long ? 1 : 0
The mechanics of the Entry & Exit variables are simple. The variable takes on a value of 1 when your trading system generates the signal and if your system does not produce any signal, variable returns 0. In this example, you see how exit signals can be generated in a trading system that only contains entry signals. If you have a system with original exit signals, you can also use them directly. (Please mind the NOTES section below).
STEP 2
To utilize the Entry & Exit variables as source in another script, they must be plotted on the chart. Therefore, the final detail to include in the script containing your trading system would be as follows:
// Plot The Output
plot(long_entry, "Long Entry", display=display.data_window, editable=false)
plot(long_exit, "Long Exit", display=display.data_window, editable=false)
plot(short_entry, "Short Entry", display=display.data_window, editable=false)
plot(short_exit, "Short Exit", display=display.data_window, editable=false)
STEP 3
Now, we are ready to test the system! Load the Backtesting Module indicator onto the chart along with your trading system/indicator. Then set the outputs of your system (Long Entry, Long Exit, Short Entry, Short Exit) as source in the module. That's it.
FEATURES & ORIGINALITY
⮞ Primarily, this script has been created to provide you with an easy and practical method when testing your trading system.
⮞ I thought it might be nice to visualize a few useful results. The Backtesting Module provides insights into the outcomes of both long and short trades by computing the number of trades and the success percentage.
⮞ Through the 'Trade' parameter, users can specify the market direction in which the indicator is permitted to initiate positions.
⮞ Users have the flexibility to define the date range for the test.
⮞ There are optional features allowing users to plot entry prices on the chart and customize bar colors.
⮞ The report and the test date range are presented in a table on the chart screen. The entry price can be monitored in the data window.
⮞ Note that results are based on realized returns, and the open trade is not included in the displayed results. (The only exception is the 'Unrealized PNL' result in the table.)
STRATEGY SETTINGS
The default parameters are as follows:
⮞ Initial Balance : 10000 (in units of currency)
⮞ Quantity : 10% of equity
⮞ Commission : 0.04%
⮞ Slippage : 0
⮞ Dataset : All bars in the chart
For a realistic backtest result, you should size trades to only risk sustainable amounts of equity. Do not risk more than 5-10% on a trade. And ALWAYS configure your commission and slippage parameters according to pessimistic scenarios!
NOTES
⮞ This script is intended solely for development purposes. And it'll will be available for all the indicators I publish.
⮞ In this version of the module, all order types are designed as market orders. The exit size is the sum of the entry size.
⮞ As your trading conditions grow more intricate, you might need to define the outputs of your system in alternative ways. The method outlined in this description is tailored for straightforward signal structures.
⮞ Additionally, depending on the structure of your trading system, the backtest module may require further development. This encompasses stop-loss, take-profit, specific exit orders, quantity, margin and risk management calculations. I am considering releasing improvements that consider these options in future versions.
⮞ An example of how complex trading signals can be generated is the OTT Collection. If you're interested in seeing how the signals are constructed, you can use the link below.
THANKS
Special thanks to PineCoders for their valuable moderation efforts.
I hope this will be a useful example for the TradingView community...
DISCLAIMER
This is just an indicator, nothing more. It is provided for informational and educational purposes exclusively. The utilization of this script does not constitute professional or financial advice. The user solely bears the responsibility for risks associated with script usage. Do not forget to manage your risk. And trade as safely as possible. Best of luck!

Vortex Ocillator - backtestingbacktesting strategy for the vortex oscilator indicator, slightly modified on this version so that the buy and sell signals work with the backtesting and are consistant
original idea i posted by accident
the script with alerts
not intended to be financial advice, strategy is for made for testing
Biffy

Backtesting Period Selector | ComponentDescription
It's nice to quickly be able to set the backtesting period when writing strategies.
To make this process faster I wrote a simple 'component'.
So this is not a strategy but rather code you can plug-into your strategy and use
if you need that specific functionality.
Then it's just a matter of selecting which dates you want to backtest.
You can also chose to color the background to visually show the testing period.
Unfortunately, the background color is fixed at 'blue' for now.
Ps. I like the idea of writing small components to be pluged into other strategies
I'll try to develop this idea a bit further and see how small pieces of code can
easily provide specific functionality to assist and make deving strategies a bit less 'Pineful'.
Usage
First copy the instructed part of the component code over to your strategy.
Next, use the testPeriod() function to limit strategies to the specified backtesting period.
Example usage:
if testPeriod()
strategy.entry("LE", strategy.long)
Todo / Improvements
There are many ways to improve this component and I'm not a very good coder so this is a very crude solutions.
Anyway, here are some things which would be nice to improve:
1. Enable color selection so that the user can choose the background color of his own liking.
2. Improve naming of variables.
3. Test for ilogical choices, such as test period start being at a later date, than test period stop.
4. Account for time zones.
As always, any feedback, corrections or thoughts are very much welcome!
/pbergden
QFL single TF with alertsBacktesting compatible QFL pine script w/alerts
This version of QFL was made based on this one:
From author:
www.tradingview.com
I made the following additions according to my requirements:
- I need to use pine script 4
- I needed to avoid repainting issues so I'm not calling directly security, I'm using the wrapper function.
- There might be still repainting issues when you use "max base age" which uses the function "barssince" so be careful, you can disable it by setting its value to zero.
- Alerts so I can use it for automated trading and bots
- In order to make this signal compatible with the backtest script there's an option provided in the settings. If you enable this option this indicator will plot 1 whenever there's a BUY signal. This will allow the backtest to pick the "QFL Buy" from external indicator so it can perform the backtest.
I recommend some of these settings to start playing with the chart in 15 min / QFL in 1, 2 or 4 hours.
The higher the TF the more conservative.
QFL with 3.5% is pretty popular but you can try higher QFL percentage settings for a more conservative approach.

Backtesting 3commas DCA Bot v2Updating previously published simulated 3commas DCA logic with a sexier insert and more meaningful default parameters.