Market Sessions Table, H/L/POCHello Everyone,
This is my first effort and first script for the community. This indicator has two major parts
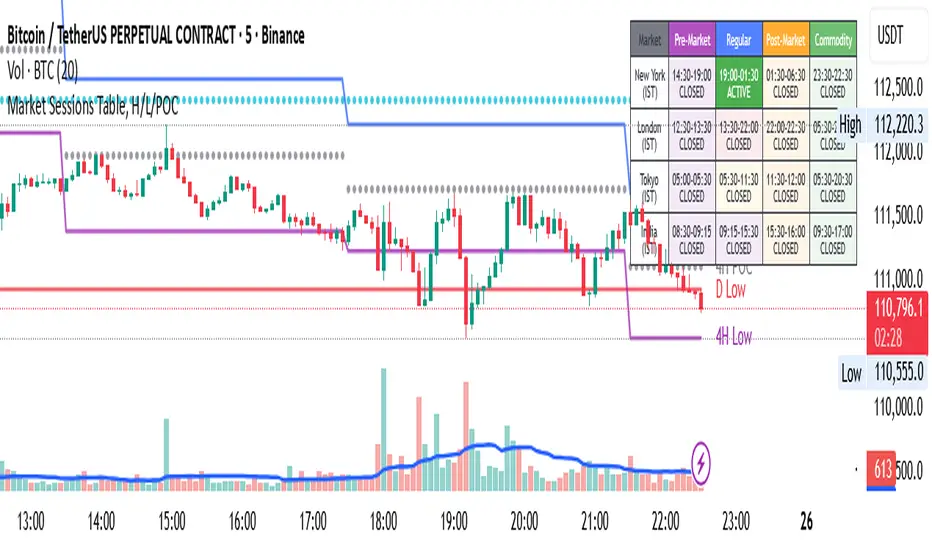
Table with Pre-Market Session Time, Regular Market Session Time and Commodity Market Session
High, Low and POC (Middle) of 4 Hour, Previous 1 Day and Last Week
This will mark the following:
High, Low and POC of 4 Hours Candle with Lines
High, Low and POC of previous day Candle with Lines
High, Low and POC of previous week Candle with Lines
User has option to either disable any or all the Lines.
User has option to change the color, size and line type (flat or dotted) on lines.
User also has an option to see the High, Low and POC in a separate table as well.
Table with Pre-Market Session Time, Regular Market Session Time and Commodity Market Session
As the name suggest this is a table which shows the Pre-Market Session Time, Regular Market Session Time and Commodity Market Session of US, UK, Tokyo and Indian Exchanges.
User has an ability to enable or disable any Exchange or session.
User can also enable or disable highlighting a particular market session in the chart background.
Additionally user can choose to display the different market session is there own local time zone. Since I am from India I choose to display the open and close of market session as per India standard time.
Guys please suggest any improvement or anything additional you wanted on the same indicator.
Pine Script® indicator