Traders Dynamic Index Indicator Alert v0.1 by JustUncleLThis is a trend trading indicator+alert utilising the Traders Dynamic Index (TDI), Price Action Channel (PAC) and Heikin Ashi candles.
About 6months ago I came across the use of TDI in "E.A.S.Y. Method" that I found in forexfactory forums: www.forexfactory.com
and I was able to set up a chart based on the specifications by using Kurbelklaus scripts. However, I found that the alerts were being generated one or two bars too late, so at that time I was not successful using it with Binary Options. A few months later I found a variation of the method in the forecfactory forums which is able to generate the alerts a bit earlier, so this indicator is a modification of that early detection version.
The indicator can optionally use Heikin Ashi candles only for all it's calculation. I would recommend viewing the chart with Heikin Ashi candles, these smooth out the trends and makes trends very clear.
I found that this method it works good with most currency pairs or commodities and with 5min+ timeframe charts. I would suggest expiry of 2 to 6 candles.
ALERT GENERATION:
=================
The TDI (Traders Dynamic Index)
---------------------------------------------
Volatility Band VB(34), color: Blue, buffer: UpZone, DnZone
Relative Strength Index RSI(13)
RSI PRICE LINE (2), color: Green, buffer: mab
RSI TRADE SIGNAL LINE (7), color: Red, buffer: mbb
MARKET BASE LINE MID VB(34), color: Orange, buffer: mid
Indicator SignalLevels:
-------------------------------
RSI_OversoldLevel : 22 (normally: 32)
RSI_OverboughtLevel : 78 (normally: 68)
Alert Conditions:
-----------------------
Strong Buy : yellow
Medium Buy : aqua
Weak Buy : blue
Strong Sell : fuchsia
Medium Sell : purple
Weak Sell : black
Hints on How to use:
----------------------------
- When a Medium or Strong alert is generated and MACD histogram colour matches the direction
of the alert (optional auto filter), then place trade in direction of alert candle and MACD.
- I use the multi-Hull MA's for overall trend direction confirmation.
- Best positions normally occur near the MACD(5,15,1) Histogram crossing the zero line.
- The optional coloured Dots along the bottom of the indicator represent the first alert
of this type that was generated in this sequence.
- It is advisable to trade in the direction of the main trend as indicated the HULL MA red cloud:
if red cloud underneath PAC then BULLISH trend, if red cloud above PAC then BEARISH trend.
- Selecting the HeiKin Ashi candles does affect the MACD and MA caculations, so if you select
normal candles the result chart will change. You can still Optionally select to use Heikin Ashi
for calculations.
- When using the Heikin Ashi candles, a good buy entry is indicated by long top wick and no bottom wick
for bull (green) candles and good sell entry is indicated by long bottom wick and no top wick for
bear (red) candles.
- When the MACD histogram is flat and close to zero line,
this indicates a ranging market, do NOT trade when this occurs.
- When the PAC channel on the main chart is spread apart widely, this is an indication
of extreme volatility and choppy chart, do NOT try to trade during these periods.
A choppy chart is also indicated by Heikin Ashi candles with long wicks on both sides
of the candles.
- You can specify what strength level Alerts are generated (default 2):
Level (1) means only generate Strong Alerts only.
Level (2) means generate Strong and Medium Alerts.
Level (3) means generate Strong, Medium and Weak Alerts.
Search in scripts for "trader dynamic index"

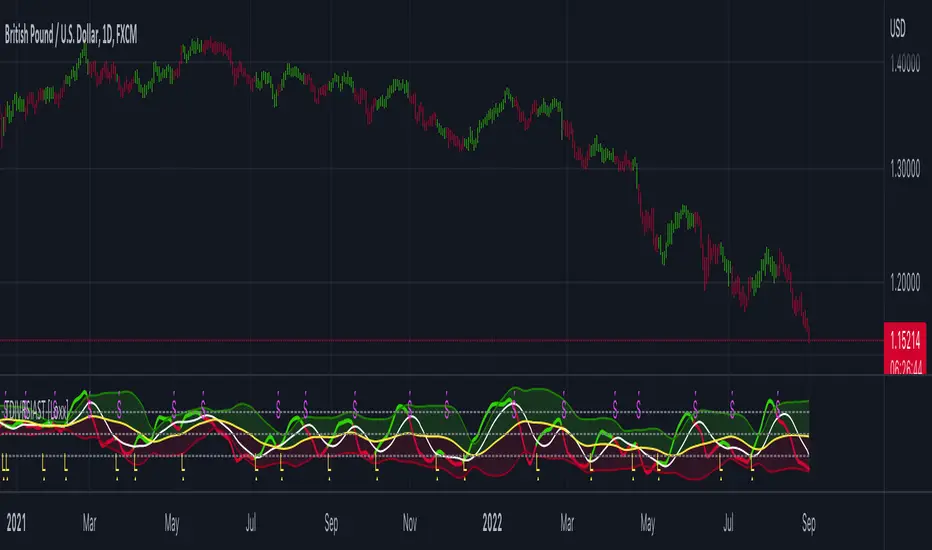
TDI - Traders Dynamic Index + RSI Divergences + Buy/Sell SignalsTraders Dynamic Index + RSI Divergences + Buy/Sell Signals
Credits to LazyBear (original code author) and JustUncleL (modifications)..
I added some new features:
1- RSI Divergences (Original code from 'Divergence Indicator')
2- Buy/Sell Signals with alerts (Green label 'Buy' - Red label 'Sell')
3- Background colouring when RSI (Green line) crosses above MBL (yellow line)
- Buy and Sell Signals are generated using Dean Malone's method (The Author of the TDI indicator) as mentioned in his PDF: (( www.forexfactory.com )), according to:
** Buy (Green Label) = RSI > 50, Red line, & Yellow line
** Sell (Red Label) = RSI < 50, Red line, & Yellow line
- I found that the best quality long trades generated when RSI crosses above red line, yellow line and they are all above 50, and vice versa for sell trades.
-I figured out another way to generate Buy/Sell Signals when RSI crosses above the yellow line, and you can stay with the trade till RSI crosses under the yellow line (I made a background colouring for that to be easily detected)
Hope you all wonderful trades..
مؤلف المؤشر هو (Dean Malone)
وكتب LazyBear كوده في tradingview
وأضاف JustUncleL بعض التعديلات عليه
أضفت إليه بعض المزايا الأخرى المتمثلة في:
1- رصد انحرافات مؤشر القوة النسبية
2- إشارات بيع وشراء بناء على طريقة مؤلف المؤشر
3- تظليل بالأخضر للمنطقة التي يعبر فيها مؤشر القوة النسبية الخط الأوسط (الخط الأصفر)
إشارات البيع والشراء تكون كالتالي:
** الشراء عندما يكون مؤشر القوة النسبية فوق الخط الأحمر وفوق خط الـ 50 وفوق الخط الأصفر
** البيع عندما يكون مؤشر القوة النسبية تحت الخط الأحمر وتحت خط الـ 50 وتحت الخط الأصفر
** أفضل إشارات الشراء حينما يعبر مؤشر القوة النسبية فوق الخط الأحمر والأصفر، ويكونوا جميعا فوق خط الـ 50، والعكس بالنسبة لإشارات البيع
يمكن استخدام المؤشر في دخول صفقات متوسط المدى، وذلك عندما يعبر مؤشر القوة النسبية فوق الخط الأصفر (قمت بتظليل المنطقة بالأخضر لسهولة رصدها) والخروج من الصفقة إذا نزل مؤشر القوة النسبية عن الخط الأصفر،
يرجى التنبه إلى أن الدخول والخروج يكون بأسباب فنية مدروسة، والمؤشر يدعم قراراتك فقط، ولا يمكن الاعتماد عليه منفردا في تحديد نقاط الدخول أوالخروج.
تجارة موفقة لكم جميعا :)

Delorean TDI - Traders Dynamic IndexTraders Dynamic Index (for the Delorean Strategy)
===============================================================
This indicator helps to decipher and monitor market conditions related to trend direction, market strength, and market volatility.
TDI has the following components:
* Green line = RSI Price line
* Red line = Trade Signal line
* Blue lines = Volatility Bands
* Yellow line = Market Base Line
Trend Direction - Immediate and Overall:
----------------------------------------------------
* Yellow line trends up and down generally between the lines 32 & 68. Watch for Yellow line to bounces off these lines for market reversal. Trade long when price is above the Yellow line, and trade short when price is below.
Market Strength & Volatility - Immediate and Overall:
----------------------------------------------------
* Immediate = Green Line -> Strong = Steep slope up or down.
* Immediate = Green Line -> Weak = Moderate to Flat slope.
* Overall = Blue Lines -> When expanding, market is strong and trending.
* Overall = Blue Lines -> When constricting, market is weak and in a range.
* Overall = Blue Lines -> When the Blue lines are extremely tight in a narrow range, expect an economic announcement or other market condition to spike the market.
Note Credit: LazyBear - altered for the Delorean Strategy

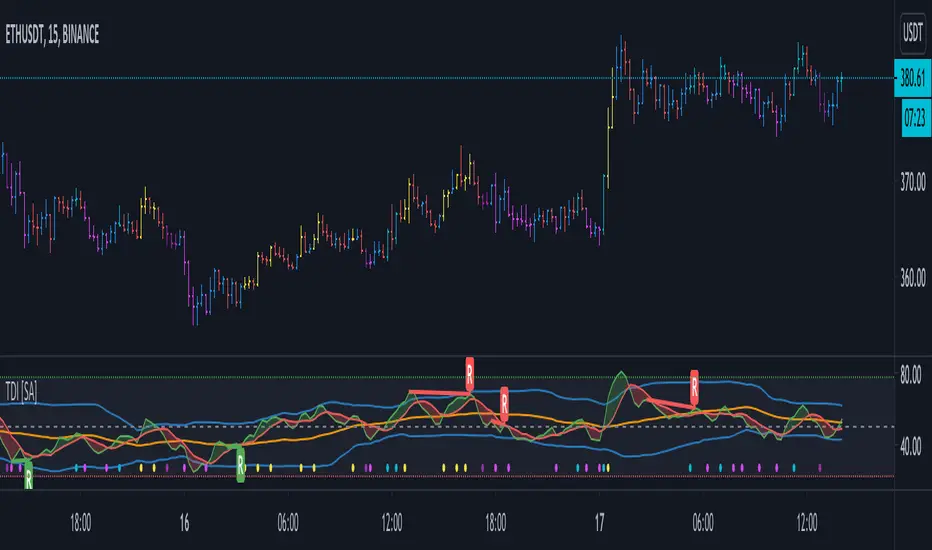
TDI - Traders Dynamic Index [SystemAlpha]Traders Dynamic Index with Divergence
Credits to the original code author LazyBear and modifications by JustUncleL
Waddah Attar Explosion with TDI First of all, a big shoutout to @shayankm, @LazyBear, @Bromley, @Goldminds and @LuxAlgo, the ones that made this script possible.
This is a version of Waddah Attar Explosion with Traders Dynamic Index.
WAE provides volume and volatility information. Also, WAE calculation was changed to a full-on MACD, to provide the momentum: the idea is to "assess" which MACD bars have significant momentum (i.e. crossover the Explosion Line)
TDI provides momentum, divergences as well as overbought and oversold areas. There is also a RSI on a different timeframe, for convergence.
Almost everything is editable:
- All moving averages are customizable, including the TRAMA, from @LuxAlgo
Waddah Attar Explosion_
- Three different crossing signals: histogram crossing contracting Explosion Line, expanding Explosion Line and ascending Explosion Line while both Bolling Bands are expanding; Explosion Line shows different color when expanding.
- Explosion line signals: Below DeadZone line and Exhaustion (highest value in a given lookback period). You can set a predefined EPL slope to filter out some noise.
- Deadzone signal : Deadzone squeeze ( lowst value in a given lookback period)
TDI:
- Overbought an Oversold signals. The OB and OS shapes have two colors, in order to display extreme signals on current timeframe or extreme signals on current and different time frame.
- Visual display of RSI outside the Bollinger Bands, and crossing of RSI Moving Average crossing of zero line.
I believe this combination is great for so many reasons!
Like the idea of TTM Squeeze? You can tune the Deadzone and Explosion lines to look for a volatility breakout
Like trading divergences or want to filter out extreme areas? The RSI is great for that
You like the using the MACD strategy but don't like the amount of false signals given? this WAE version filters some of them out.
If you are a Bollinger bands fan, you can customize both indicators to trade breakouts and/or mean reversion strategies, and filter out exhaustion of the bands expansion
This is my first publication, so give it a go and provide feedback if possible.

TDI Fibonacci Volatility Bands Candle Coloring [cryptalent]"This is an advanced Traders Dynamic Index (TDI) candle coloring system, designed for traders seeking precise dynamic analysis. Unlike traditional TDI, which typically relies on a 50 midline with a single standard deviation band (±1 SD), this indicator innovatively incorporates Fibonacci golden ratio multiples (1.618, 2.618, 3.618 times standard deviation) to create multi-layered dynamic bands. It precisely divides the RSI fast line (green line) position into five distinct strength zones, instantly reflecting them on the candle colors, allowing you to grasp market sentiment in real-time without switching to a sub-chart.
Core Calculation Logic:
RSI Period (default 20), Band Length (default 50), and Fast MA Smoothing Period (default 1) are all adjustable.
The midline is the Simple Moving Average (SMA) of RSI, with upper and lower bands calculated by multiplying Fibonacci multiples with Standard Deviation (STDEV), generating three dynamic band sets: 1.618, 2.618, and 3.618.
Traders can quickly identify the following scenarios:
Extreme Overbought Zone (Strong Bullish, Red): Fast line exceeds custom threshold (default 82) and breaks above the specified band (default 2.618). This often signals overheating, potentially a profit-taking point or reversal short entry, especially at trend tops.
Extreme Oversold Zone (Strong Bearish, Green): Fast line drops below custom threshold (default 28) and breaks below the specified band (default 2.618). This is a potential strong rebound starting point, ideal for bottom-fishing or long entries.
Medium Bullish Zone (Yellow): Fast line surpasses medium threshold (default 66) and stands above the specified band (default 1.618), indicating bullish dominance in trend continuation.
Medium Bearish Zone (Orange): Fast line falls below medium threshold (default 33) and breaks below the specified band (default 1.618), signaling bearish control in segment transitions.
Neutral Zone (No Color Change): Fast line within custom upper and lower limits (default 34~65), retaining original candle colors to avoid noise interference during consolidation.
Color priority logic flows from strong to weak (Extreme > Medium > Neutral), ensuring no conflicts. All parameters are highly customizable, including thresholds, band selections (1.618/2.618/3.618/Midline/None), color schemes, and even optional semi-transparent background coloring (default off, transparency 90%) for enhanced visual layering.
Applicable Scenarios:
Intraday Trading: Capture extreme color shifts as entry/exit signals.
Swing Trading: Use medium colors to confirm trend extensions.
Long-Term Trend Following: Filter noise in neutral zones to focus on major trends.
Supports various markets like forex, stocks, and cryptocurrencies. After installation, adjust parameters in settings to match your strategy, and combine with other indicators like moving averages or support/resistance for improved accuracy.
If you're a TDI enthusiast, this will make your trading more intuitive and efficient!

Indicators: Traders Dynamic Index, HLCTrends and Trix Ribbon1) Trix Ribbon
===============================================================
This was built on request. Many Stock/FX traders overlay multiple Trix lines to form the ribbon, this indicator makes it easy.
Also, optionally this can plot a BollingerBand on Trix_1.
More info on Trix:
stockcharts.com
2) High/Low/Close Trend Indicator
===============================================================
Simple indicator using EMAs of H/L/C. If blue line is above the red line, the trend is up, else down. Keep an eye on the zero line too.
3) Traders Dynamic Index
===============================================================
This hybrid indicator helps to decipher and monitor market conditions related to trend direction, market strength, and market volatility.
TDI has the following components:
* Green line = RSI Price line
* Red line = Trade Signal line
* Blue lines = Volatility Bands
* Orange line = Market Base Line
Trend Direction - Immediate and Overall:
----------------------------------------------------
* Immediate = Green over Red...price action is moving up.
Red over Green...price action is moving down.
* Overall = Orange line trends up and down generally between the lines 32 & 68. Watch for Orange line to bounces off these lines for market reversal. Trade long when price is above the Orange line, and trade short when price is below.
Market Strength & Volatility - Immediate and Overall:
----------------------------------------------------
* Immediate = Green Line - Strong = Steep slope up or down.
Weak = Moderate to Flat slope.
* Overall = Blue Lines - When expanding, market is strong and trending. When constricting, market is weak and in a range. When the Blue lines are extremely tight in a narrow range, expect an economic announcement or other market condition to spike the market.
Entry conditions:
----------------------------------------------------
* Scalping - Long = Green over Red,
Short = Red over Green
* Active - Long = Green over Red & Orange lines
Short = Red over Green & Orange lines
* Moderate - Long = Green over Red, Orange, & 50 lines
Short= Red over Green, Green below Orange & 50 line
Exit conditions:
----------------------------------------------------
If Green crosses either Blue lines, consider exiting when the Green line crosses back over the Blue line.
* Long = Green crosses below Red
* Short = Green crosses above Red
More info on a complete system using TDI:
www.forexmt4.com

[BACKTEST]Traders Dynamic Index Indicator Alert by JustUncleLBy request, this script is a "strategy" version of my "Traders Dynamic Index Indicator Alert" script, made available for backtesting to help find optimal trade settings for a particular asset.

Traders Dynamic Index(RSI) w/ Bull&Bear Control ZonesMomentum (RSI) is one of the most commonly used indicators for trading, but the vast majority of traders who use it, simply apply it as an oscillator to measure overbought and oversold conditions. However, momentum is much more complex than that and using a basic RSI fails to highlight these complexities.
What this highlights are some of the areas/zones that many people may not even know about or are unaware what the RSI can actually reveal about a particular trend.
What this indicator is showing:
Fast moving RSI (Green) - 1 period
Slow moving RSI (Red) - 9 period
Bollinger Bands
Relative Strength: 1 - 100
Bearish Control Zone: 30(Below) - 45
Bullish Control Zone: 60 - 70 (Above)
How this identifies trends:
Bear Market(Bearish Control Zone):
-Support: 20(Below) - 30
-Resistance: 55 - 65
-Momentum will test resistance but will fail to hold support at 50
Bull Market(Bullish Control Zone):
-Support: 45 - 50
-Resistance: 80 - 90(Above)
-Momentum will test support but will not continue past the 45 support
How this identifies reversals:
If a market is bullish, but loses support at 45 and tests 30, it has begun reversal. If a market is bearish, but breaks 60 and tests 70, it has begun reversal.
-A bull market reversal is confirmed if it finds resistance at 60 after testing bearish support
-A bear market reversal is confirmed if it finds support at 50 after testing bullish resistance
Slow & Fast RSI w/ Boll Bands:
-The Slow and Fast RSI crossovers will act as Intermediate trends within the Macro trend - Fast crosses slow, bullish. Slow cross fast, bearish.
-Use in confluence with the Macro trend.
-While under Bearish Control, the Slow RSI will act as resistance for the Fast RSI.
-While under Bullish Control, the Slow RSI will act as support for the Fast RSI.
-The two will have an impulsive crossover when the Macro trend reverses.
-The Bollinger Bands will act as a volatility gauge for potential approaching tests of Support & Resistances. (Expansions & Contractions)
This is an analog of TDIGM (GoldMinds)
-Added Bullish/Bearish Control Zones.
-Changed Fast RSI to Green and Slow RSI to Red.

Traders Dynamic Index [LazyBear] -- Added indicatorCredit goes to lazybear, I added blue/red indictor to help me spot things earlier

Advanced Session Profile Predictor with SR Boxes & ORAdvanced Session Profile Predictor with Momentum Arrows
Designed for intraday traders, this indicator analyzes price action across Asia, London, and New York sessions to predict market profiles and highlight key trading opportunities. By combining session-based profiling, Opening Range (OR) visualization, and momentum signals from Traders Dynamic Index (TDI), it offers a unique tool for anticipating trends, reversals, and breakouts. Ideal for forex, indices, and crypto on 15M–1H charts.
What Makes This Indicator Unique?
Unlike typical session indicators that only mark time zones or standard TDI scripts that focus on momentum, this tool:
Predicts market profiles (e.g., "Trend Continuation," "NY Manipulation") by analyzing session ranges and directional moves, offering actionable insights into how sessions interact.
Visualizes Opening Range (OR) boxes for the first 15 minutes of each session, helping traders spot early breakout levels.
Integrates TDI with momentum to generate precise bullish/bearish arrows, filtered by session context for improved reliability.
Simplifies decision-making with dynamic profile labels showing real-time long/short conditions based on price levels.
How Does It Work?
Session Tracking:
Asia (00:00–08:00 UTC, yellow), London (08:00–16:00 UTC, red), and New York (13:00–21:00 UTC, blue) sessions are highlighted with background colors and high/low lines (crosses).
OR boxes (first 15 minutes) are drawn for each session: yellow for Asia, red for London, blue for NY.
Profile Prediction:
Compares Asia and London session ranges and directions (e.g., trending if range > 1.5x 5-period SMA).
Examples:
Trend Continuation: Asia and London trend in the same direction—long above Asia high (uptrend) or short below Asia low (downtrend).
NY Manipulation: Asia trends, London consolidates—watch for NY breakouts at London high/low.
Displays the predicted profile and entry conditions in labels (e.g., "IF price hits 1.2000 LONG").
Momentum Arrows:
Uses TDI (RSI period 21, bands 34, fast MA 2) and 12-period momentum.
Green up arrow: Fast MA > upper band (>68) and momentum rising (bullish).
Red down arrow: Fast MA < lower band (<32) and momentum falling (bearish).
Support/Resistance (SR):
Plots dynamic SR boxes based on pivot highs/lows, filtered by volume (inspired by ChartPrime’s methodology, credited below).
How to Use It
Setup: Apply to a 15M–1H chart. Adjust time zone (default: UTC) and session times if needed. Customize TDI/momentum settings for sensitivity.
Trading:
Check the top-right labels for the current profile and entry conditions (e.g., "IF price hits LONG/SHORT").
Confirm entries with green up arrows (bullish) or red down arrows (bearish).
Use OR boxes and session high/low lines to identify breakout or reversal levels.
Example: In "NY Manipulation," wait for price to hit London high (long) or low (short) during NY session, confirmed by an arrow.
Best Markets: Forex (EUR/USD), indices (SPX500), crypto (BTC/USD) with sufficient intraday volatility.
Underlying Concepts
Session Profiling: Detects trends (range > SMA * threshold) and manipulation (e.g., London breaking Asia’s high/low) to predict NY behavior.
OR Boxes: Marks the first 15 minutes’ high/low as a breakout zone (time-based, 900,000 ms).
TDI + Momentum: Combines RSI-based bands with price change (close – close ) for momentum signals.
SR Boxes: Identifies pivots over a lookback period (default 20), scaled by ATR and filtered by volume thresholds.
Credits
The SR box logic is inspired by ChartPrime’s volume-filtered support/resistance methodology, adapted with custom breakout/hold detection. Original authors are credited for their foundational work.
Chart Setup
Displays session backgrounds, OR boxes, high/low lines, TDI arrows, and profile labels. Keep other indicators off for clarity.

Musashi_Fractal_Dimension === Musashi-Fractal-Dimension ===
This tool is part of my research on the fractal nature of the markets and understanding the relation between fractal dimension and chaos theory.
To take full advantage of this indicator, you need to incorporate some principles and concepts:
- Traditional Technical Analysis is linear and Euclidean, which makes very difficult its modeling.
- Linear techniques cannot quantify non-linear behavior
- Is it possible to measure accurately a wave or the surface of a mountain with a simple ruler?
- Fractals quantify what Euclidean Geometry can’t, they measure chaos, as they identify order in apparent randomness.
- Remember: Chaos is order disguised as randomness.
- Chaos is the study of unstable aperiodic behavior in deterministic non-linear dynamic systems
- Order and randomness can coexist, allowing predictability.
- There is a reason why Fractal Dimension was invented, we had no way of measuring fractal-based structures.
- Benoit Mandelbrot used to explain it by asking: How do we measure the coast of Great Britain?
- An easy way of getting the need of a dimension in between is looking at the Koch snowflake.
- Market prices tend to seek natural levels of ranges of balance. These levels can be described as attractors and are determinant.
Fractal Dimension Index ('FDI')
Determines the persistence or anti-persistence of a market.
- A persistent market follows a market trend. An anti-persistent market results in substantial volatility around the trend (with a low r2), and is more vulnerable to price reversals
- An easy way to see this is to think that fractal dimension measures what is in between mainstream dimensions. These are:
- One dimension: a line
- Two dimensions: a square
- Three dimensions: a cube.
--> This will hint you that at certain moment, if the market has a Fractal Dimension of 1.25 (which is low), the market is behaving more “line-like”, while if the market has a high Fractal Dimension, it could be interpreted as “square-like”.
- 'FDI' is trend agnostic, which means that doesn't consider trend. This makes it super useful as gives you clean information about the market without trying to include trend stuff.
Question: If we have a game where you must choose between two options.
1. a horizontal line
2. a vertical line.
Each iteration a Horizontal Line or a Square will appear as continuation of a figure. If it that iteration shows a square and you bet vertical you win, same as if it is horizontal and it is a line.
- Wouldn’t be useful to know that Fractal dimension is 1.8? This will hint square. In the markets you can use 'FD' to filter mean-reversal signals like Bollinger bands, stochastics, Regular RSI divergences, etc.
- Wouldn’t be useful to know that Fractal dimension is 1.2? This will hint Line. In the markets you can use 'FD' to confirm trend following strategies like Moving averages, MACD, Hidden RSI divergences.
Calculation method:
Fractal dimension is obtained from the ‘hurst exponent’.
'FDI' = 2 - 'Hurst Exponent'
Musashi version of the Classic 'OG' Fractal Dimension Index ('FDI')
- By default, you get 3 fast 'FDI's (11,12,13) + 1 Slow 'FDI' (21), their interaction gives useful information.
- Fast 'FDI' cross will give you gray or red dots while Slow 'FDI' cross with the slowest of the fast 'FDI's will give white and orange dots. This are great to early spot trend beginnings or trend ends.
- A baseline (purple) is also provided, this is calculated using a 21 period Bollinger bands with 1.618 'SD', once calculated, you just take midpoint, this is the 'TDI's (Traders Dynamic Index) way. The indicator will print purple dots when Slow 'FDI' and baseline crosses, I see them as Short-Term cycle changes.
- Negative slope 'FDI' means trending asset.
- Positive most of the times hints correction, but if it got overextended it might hint a rocket-shot.
TDI Ranges:
- 'FDI' between 1.0≤ 'FDI' ≤1.4 will confirm trend following continuation signals.
- 'FDI' between 1.6≥ 'FDI' ≥2.0 will confirm reversal signals.
- 'FDI' == 1.5 hints a random unpredictable market.
Fractal Attractors
- As you must know, fractals tend orbit certain spots, this are named Attractors, this happens with any fractal behavior. The market of course also shows them, in form of Support & Resistance, Supply Demand, etc. It’s obvious they are there, but now we understand that they’re not linear, as the market is fractal, so simple trendline might not be the best tool to model this.
- I’ve noticed that when the Musashi version of the 'FDI' indicator start making a cluster of multicolor dots, this end up being an attractor, I tend to draw a rectangle as that area as price tend to come back (I still researching here).
Extra useful stuff
- Momentum / speed: Included by checking RSI Study in the indicator properties. This will add two RSI’s (9 and a 7 periods) plus a baseline calculated same way as explained for 'FDI'. This gives accurate short-term trends. It also includes RSI divergences (regular and hidden), deactivate with a simple check in the RSI section of the properties.
- BBWP (Bollinger Bands with Percentile): Efficient way of visualizing volatility as the percentile of Bollinger bands expansion. This line varies color from Iced blue when low volatility and magma red when high. By default, comes with the High vols deactivated for better view of 'FDI' and RSI while all studies are included. DDWP is trend agnostic, just like 'FDI', which make it very clean at providing information.
- Ultra Slow 'FDI': I noticed that while using BBWP and RSI, the indicator gets overcrowded, so there is the possibility of adding only one 'FDI' + its baseline.
Final Note: I’ve shown you few ways of using this indicator, please backtest before using in real trading. As you know trading is more about risk and trade management than the strategy used. This still a work in progress, I really hope you find value out of it. I use it combination with a tool named “Musashi_Katana” (also found in TradingView).
Best!
Musashi

TDI 7 MA and HISTOGRAMTDI %K Histogram with 7 MA
Overview
This indicator enhances trend and momentum analysis using the %K line from the Traders Dynamic Index (TDI), combined with a 7-period moving average (MA) and a histogram.
How It Works
The script calculates %K (similar to Stochastic RSI), representing the relative price position within a given range.
A 7-period Simple Moving Average (SMA) is applied to smooth the %K line, reducing noise and improving trend clarity.
A histogram is plotted based on the difference between %K and the 7-period MA:
Green bars indicate that %K is above the 7-period MA, suggesting bullish momentum.
Red bars indicate that %K is below the 7-period MA, suggesting bearish momentum.
Key Features
-%K Line (Blue) – Reflects short-term momentum shifts.
-7-period MA (Purple) – Helps smooth out fluctuations in %K for better trend identification.
-Histogram (Green/Red Columns) – Highlights momentum shifts visually.
Overbought (68), Midpoint (50), and Oversold (32) Levels – Provides reference points for potential reversals or trend continuation.
How to Use
Bullish Confirmation: When the histogram turns green and %K is above the 7 MA, it suggests upward momentum.
Bearish Confirmation: When the histogram turns red and %K is below the 7 MA, it suggests downward momentum.
Overbought/Oversold Conditions: Use the 68 and 32 levels as potential reversal zones, but always confirm with price action.
Midpoint (50 Level): Acts as a dynamic support/resistance area for momentum shifts.
This indicator is suitable for trend-following and momentum-based trading strategies, whether on lower timeframes for scalping or higher timeframes for swing trading.
Try it out and integrate it with your trading system to refine your entries and exits!

TDI w/ Variety RSI, Averages, & Source Types [Loxx]This hybrid indicator is developed to assist traders in their ability to decipher and monitor market conditions related to trend direction, market strength, and market volatility. Even though comprehensive, the Traders Dynamic Index (TDI) is easy to read and use. This version of TDI has 7 different types of RSI, 38 different types of Moving Averages, 33 source types, and 5 types of signals as well as alerts and coloring. Default RSI type is set to Jurik's RSX. This indicator can be used on any timeframe.
Green/Red line = RSI Price line
White line = Trade Signal line
Dark Green/Red lines = Volatility Band
Yellow line = Market Base Line
Gray dashed lines = Horizontal boundary lines, oversold/overbought
5 Signal Types w/ Alerts
Signal Crosses = Green/Red line crosses over or under White line
Floating Boundary Crosses = Green/Red line crosses over or under upper Dark Green/ lower Red lines
Horizontal Boundary Crosses = Green/Red line crosses over or under Gray dashed upper/lower lines
Floating Middle Crosses = Green/Red line crosses over or under Yellow line
Horizontal Middle Crosses = Green/Red line crosses over or under Gray dashed middle line
Manual Signal Types (no alerts included, this requires manual analysis)
Volatility Band Signals (Dark Green/Red lines) = When the Dark Green/Red lines are expanding, the market is strong and trending. When Dark Green/Red lines are constricting, the market is weak and in a range. When the Dark Green/Red lines are extremely tight in a narrow range, expect an economic announcement or other market condition to spike the market
Beyond these simple signal rules, there are various other signals or methods that can be used to derive long/short/exit signals from TDI included slope of the Green/Red line and bounces off the Yellow line.
Included
Loxx's Expanded Source Types
Loxx's Variety RSI
Loxx's Moving Averages
Signals
Alerts
Bar coloring
KK_Traders Dynamic Index_Bar HighlightingHey guys,
this is one of my favorite scripts as it represents a whole trading system that has given me very good results!
I have only used it on Bitcoin so far but I am sure it will also work for other instruments.
The original code to this was created by LazyBear, so all props to him for this great script!
I have linked his original post down below.
You can find the full rules to the system in this PDF (which has also been taken from LBs post):
www.forexmt4.com
Here is a short summary of the rules:
Go long when (all conditions have to be met):
The green line is above 50
The green line is above the red line
The green line is above the orange line
The close is above the upper Band of the Price Action Channel
The candles close is above its open
(The green line is below 68)
Go short when (all conditions have to be met):
The green line is below 50
The green line is below the red line
The green line is below the orange line
The close is below the lower band of the Price Action Channel
The candles close is below its open
(The green line is above 32)
Close when:
Any of these conditions aren't true anymore.
I have marked two of the rules in brackets as they seem to cut out a lot of the profits this system generates. You can choose to still use these rules by checking the box that says "Use Original Ruleset" in the options.
The system also contains rules regarding the Heiken Ashi bars. However these aren't as specific as the other rules. This is where your personal judgement comes in and this part is hard to explain. Take a look at the PDF I have linked to get a better understanding.
So far, this is just the TDI trading system and LBs script, now what have I changed?
I have incorporated the Price Action Channel to the system and changed it so that it highlights the bars whenever the system is giving a signal. As long as the bars are green the system is giving a long signal, as long as they are red the system is giving a short signal. Keep in mind that this doesn't consider the bar size of the HA bars. I recommend coloring all bars grey via the chart settings in order to be able to see the bar highlighting properly.
I have also published the Price Action Channel seperately in case some of you wish to view the Channel.
I am fairly new to creating scripts so use it with caution and let me know what you think!
LBs original post:
The seperate Price Action Channel script:

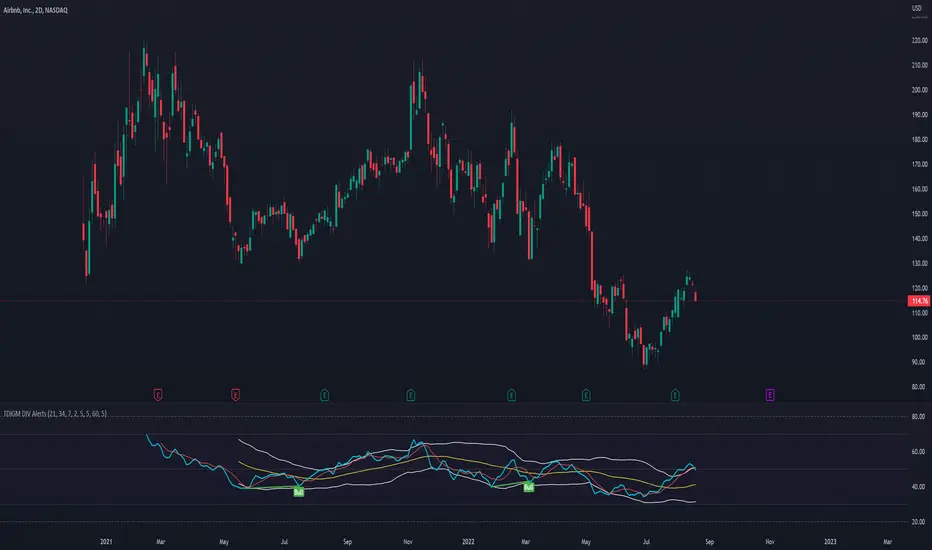
TDI - Traders Dynamic Index [Goldminds] with DIV RSI AlertsOriginally from Goldminds. Later modified by Jakub a Babo. I just added RSI DIV alerts. You're welcome. :)
Instruction: once you have have this indicator and press Alt + A to create alert.
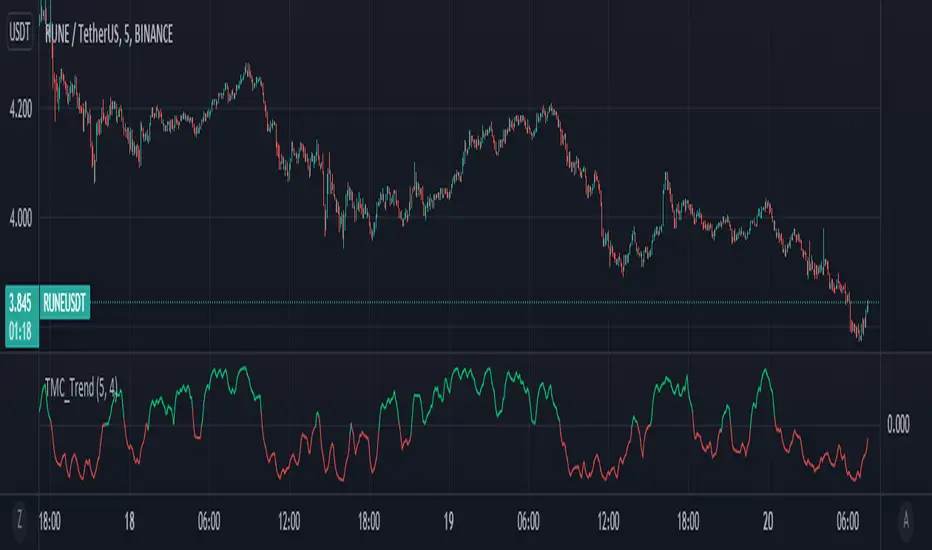
Too Many Cooks trend indicatorToo many Cooks in The Kitchen
You have probably heard the adage "Too many cooks spoils the broth" before. The meaning behind it is obviously that when to many people are trying to work on the same task at once it simply devolves into a fight for control and creates a mess of the situation. But is this true for indicators is the question I had and thus I made this indicator, a simple combination of 8 random trend finding indicators I assembled (A list of these indicators and their authors will be available at the bottom of this page) . Is it any good though ? In short yes, it is a decent trend finding indicator and could likely be used in your strategy in the place of your current trend finding indicator if you so wish. However much of the versatility of the individual indicators IS lost and would not be possible to get back in this big mess of a broth, so this indicator will not be the be all end all of trend indicators nor will it be a free money machine like you may be expecting looking at the list of included indicators so the adage was correct to a degree.
List of Authors and their included indicators
Trading View defaults:
MACD (Modified by me)
Stochastic RSI (Modified by me)
Lazy Bear:
Wavetrend Oscilator (Modified by me)
Traders Dynamic Index (Modified by me)
HACOLT (Modified by me)
Algokid
AK Trend
Racer8
Average Force
KivancOzbilgic
Average Sentiment Osclilator


TDI @ByPuppyTherapySimilar to my last TDI but was made with the ability to select different bases for both EMAs / BBs.
Only viable bases as far as i have seen are SMA / EMA / KAMA the rest would need much more research.
tradingstrategyguides.com
Mainly graphical changes for my layout + added coloring for all signals that came to my mind.
TEMA / Sentiment crossovers seems to be working a bit better than EMA.
I will update it with more usefull stuff late after i see its performance trading.

TDI - Traders Dynamic Index - Roshan [Mehdi]This method is based on Mr. Roshan's technique which use TDI with upper timeframe

