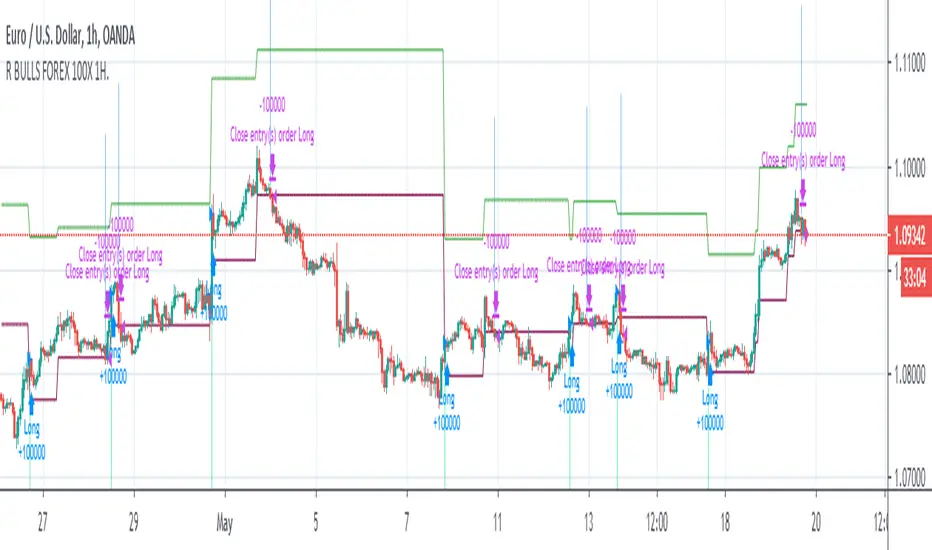
Relativity BULLS FOREX 100X 1H AlgorithmHi,
This system is prepared only for leveraged markets and only for Forex.
System parameters:
Timeframe = 1H (1 Hours)
Leverage = 100X
Position Size = %1 (0.01) Each Trade
System features :
- It targets the Risk /Reward Ratio of 1/3 and above. (Risk/Reward Ratio >= 3 )
- If a Take Profit Point has come in a successful trade but the parameter conformity has not deteriorated, system continues the trade.
- In this way, you can catch strong long trends several times a year.
But it is strict as stop-loss and avoids large declines,whipsaws whenever possible.
- The system tries to avoid unnecessary processes as much as possible.
This means less commission and less sideways market.
- Since it takes advantage of the reverse market, it is suitable not only for long and short but only for long position, ie "bulls".
But this neutralizes unnecessary processes.
- Stop-Loss points and Snow-take points are shown in red and green.
-However, if there is a small amount of follow-up available at the computer, it is recommended to put stop-loss only.
Because the system revises both stop-loss and take profit points according to the conditions formed.
Doing this in the right major long trend here allows you to be in trades.
-The system takes into account the risk and only opens transactions where the value corresponding to 100 leverage ratio is greater than the risk.
This provides as much protection from risk as possible.
-Alerts added.
***Since it is located in the most risky market, the forex market, a balanced algorithm has been optimized, considering that it has a very unstable structure similar to dilithrium crystals (same logic as investment bank trader test).
So if this algorithm was a person, it would be an incredibly disciplined but equally skeptical person =)
Also, like other systems, this system also uses ANN (Artificial Neural Networks).
About Backtest :
Since this system uses leveraged market, backtest results are not healthy.
But since it targets the 1/3 Risk Reward Rate (3.00),
we must look Ratio Avg Win/Loss and it must be over 0.5 because :
This ratio means: When we reach 33% of our correct trades in all our trades, we are at breakeven.
This is 100 - 33 = 66
33/66 = 0.5
So whenever this rate is over 0.5, we make a profit.
*** The fact that this ratio must over 0.75 (worst scenario) in terms of securing ourselves because there will be extra comission fees for worst scenario.
Above this ratios ,we can do successful snowball trades.(Because future contracts have loss of maturity and end dates)
And we achieve success cumulatively.
Important Note : This system is prepared only for these parameters.
NOTE :
The system has been prepared as a strategy to present success in a transparent manner.
Please check "Ratio Avg . Win / Avg Loss" rates in backtests.
Important Note 2 -
Although the system revises the stop and take profit points in the required parameters, the most accurate place is when the signal comes.
It should be entered when the signal comes as much as possible and if this did not happen,
trade must be opened in the nearest bars after the signal comes.
Best regards.
EDIT : Comission added. (%0.1)
Search in scripts for "trend"
Relativity BEARS FUTURES 50X 4H AlgorithmHi,
This system is prepared only for leveraged markets and for Futures and CFD markets.
Leveraged processing apply to cryptocurrency contracts that are also subject to.
System parameters:
Timeframe = 4H (4 Hours)
Leverage = 50X
Position Size = %1 (0.01) Each Trade
Market Direction : Short
System features :
- It targets the Risk /Reward Ratio of 1/3 and above. (Risk/Reward Ratio >= 3 )
- If a Take Profit Point has come in a successful trade but the parameter conformity has not deteriorated, system continues the trade.
- In this way, you can catch strong long trends several times a year.
But it is strict as stop-loss and avoids large declines,whipsaws whenever possible.
- The system tries to avoid unnecessary processes as much as possible.
This means less commission and less sideways market.
- Since it takes advantage of the reverse market, it is suitable not only for long and short but only for short position, ie "bears".
But this neutralizes unnecessary processes.
- Stop-Loss points and Snow-take points are shown in red and green.
-However, if there is a small amount of follow-up available at the computer, it is recommended to put stop-loss only.
Because the system revises both stop-loss and take profit points according to the conditions formed.
Doing this in the right major long trend here allows you to be in trades.
-The system takes into account the risk and only opens transactions where the value corresponding to 10 leverage ratio is greater than the risk.
This provides as much protection from risk as possible.
-Alerts added.
About Backtest :
Since this system uses leveraged market, backtest results are not healthy.
But since it targets the 1/3 Risk Reward Rate (3.00),
we must look Ratio Avg Win/Loss and it must be over 0.5 because :
This ratio means: When we reach 33% of our correct trades in all our trades, we are at breakeven.
This is 100 - 33 = 66
33/66 = 0.5 (Ratio Avg. Win / Avg Loss )
So whenever this rate is over 0.5, we make a profit.
*** The fact that this ratio is over 0.70-1.00 in terms of securing ourselves because there is a maturity in the future indicates that we are doing
successful snowball trades.(Because future contracts have loss of maturity and end dates)
And we achieve success cumulatively.
Important Note : This system is prepared only for these parameters.
These parameters are designed for Futures and CFDs.
It doesn't work in spot markets and Forex Markets.
NOTE :
The system has been prepared as a strategy to present success in a transparent manner.
Please check "Ratio Avg . Win / Avg Loss" rates in backtests.(Especially preferred financial instruments what you trade generally)
Important Note 2 -
Although the system revises the stop and take profit points in the required parameters, the most accurate place is when the signal comes.
It should be entered when the signal comes as much as possible and if this did not happen,
trade must be opened in the nearest bars after the signal comes.
If the position is not closed, renew your position in the new month by observing the maturity conditions.
Here you should pay attention to the maturity, the cost of transportation.
Because the more time to maturity, the more advantageous it will be.
Best regards.

Relativity BULLS FUTURES 50X 4H AlgorithmHi,
This system is prepared only for leveraged markets and for Futures and CFD markets.
Leveraged processing apply to cryptocurrency contracts that are also subject to.
System parameters:
Timeframe = 4H (4 Hours)
Leverage = 50X
Position Size = %1 (0.01) Each Trade
System features :
- It targets the Risk /Reward Ratio of 1/3 and above. (Risk/Reward Ratio >= 3 )
- If a Take Profit Point has come in a successful trade but the parameter conformity has not deteriorated, system continues the trade.
- In this way, you can catch strong long trends several times a year.
But it is strict as stop-loss and avoids large declines,whipsaws whenever possible.
- The system tries to avoid unnecessary processes as much as possible.
This means less commission and less sideways market.
- Since it takes advantage of the reverse market, it is suitable not only for long and short but only for long position, ie "bulls".
But this neutralizes unnecessary processes.
- Stop-Loss points and Snow-take points are shown in red and green.
-However, if there is a small amount of follow-up available at the computer, it is recommended to put stop-loss only.
Because the system revises both stop-loss and take profit points according to the conditions formed.
Doing this in the right major long trend here allows you to be in trades.
-The system takes into account the risk and only opens transactions where the value corresponding to 10 leverage ratio is greater than the risk.
This provides as much protection from risk as possible.
-Alerts added.
About Backtest :
Since this system uses leveraged market, backtest results are not healthy.
But since it targets the 1/3 Risk Reward Rate (3.00),
we must look Ratio Avg Win/Loss and it must be over 0.5 because :
This ratio means: When we reach 33% of our correct trades in all our trades, we are at breakeven.
This is 100 - 33 = 66
33/66 = 0.5
So whenever this rate is over 0.5, we make a profit.
*** The fact that this ratio is over 0.70-1.00 in terms of securing ourselves because there is a maturity in the future indicates that we are doing
successful snowball trades.(Because future contracts have loss of maturity and end dates)
And we achieve success cumulatively.
Important Note : This system is prepared only for these parameters.
These parameters are designed for Futures and CFDs.
It doesn't work in spot markets and Forex Markets.
NOTE :
The system has been prepared as a strategy to present success in a transparent manner.
Please check "Ratio Avg . Win / Avg Loss" rates in backtests.
Important Note 2 -
Although the system revises the stop and take profit points in the required parameters, the most accurate place is when the signal comes.
It should be entered when the signal comes as much as possible and if this did not happen,
trade must be opened in the nearest bars after the signal comes.
If the position is not closed, renew your position in the new month by observing the maturity conditions.
Here you should pay attention to the maturity, the cost of transportation.
Because the more time to maturity, the more advantageous it will be.
Best regards.

Relativity BEARS FUTURES 10X 1D AlgorithmHi,
This system is prepared only for leveraged markets and for Futures and CFD markets.
Leveraged processing apply to cryptocurrency contracts that are also subject to.
System parameters:
Timeframe = 1D (1 Day)
Leverage = 10x
Position Size = %1 (0.01) Each Trade
System features :
- It targets the Risk /Reward Ratio of 1/3 and above. (Risk/Reward Ratio >= 3 )
- If a Take Profit Point has come in a successful trade but the parameter conformity has not deteriorated, system continues the trade.
- In this way, you can catch strong long trends several times a year.
But it is strict as stop-loss and avoids large declines,whipsaws whenever possible.
- The system tries to avoid unnecessary processes as much as possible.
This means less commission and less sideways market.
- Since it takes advantage of the reverse market, it is suitable not only for long and short but only for short position, ie "bears".
But this neutralizes unnecessary processes.
- Stop-Loss points and Snow-take points are shown in red and green.
-However, if there is a small amount of follow-up available at the computer, it is recommended to put stop-loss only.
Because the system revises both stop-loss and take profit points according to the conditions formed.
Doing this in the right major long trend here allows you to be in trades.
-The system takes into account the risk and only opens transactions where the value corresponding to 10 leverage ratio is greater than the risk.
This provides as much protection from risk as possible.
-Alerts added.
About Backtest :
Since this system uses leveraged market, backtest results are not healthy.
But since it targets the 1/3 Risk Reward Rate (3.00),
we must look Ratio Avg Win/Loss and it must be over 0.5 because :
This ratio means: When we reach 33% of our correct trades in all our trades, we are at breakeven.
This is 100 - 33 = 66
33/66 = 0.5
So whenever this rate is over 0.5, we make a profit.
*** The fact that this ratio is over 0.70-1.00 in terms of securing ourselves because there is a maturity in the future indicates that we are doing
successful snowball trades.(Because future contracts have loss of maturity and end dates)
And we achieve success cumulatively.
Important Note : This system is prepared only for these parameters.
These parameters are designed for Futures and CFDs.
It doesn't work in spot markets and Forex Markets.
NOTE :
The system has been prepared as a strategy to present success in a transparent manner.
Please check "Ratio Avg . Win / Loss" rates in backtests.
Important Note 2 -
Although the system revises the stop and take profit points in the required parameters, the most accurate place is when the signal comes.
It should be entered when the signal comes as much as possible and if this did not happen,
trade must be opened in the nearest bars after the signal comes.
Here you should pay attention to the maturity, the cost of transportation.
Because the more time to maturity, the more advantageous it will be.
Best regards.

Relativity BULLS FUTURES 10X 1D AlgorithmHi,
This system is prepared only for leveraged markets and for Futures and CFD markets.
Leveraged processing apply to cryptocurrency contracts that are also subject to.
System parameters:
Timeframe = 1D (1 Day)
Leverage = 10x
Position Size = %1 (0.01) Each Trade
System features :
- It targets the Risk /Reward Ratio of 1/3 and above. (Risk/Reward Ratio >= 3 )
- If a Take Profit Point has come in a successful trade but the parameter conformity has not deteriorated, system continues the trade.
- In this way, you can catch strong long trends several times a year.
But it is strict as stop-loss and avoids large declines,whipsaws whenever possible.
- The system tries to avoid unnecessary processes as much as possible.
This means less commission and less sideways market.
- Since it takes advantage of the reverse market, it is suitable not only for long and short but only for long position, ie "bulls".
But this neutralizes unnecessary processes. (Short market direction, the system for bears will be published separately.)
- Stop-Loss points and Snow-take points are shown in red and green.
-However, if there is a small amount of follow-up available at the computer, it is recommended to put stop-loss only.
Because the system revises both stop-loss and take profit points according to the conditions formed.
Doing this in the right major long trend here allows you to be in trades.
-The system takes into account the risk and only opens transactions where the value corresponding to 10 leverage ratios is greater than the risk.
This provides as much protection from risk as possible.
-Alerts added.
About Backtest :
Since this system uses leveraged market, backtest results are not healthy.
But since it targets the 1/3 Risk Reward Rate (3.00),
we must look Ratio Avg Win/Loss and it must be over 0.5 because :
This ratio means: When we reach 33% of our correct trades in all our trades, we are at breakeven.
This is 100 - 33 = 66
33/66 = 0.5
So whenever this rate is over 0.5, we make a profit.
*** The fact that this ratio is over 0.70-1.00 in terms of securing ourselves because there is a maturity in the future indicates that we are doing
successful snowball trades.(Because future contracts have loss of maturity and end dates)
And we achieve success cumulatively.
Important Note : This system is prepared only for these parameters.
These parameters are designed for Futures and CFDs.
It doesn't work in spot markets.
NOTE :
The system has been prepared as a strategy to present success in a transparent manner.
Please check "Ratio Avg. Win / Loss" rates in backtests.
Important Note 2 -
Although the system revises the stop and take profit points in the required parameters, the most accurate place is when the signal comes.
It should be entered when the signal comes as much as possible and if this did not happen,
trade must be opened in the nearest bars after the signal comes.
Best regards.

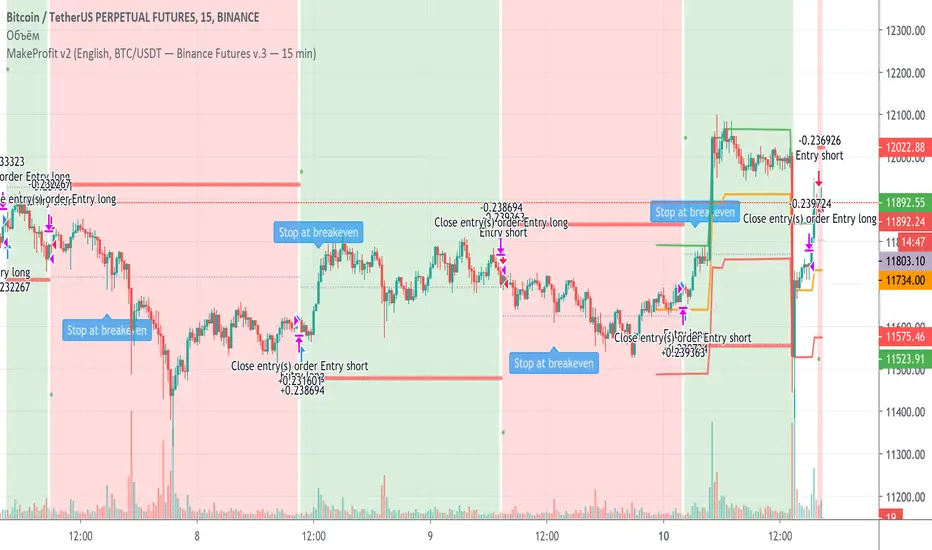
MakeProfit v2The Make Profit Club team has developed a new generation indicator that allows you to choose certain strategies calculated by us at a distance and simply enter a position based on our signals with our algorithms
Each partner who is trying to make money on the stock exchange shall from part of trust not only to us but to your head before you start earning.
We added the most popular strategies for Bitcoin and altcoins to the indicator, but we also didn't forget about currencies like EUR/USD and EUR/USD/RUB.
The indicator additionally works with scalpel levels, which you can buy back (as well as trade in the specified scalpel corridor).
Not only scalping strategies are included, but also trend trading. Let's say that the 45-minute strategy on bitcoin gave almost 700% of the profit for 45 weeks (1-4 hours and 1 day are also available).
For the most unintelligent, we have added entry levels, exit levels, levels where you can enter a trade if you do not have time for the signal, and many other features that you will not find anywhere else.
We will constantly add new strategies and improve our own.
You can get test access by contacting me.
Команда Make Profit Club разработала индикатор нового поколения, позволяющий выбрать определенные стратегии, просчитанные нами на дистанции и просто входить в позицию по нашим сигналам с нашими алгоритмами
Каждый партнер, который пытается заработать на бирже должен от части довериться не только нам, но и своей голове, прежде чем начать зарабатывать.
В индикатор мы добавили самые ходовые стратегии для Bitcoin и altcoins, но и не забыли про валюты по типу EUR/USD and EUR/USD/RUB.
Индикатор дополнительно работает со скальповыми уровнями, по которым вы сможете докупаться (а также торговать в указанном скальповом коридоре).
Включены не только скальповые стратегии, но и торговля по тренду. Допустим, стратегия по 45 минут на биткоине дала почти 700% прибыли за 45 недель (доступны еще и 1-4 часа, и 1 день).
Для самых несообразительных мы добавили уровни входа, уровни выхода, уровни, где можно зайти в сделку, если не успели по сигналу и еще очень много других функций, которых вы нигде не найдете.
Обратившись ко мне, вы можете получить тестовый доступ.
Pin-Bar + VWAP StrategyThis strategy is a modified pin-bar reversals strategy I had implemented before. This one goes long when you have a bullish trend (vwap > ema and px > both) and a pinbar happens at the vwap in bullish direction. opposite for shorts.

D1MA5.v1 - MandorGantengDisclaimer = On
Use Timeframe "DAILY ONLY"
This strategy base on follow the higher trend, breakout and trend reverse.
Signal active at 00.00
Rememmber to use trailing stop(hold your profit) and cutlose your losses.
Catatan: Akan di perbaharui dengan fitur baru.

D1MA5 - MandorGantengDisclaimer:
Signal active at 00.00
If running profit, use Trailing stop.
This strategy base on follow the higher trend. Just hold your winning, cutlose your losses.
Indonesia, D1MA5 ialah teknik breakout reversal arah trend dan mengikutinya.
Pakai lot dengan bijak, saya rekomendasikan mulai dari 0,01 s.d 0,03 per entry.
Goodluck, trade with care
Note = Akan terus dikembangkan/update fitur tambahan

BKN: Hickory Smoked StrategyThis strategy is to be used with the BKN: Hickory Smoked Indicator. This is a strategy that thrives in trending environments. We've included settings for crypto and forex and lower speed options for lower timeframes.
The script offers a stop loss or trailing stop loss that will trigger when an entry is triggered. You can also choose to use it as long or short only. Pictured is the LONG only settings.
You can use this strategy to backtest settings for the indicator.
***IMPORTANT***
For access, please do not comment below. Instead, send a DM here on TradingView or on my linked Twitter account.

Monthly MA Close Generates buy or sell signal if monthly candle closes above or below the signal MA.
Long positions only.
Inputs:
-Change timeframe MA
-Change period MA
-Use SMA or EMA
-Display MA
-Use another ticker as signal
-Select time period for backtesting
This script is not necessarily written to maximize profits, but to minimize losses.
Although it can outperform 'Buy & Hold' on some occasions when there is a multiple month bearisch trend.
You can optimise this strategy by changing the signal MA inputs.
I would suggest aiming for the best Profit Factor starting from the monthly ("M") setting.
You can always fine-tune the results at a lower timeframe.
The option to use another ticker for providing signals can give you a more stable and unified results.
For example using AMEX:SPY as signal with default parameters gives better results with NASDAQ:AAPL than if you would use NASDAQ:AAPL itself.
I used the anti-repainting function from PineCoders to prevent repainting.
This script is best used for multi-month trading positions & Daily or 4H setting of your chart.

BTC 5 min + ATRThis STUDY is optimized for bitcoin ( BTCPERP on deribit)
It catch fast trades going with the trend, so it should work in trends like in consolidation.
This strategy is based on S/R mixed with parabolic SAR , the point is to catch a movement when it's starting and confirmed.
It's optimized for 5 min timeframe, you might try it on other other tf but change the SL/TP too.
You should used it for few minutes scalp, fast enter and exit, on 5 min TF.
UPDATE ! This time it usenormal candle
The new idea is to filter trades by ATR, and by this way to NOT trade consolidation.
Have fun :)
Rules:
- Use small position, max leverage x5
- Place TP between 70$
- Place SL at 50$
- Entre in position by limit, you get paid for it
Enjoy, test it and make some money :)
No repaint.

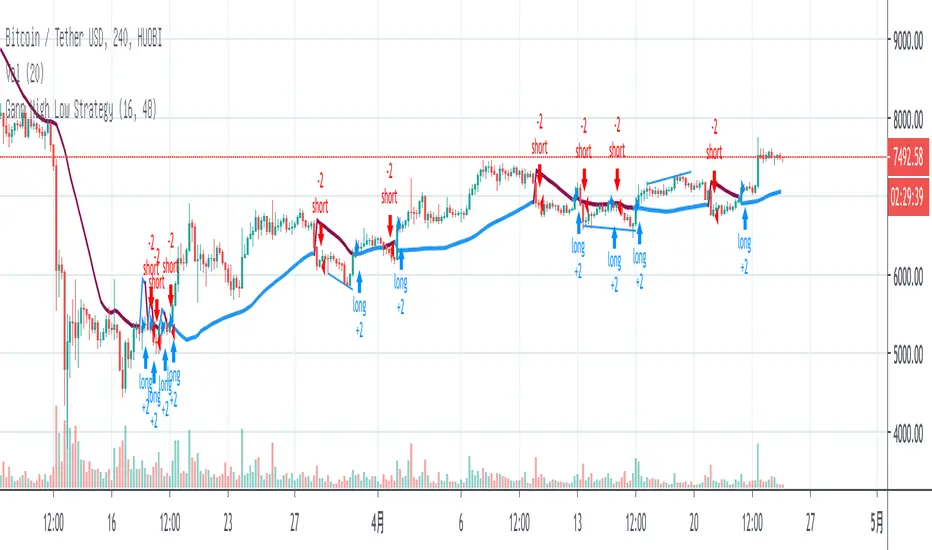
Gann High Low StrategyGann High Low is a moving average based trend indicator consisting of two different simple moving averages.
The Gann High Low Activator Indicator was described by Robert Krausz in a 1998 issue of Stocks & Commodities Magazine. It is a simple moving average SMA of the previous n period's highs or lows.
The indicator tracks both curves (of the highs and the lows). The close of the bar defines which of the two gets plotted.
BT Profit Sniper: Insiders EditionBT Profit Sniper: Insiders Edition is an Strategy accompaniment for “Profit Sniper : Insiders Edition”, designed to evaluate the success of the long & short alerts generated to facilitate trading in BTCUSD.
The flags are derived from Bollinger Bands and Chande Momentum operating in higher & lower timeframes, as well as our own bespoke stochastic ribbons that when combined, provide insight into trend pivots as they happen.
For access, please send us a Personal Message.

Strategy Follow Line MTF Any MM AverageThe objective is only to evaluate different configurations of the indicator "Follow Line MTF Any MM Average".
The strategy does not have position management, it's very basic, this indicator should be used to see trend, range zones, evaluate the best areas to enter the market, use higher time frames to confirm a direction can be useful.
I do not recommend using only this indicator to trade, because you can lose all your money if you do not know what you are doing.
I hope you find it useful.
Successes
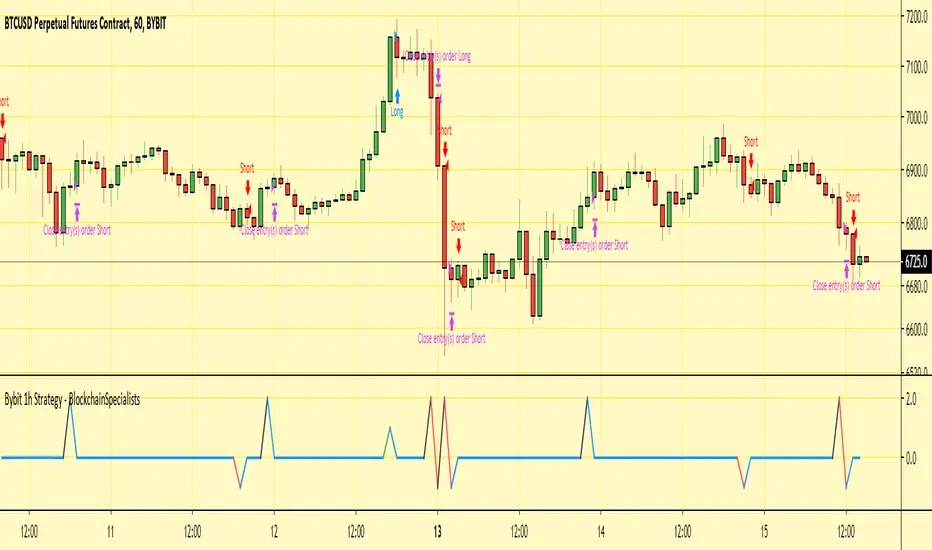
Bybit 1h Strategy - BlockchainSpecialistsHi,
This strategy is a combination of multiple different trend identifying and mean reversion indicators. It aims to work on all Bybit Crypto/USD pairs on the hourly time frame. It works on other time frames but not to the same levels of success. I've tried to keep it as simple as possible by making the indicator flash or alert when a long/short entry has been identified, and also when long/short exit criteria has been met. Make sure to wait until the candle has closed and the indicator has finished forming otherwise you could get jumpy alerts. To clarify this is what you need to look out for:
1 = Long Signal
-1 = Short Signal
2 = Long/Short exit (this will only flash when a position is currently open)
I've also colour coded the signals to make it even simpler and even prettier.
Any questions/issues/suggestions let me know.
Please enjoy!
TITAN StrategyTitan Strategy it's a Volatility & price action indicator giving you the exact point of exit or stop or reversal
with 2 different lengths represent as 2-time frames to drive the trend and reversals during the bear market and the bull market
with one adjustable level of taking profit and one adjustable stop loss level.
Grate for swing trading and Bullrun recognition and scalp those short trade into the bear market
and there its 2 more timeframes or lengths for the short environments where titan will scalp short into the average true range
default settings are at 4% stop loss and 4% take profit
How to use :
Buy Signal: long condition
Sell Signal: Short condition
If you like to know how to apply to the service please send me a private msg
we have a full pdf guide that comes with indicator its will be provided to you for mentoring propose
thx for your time and support

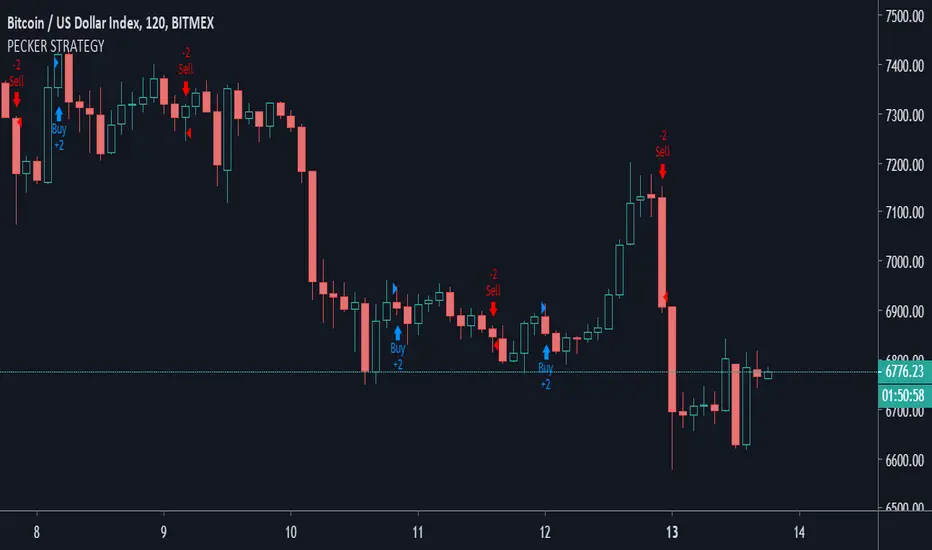
PECKER STRATEGYStrategy works best on higher time frames 1h+ (best performance in bitcoin on 2Hr candles) and in the default settings tested on Bitcoin XBT/USD on Bitmex
It is designed to detect trend changes, reverses in price movements and to always be in position, either long or short.
Strategy has only two types of signals, either long or short to indicate trend switch.
Do not forget to set taker's fee 0.075% on bitmex for example and to account for slippage.
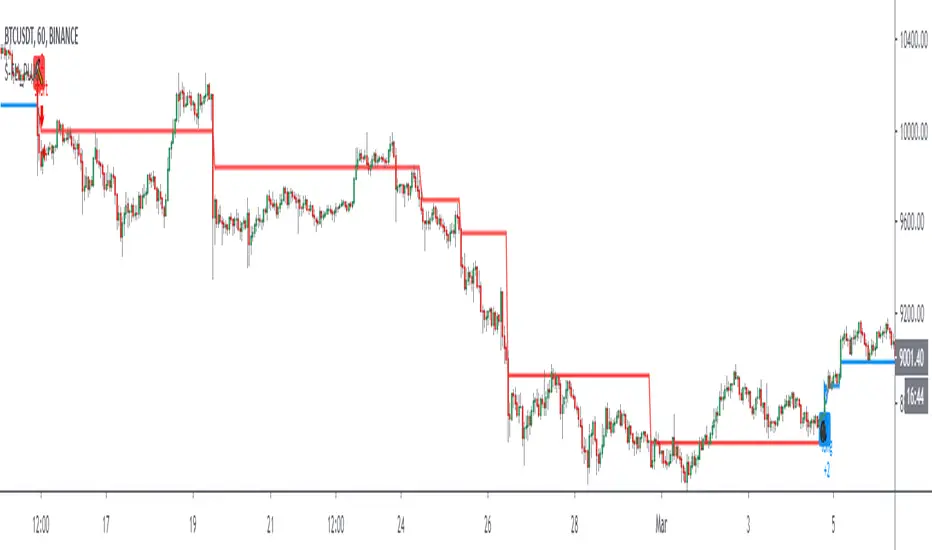
Gap Filling Strategy Gaps are market prices structures that appear frequently in the stock market, and can be detected when the opening price is different from the previous closing price, this is why gaps are also called "opening price jumps". While gaps can occur frequently, some of them are more significant than others, and can be observed when looking at a long term chart.
The following strategy is based on the exploitation of significant gaps occurring during a new session, and posses various options that can return a wide variety of results.
Type Of Gaps And Occurence
I'am not a professional when it comes to gaps, but as you know the stock market close for the day, however it is still possible to place orders, your broker will hold them until the market open back. Once the market reopen the broker execute the pending orders, and when many orders where pending the market register really high volume and the price might differ from the precedent close.
Gaps are generally broken down into four types:
Common : Gaps occurring within a certain price range, mostly occurs during ranging markets.
Break Away : Gaps breaking a support and resistance, making a new higher high/lower low.
Runaway : Gaps occurring within a trend, followed by a continuation of the trend.
Exhaustion : Gaps occurring at the end of a trend, followed by a reversal.
As said before, some gaps are more significant than others, the significance of a gap can be determined by comparing the opening price with the previous high/low price and by looking at volume. Significant up gaps will have an opening price greater than the previous high, while significant down gap will have an opening price lower than the previous low with both high volume accompanying them.
After a gap, when the price go back to the point previous to the gap we say that it has been "filled", this characteristic is what will be exploited in this strategy.
Strategy Rules & Logic
In this strategy, the significance of a gap is determined by the position of the opening price relative to the previous high/low and make sure the bar following the gap don't fill it.
When the setting invert is set to false the strategy interpret the detected gaps as being exhaustion gaps, therefore when an up gap occur a short position is opened, when a down gap occur a long position is opened. When invert is set to true gaps are considered to be runaway or break away gaps, therefore the contrary positions are opened. Positions are exited when the gap has been filled, which in the chart is show'n when the price cross the red level who act as either a take profit (invert = false) or as a stop loss (invert = true).
There are various closing conditions available that the user can select from the "close when" setting.
New Session : This option close all previous positions when the market is in a new session.
New Gap : This option close all previous position when a new gap has been detected.
Reverse Position : This option close all previous position when a contrary position to the current one is opened. This option would reduce the number of trades.
Testing On Some Stocks
The analysis will be tested in different tech stocks with a main TF of 15 minutes with no spread and commissions applied. Default settings will be used. We'll be making our first analysis using AMD, who has recently formed a full reverse HS pattern, where the neckline has been crossed by the price. (by the way i have a bad feeling about it, hey ! feeling filling ! Lame jokes!)
Profit: $ -12.22
Trades: 272
Profitability: 65.07 %
We can see negative results, with an heavily decreasing balance. Using invert would return positive results.
We will now test the strategy on NVDA, the company is one of the biggest when it comes to the Gpu market.
Profit: $ -215.54
Trades: 297
Profitability: 60.27 %
Not better, using invert would of course create better results. Like AMD the balance is heavily decreasing.
Finally we will test the strategy on Seagate technology, a company mostly known for their mechanical hard drives.
Profit: $ -4.32
Trades: 261
Profitability: 65.9 %
Here the balance does not appear so heavily decreasing and even managed to reach back the initial balance before going down again.
Summary
A strategy based on gap filling has been briefly introduced and tested with 3 tech stocks. The results show that using invert option might be better. The advantage of this strategy against ones using technical indicators is that this one does not heavily depend on user settings, which make it way more efficient, this a big advantage of patterns based strategies.
Thx to LucF for helping with the "process_orders_on_close" element, since i had to use closing price i had to remove it tho, was afraid results would differ even more from a more realistic backtest. And thx for those who continuously support me, more cool stuff is coming up.
Thx for reading and i hope you'll have learned something new today !

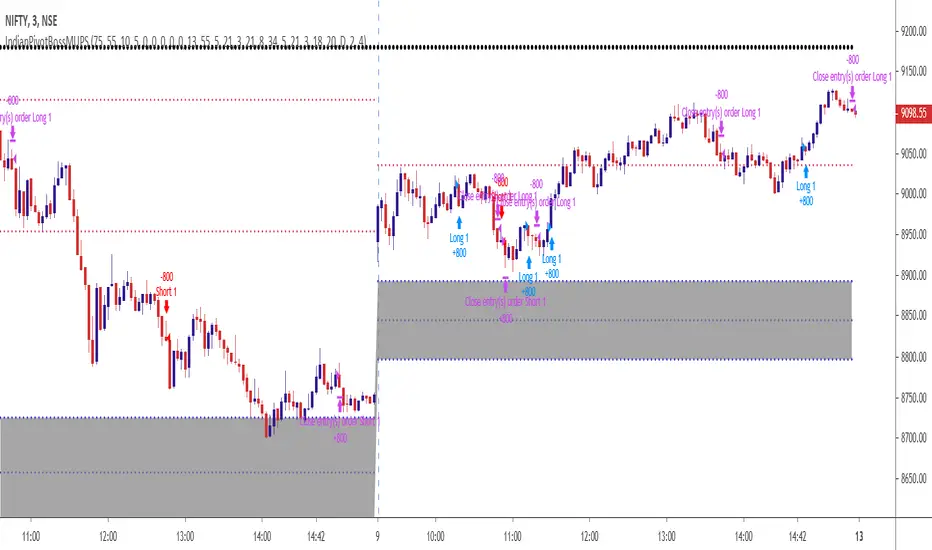
IndianPivotBossMUPSThis is a new avatar of the MUPS (ManojUltimatePivotScalpingStrategy).
This Indicator is to be used with the following Indicators :
1) IndianPivotBossPEMA
2) IndianPivotBossPIVOTRSI
3) IndianPivotBossDPWMACD
4) IndianPivotBossPIVOTSHIFT
BcondA = crossover(close,dtime_up) or low > dtime_up
BcondB = crossover(low,imap) or crossover(low,dpivotema) or crossover(low,imapw) or crossover(low,imapm)
//BcondC = crossover(low,ddtime_pivot)
BcondD = crossover(low,wtime_pivot)
BcondE = crossover(low,mtime_pivot)
BcondF = crossover(low,idtime_pivot)
BcondG = imacd > 0 or imacdw > 0 or imacdm > 0
BcondH = (rsipe > 50 and rsipe > rsippe) or (rsipew > 50 and rsipew > rsippew) or (rsipem > 50 and rsipem > rsippem)
BcondI = crossover(imacd,0) and close > maFast
//BcondI = ( dtime_pwd < ema(dtime_pwd,8) and crossover(low,dtime_r1))
EcondS = (imacd < 0 or crossunder(imacd,0) or close < maSlow) and rsipe < 50 and rsippe < 50 //crossunder(high,dtime_pivot) or crossunder(high,dpivotema) or crossunder(close,wtime_pivot) or crossunder(high,idtime_pivot) or crossunder(rsipe,rsippe) or crossunder(rsipe,50) or crossunder(high,dtime_r1)
Objective :
To enter into a trade when the direction, trend and momentum is confirmed.
Rules :
The following are the broad conditions for taking a long position. Reverse is for Short.
Direction - Defined by price crossing either daily cpr / weekly pivot / monthly pivot / intraday 125 min pivot
Trend - Defined by IndianPivotBossPIVOTSHIFT and IndiaPivotBossDPWMACD. The latter is a variant of the former. The former gives advance indication of a trend, while the latter confirms moments later.
Momentum - Defined by IndianPivotBossPIVOTRSI.
The strategy takes long when direction is established by the price crossing pivots and trend is established with pivot shift indicator sloping upwards which is further confirmed by DPWMACD, which is a variant of pivot shift indicator, crossing midline and sloping upwards and Momentum is established by Pivot RSI indicator when it crosses 50 and is above its own EMA.
Exits are usually at close. In case if the combination fizzles out, the strategy shows exit signal if any of the 3 ie, direction / trend / momentum fizzles out.
It is suggested to close down the positions at day end as sometimes the strategy continues the position overnight if deemed fit.
Other Rules when you take a long trade based on the signal.
1) Ensure the price is above PEMA and PEMA is upward sloping.
2) Ensure the Pivot shift indicator is upward sloping; Ensure the DPWMACD is also upward sloping.
3) Ensure the Daily Pivot RSI is above 50 and is above its own EMA.
This is not a holy grail. Hence have a proper position sizing which is your ultimate defense.
IMPORTANT : WHEN YOU USE THIS INDICATOR ALONG WITH 1,2,3,4 MENTIONED IN THE TOP PORTION OF THIS POST, PLS ENSURE THAT THE STRATEGY CHOSEN IS MUPS AS ALL THOSE MENTIONED ABOVE ARE ALSO STRATEGIES ON ITS OWN. MUPS COMBINES ALL THESE.
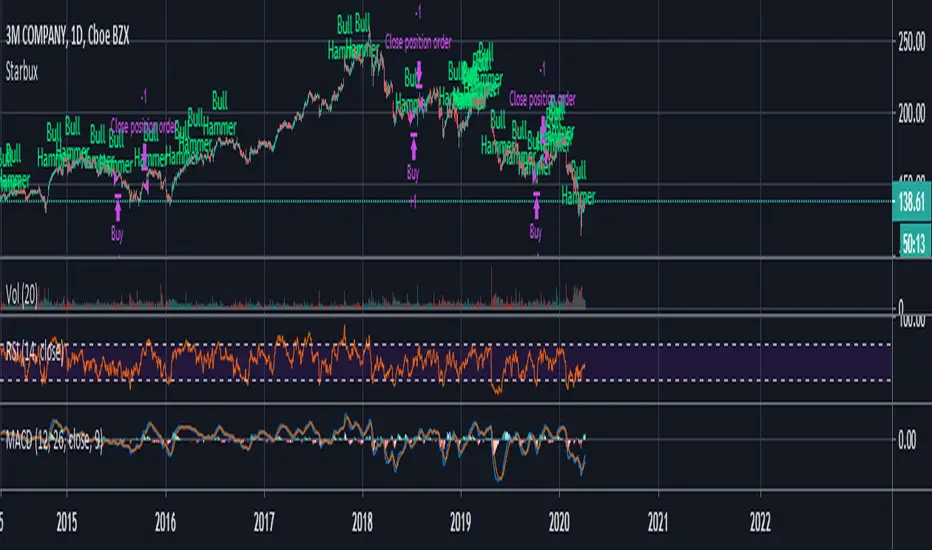
StarbuxI made this in starbucks .
Bullish hammer trading signal algorithm
using MACD for trend determination and holding period.
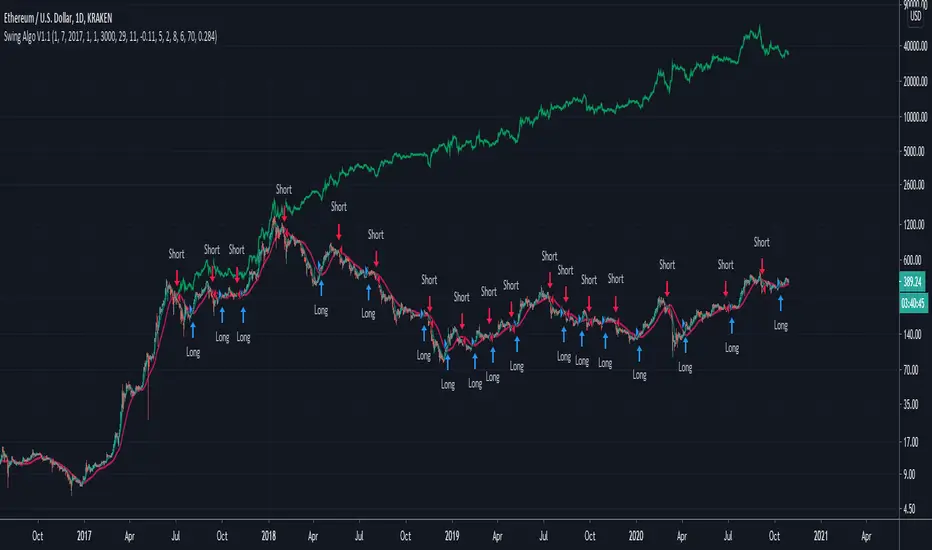
Swing Algo V1.1Here I present an upgrade to 'Swing Algo V1'. For differences to V1, see below.
This indicator can be used for e.g. swing algorithmic trading. It will give Buy/Long and Sell/Short signals on the chart. This algorithm uses a combination of several (custom) functions and rules to find good entry points for trend trading. After many iterations and tests I came up with this particular setup, which is highly optimized for the $ETH/$USD trading pair on the daily (D) timeframe. It is however possible to change algorithmic parameters within the indicator settings to tune this swing algorithm for other assets and timeframes. You don't need any programming skills or similar abilities to navigate this indicator.
Also you can choose the backtest time interval to test the perfomance of this algorithm for different time windows and different trading pairs. Here various backtesting parameters (e.g. trading fees) can be customized. Additionally to the TradingView Strategy Tester you can also plot your equity directly on the chart to get a sense for the performance. For this you can also scale the equity graph to e.g. match the starting point of your equity with some price point on the chart to get a direct comparison to 'Buy & Hold' strategies over time.
Note: In general it seems that cryptocurrencies are rather swing-algorithm-friendly, while I cannot recommend trading classical assets like stock or indices (e.g. S&P 500) with this indicator (although you can of course try to find good setups).
This indicator (and all other content I provide) is no financial advice. If you use this indicator you agree to my Terms and Conditions which can be found on my Twitter profile linked on my TradingView profile or in my signature.
Differences to Swing Algo V1:
- Changed the oscillator part of the algorithm with a better suited one (at least) for the ETH/USD trading pair.
- Improved net profits by roughly 20% in comparison to V1 for ETH/USD on daily timeframe
- Reduced Max. Drawdown by roughly 1/4 in comparison to V1 for ETH/USD on daily timeframe
- However for other assets and timeframes V1 might perform better than V1.1. I leave you with both options to play so that you can find the best solution for a given trading pair.
For access please contact me via DM on TradingView or on Twitter (linked on my TradingView profile and my signature). People who purchased access to any 'Swing Algo 1.x' get access to all other 'Swing Algo V1.x' indicators automatically ('Swing Algo V1' counts as 'Swing Algo V1.0').
Moving Average profit targets with var sizeProfit target:
Profit targets are those scenarios where the system expects to be greater than the actual return at the end of the transaction: they may be short-term benefits, such as a favorable price shock model.
In short-term transactions, profit objectives are essential. Price fluctuations make any favorable event likely to turn around in an instant. Moreover, profit objectives are more difficult to integrate into the longer-term trading system, because they are afraid of losing larger profits at risk, so they will replace them with smaller but more frequent gains. As a follower of the trend, once you make a profit and stop earning, but the trend direction is still intact, you need to find a way to re-enter the transaction to avoid losing the rare but very large market situation.
Profit target is best calculated based on price volatility (V), and the most commonly used method:
For Long, the system buy point (E), needs to be multiplied by the average true volatility or annualized volatility :E+f×V.
The net value multiplier f used to calculate the profit level is usually obtained through data mining.
