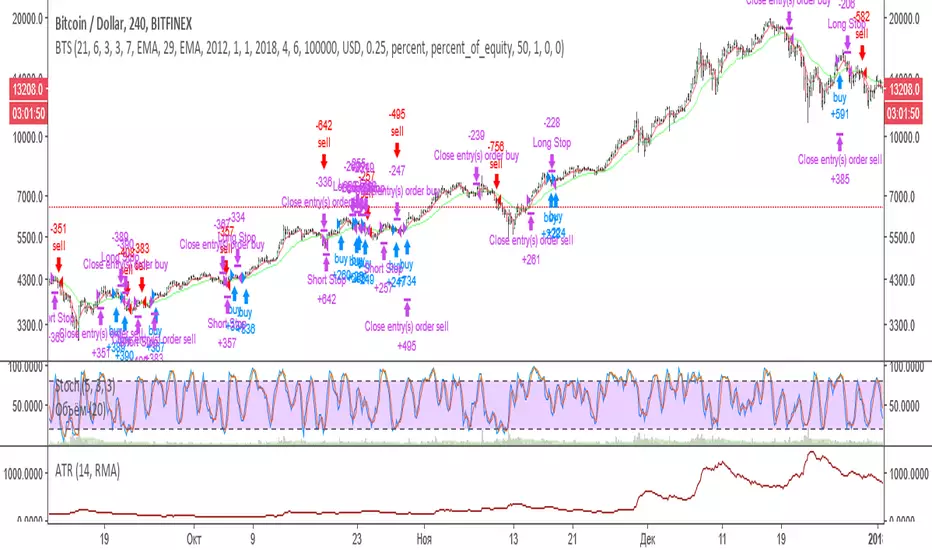
Base Trading StrategyEnglish description:
Following script is the realisation of strategy that discribed in one of educational video on YouTube .
First of all strategy choose trend direction using moving averages and then searching for entry using stochastic and waiting for a price rollback.
Conditions for long entry:
1. Fast MA is under slow MA.
2. Stochastic is increasing.
3. Price fluctuation touch fast MA or is lower then fast MA.
For short entry it uses conditions in reversive way.
Exit conditions:
1.Stop is equal 1 ATR.
2. Fast and slow MAs crossed in the opposite direction.
We set comission in script equal to 0.25% and amount of bet is equal to 50% of deposit by default.
Authors of video recomends to use next settings: 12 EMA, 34 EMA and Stochastic 5,3,3. But judging by backtesting for different pairs absolutely different parameters can match better then this. It's possible to find profitable parameters for stock, forex and crypto markets as well. Anyway this strategy is weak on flat movement and quite well on trend movement.
Описание на русском:
Данный скрипт является реализацией стратегии описанной в этом видео .
Стратегия исопльзует определения тренда по скользящим средним, а затем определяет точки входа, используя стохастик и откат цены.
Условия входа в лонг:
1.Быстра МА должна быть выше медленной МА.
2. Стохастик должен возрастать.
3. Цена должна коснуться или уйти ниже быстрой МА.
Для входа в шорт условия должны быть выполняться в обратную сторону.
Условия выхода:
1. Стоп составляет 1 ATR.
2. Быстрая и медленная скользящие должны персечся в обратном направлении.
Отличие от стратегии видео только в том, что отсутствует тейк-профит. Выход из сделки происходит только по стопу, либо по обратному пересечению скользящих средних. В скрипт по умолчанию вставлена комиссия 0.25% и по умолчанию торг идёт на 50% капитала.
Авторы видео предлагают использовать: 12 EMA , 34 EMA и Stochastic 5,3,3. Но судя по бэктесту по очевидным причинам для разных инструментов подходят абсолютно различные параметры.
Возможно подобрать профитные варианты как для фондового рынка, валютного рынка, так и рынка криптовалют. В любом случае стратегия очень слабо себя ведёт на флете и достаточно не плохо на движении.
В своём канале на YouTube мы выложили разбор данной стратегии на бэктестинге.
Stochastic Oscillator


Peso Pros Nueve a DiezThere are many ways we can trade the Peso and some trades have a much higher probability than others, such as the morning NY session trade that we teach as part of the Peso Pros course (el desayuno trade). This indicator relates to a trading strategy that is intraday using the stochastic oscillator indicator, trend detection, fibs and of course... some of grandma's special sauce.
This indicator is actually using the timeframe 9am - 11am EST so it should be called "de nueve a once", however we may tweak the session time sometime in the future with further testing. The rules still apply similar to what you have/will be taught in the Peso Pros course regarding the Nueve a Diez trade. This indicator aims to make your life easier and in fact you can even leave your chart running and setup alerts so you don't have to sit there all day watching the chart... well not all day but between 9 and 11 am EST.
Happy trading Peso Pros!


BTCUSD long vs short ratio+rsiJust a script I want to share with friends on a discord
orange/green line : longs vs short ratio (100 = only longs, 0 = only shorts)
purple line : RSI of (longs-shorts)

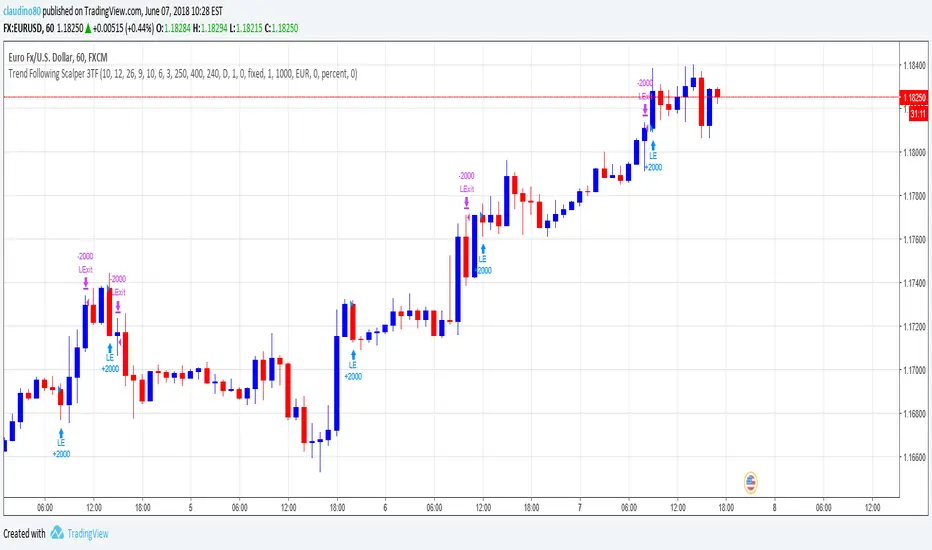
Trend Following Scalper 3 Time FramseDo you think it is a good idea to use the Stochastic / MACD / EMA and cross check THREE timeframes to detect a new trend?
If you think that it would be a good idea, this is the script that you are looking for.
The Trend Following Scalper (3 Time Frames) script has been developed to automate the trading activity by detecting a new trend and by scalping a fixed amount of pips each trade. That is why it is called Trend Following Scalper.
How does the script detect the new trend?
The beginning of the new trend is detected on the lower timeframe (1H is the suggested one) by joining the information of the Stochastic, MACD and Exponential Moving Average.
Once a potential trade has been detected on lower timeframe, the script confirms it by looking the upper timeframe (e.g. Daily + H4) by gathering the same indicator / parameter information.
If the threes timeframes are moving in the same direction, the script open a new trade.
Why do we need to merge lower and higher timeframe before open the trade?
The lower timeframe shows a shorter Price Action context. The short price action context has a short life! By looking at the higher time frames context the script tries to exclude the short life counter-trend moves. At the end, a new trade is open only if the higher timeframe context supports the lower timeframe indication.
What about the Risk-Reward (following RR) ratio?
The RR is set by default as 1.6 (stop loss 25 pips and take profit 40 pips).
This configuration has been heavily tested on multiple crosses and it has shown a good Equity Line with a low Drawdown.
(Note: the stop loss and take profit can be changed by the user via the parameter pages. Suggest RR > 1.5)
What about the accuracy of the Script?
The average script accuracy is > 55% on the H1 time frame (tested with various crosses).
With this accuracy, and by risking 0.6% of the capital each trade, your capital will grow > 25% every 100 trades.
What about the drawdown?
It depends on the capital and the size of the position used on each trade.
For example, with an initial capital of 1000 Euros and by risking 0.6% of the capital each trade, the drawdown is close to 3%.
(The strategy tester result has been calculated starting from January 2017. The strategy produced 527E (i.e. 52% gain) starting from a 1000E capital and risking 0.5% each trade)
Do you want to try the script? Please write me!
Do you have some question? Please write me!
Trend Following Scalper 2 Time FramesDo you think it is a good idea to use the Stochastic / MACD / EMA and cross check TWO timeframes to detect a new trend?
If you think that it would be a good idea, this is the script that you are looking for.
The Trend Following Scalper (2 Time Frames) script has been developed to automate the trading activity by detecting a new trend and by scalping a fixed amount of pips each trade. That is why it is called Trend Following Scalper.
How does the script detect the new trend?
The beginning of the new trend is detected on the lower timeframe (4H is the suggested one) by joining the information of the Stochastic, MACD and Exponential Moving Average.
Once a potential trade has been detected on lower timeframe, the script confirms it by looking the upper timeframe (e.g. Daily) by gathering the same indicator / parameter information.
If both timeframes are moving in the same direction, the script open a new trade.
Why do we need to merge lower and higher timeframe before open the trade?
The lower timeframe shows a shorter Price Action context. The short price action context has a short life! By looking at the higher time frame context the script tries to exclude the short life counter-trend moves. At the end, a new trade is open only if the higher timeframe context supports the lower timeframe indication.
What about the Risk-Reward (following RR) ratio?
The RR is set by default as 1.6 (stop loss 25 pips and take profit 40 pips).
This configuration has been heavily tested on multiple crosses and it has shown a good Equity Line with a low Drawdown.
(Note: the stop loss and take profit can be changed by the user via the parameter pages. Suggest RR > 1.5)
What about the accuracy of the Script?
The average script accuracy is > 45% (tested with various crosses).
With this accuracy, and by risking 0.6% of the capital each trade, your capital will grow > 10% every 100 trades.
What about the drawdown?
It depends on the capital and the size of the position used on each trade.
For example, with an initial capital of 1000 Euros and by risking 0.5% of the capital each trade, the drawdown is close to 6%.
Do you want to try the script? Please write me!
Do you have some question? Please write me!

RSI/Stochastic
RSI with values 60-40 Displays a check when it crosses below 40 and an X when it is above 60 (Team DM System) Stochastic displays purchase / sale zones.

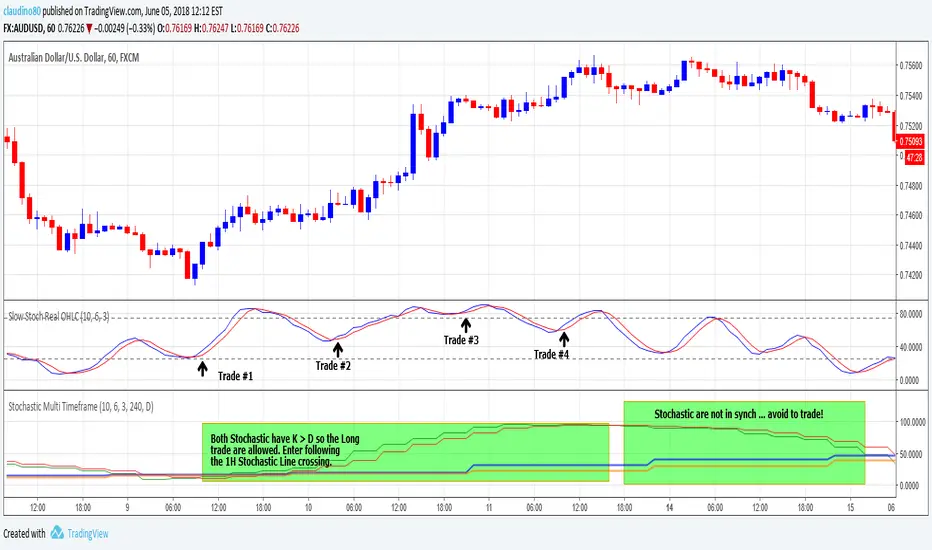
Stochastic Multi TimeframeThis indicator inserts in the same frame the data coming from the Stochastic Slow of Two different timeframes .
By using the “Time Frame 1” and “Time Frame 2” configuration parameters it is possible to specify the two timeframes.
This indicator is very useful to avoid a false signal generated by a single Stochastic indicator that doesn’t consider the information coming from other timeframes.
For example, by configuring the indicator to pick up the Stochastic information from that Daily and the H4 timeframes and by setting the current chart on the 1H timeframe it is possible to improve the entry accuracy.
An example that I am using an it is working well, is to follow the line crossing of the Stochastic configured on the 1H chart only if the Stochastic Multi Timeframe indicator is in synch:
Long trade will be evaluated only if the Daily and 4H Stochastics have the K > D at the same time
Short trade will be evaluated only if the Daily and 4H Stochastics have the K < D at the same time
Please contact me to have the full access to this indicator.
STOCH MTF with Moving AverageBasic STOCH indicator with MTF support with moving average
USE EMA Cross with Stoch for buy / sell signal

Simple profitable trading strategyThis strategy has three components.
Philakones EMAs are a sequence of five fibonacci EMAs. They range from 55 candles (green) to 8 candles (red) in length. A strong trend or breakout is marked by the emas appearing in sequence of their length from 8 to 55 or vice versa. These EMAs are also used to signal an exit. Only two EMAs are used for exit signals - when the 13 EMA crosses over/under the 55 EMA.
RSI gives a bullish signal when 40 > rsi > 70. Exit signals are oversold (30) or overbought (70)
Stochastics give a bullish signal when stoch < 80 and an exit signal when > 95.
Results include 3 ticks of slippage and taker fees of .002. Provides a pretty smooth equity curve with a 73% win rate and beats buy and hold by than 10x (returns about 60x overall) since start of 2017.

Stochastique Divergences IndicatorHello,
I made a custom indicator.
Divergences with stochastique and price are really strong signals.
About the indicator
A bullish divergence happens when the stoch K makes a higher low and is depicted by a green triangle up.
A bearish divergence happens when the stoch K makes a lower high and is depicted by a red triangle down.
This script is the base for my next strategy that I should upload soon.
I will grant access (to this script and my others) to people willing to make a small donation.
Here is my BTC address : 19sVQvCDmVfEACq7BiMnWSMqFPZ8qfSQ2K
If you prefer ETH : 0xc8a5d3a63a05db0c2363ea1c08b37a01cce9ebfb
Send me a Private Message with the ID of the transaction
If you want to do some forward testing first, send me a message.
Also check blockchainfiesta.com

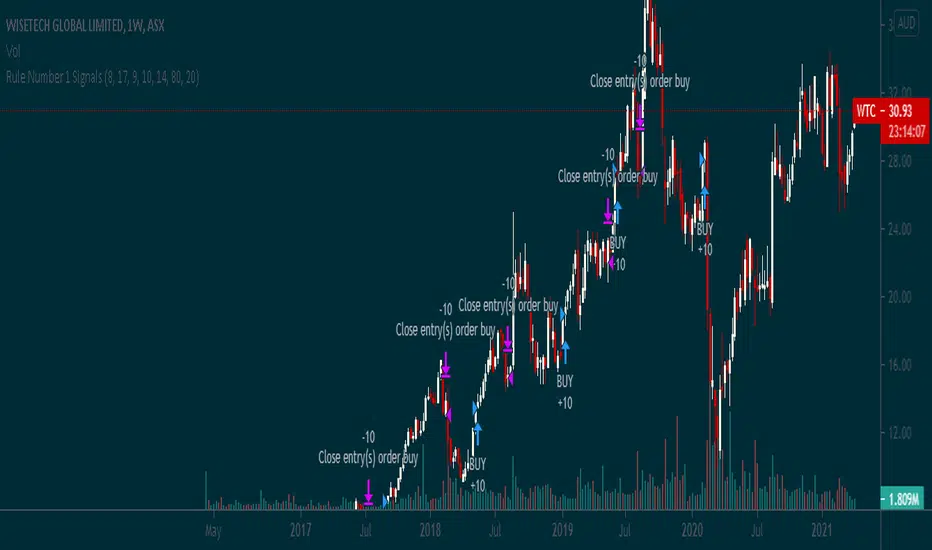
Rule Number 1 SignalsThis script takes the Rule #1 3 tools and plots them on the graph, to provide an additional level of indication for when to sell and when to buy.
Ehlers Stochastic Cyber CycleEhlers Stochastic Cyber Cycle indicator script.
This indicator was originally developed by John F. Ehlers (see his book `Cybernetic Analysis for Stocks and Futures`, Chapter 8: `Stochasticization and Fisherization of Indicators`).

Salty GRaB Wave with Highlights for Squeeze CCI-Arrows SlowStochThis indicator shows GRaB candles and allows several moving averages to be displayed at the same time.
It uses background coloring to identify momentum shifts. Wide bands of color can be used to identify trends while short bands of color can be used to identify reversals.
It has arrows above or below the candles to show CCI values above 100 or below -100 with the arrow pointing in the direction of the momentum.
It has red background coloring to show slow stochastic Overbought ranges and dark red signals indicating a cross of the fast and slow lines.
It has green background coloring to show slow stochastic Oversold ranges and dark green signals indicating a cross of the fast and slow lines.
It has yellow background to show squeezes with additional Squeeze information shown at the bottom of the chart in the form of letters and momentum arrows.

3_Stoch3 Stochastic!
5 - 3 - 3
12 - 6 - 6
20 - 12 - 12
overbought > 80% , red zone
oversell < 20% , green zone
thx, rubend18!!

Stochastic Scalping1 Stochastic RSI (3,3,14,14)
1 Stochastic RSI (3,3,6,6)
1 Stochastic (14,3,3)
1 Bollinger Band (20,2)

Double Stochastic Multi-TimeframeI personalized a double stochastic oscillator.
HOW IS IT USED ?
Everyone should adapt the parameters to its way of trading.
First you must have a confirmation of the trend.
In positive trend, a double stochastic > 20 can be used t enter long.
In negative trend, a double stochastic < 80 can be used t enter long.
Of course this is only one possibility that everyone should adapt.
I added the possibility to add on the chart a 2nd timeframe for confirmation.
If you found this script useful, a tip is always welcome... :)


2xStochastic + RSI (two levels, colored)Great tool to find market tops, bottoms, S/R's and reversals.
Rsi has 2 customiseble overbought and oversold levels can show you extreme levels.
Slow Stochastic 1 (25 period) shows small price swings
Slow stochastic 2 (100 period) can show you a greater picture, are we reversing?
Why do you need Leguerre, Murrey, Kaufman oscilator 3000 when you can have old and trusted tool, that has been tweeked very nicely for any timeframe.
I use it in a variety of ways, let me show you some examples:
EXAMPLE 1 (RSI Extreme Level):
1) Find extreme oversold or overbought level that clearly reversed and plop S/R line there. BAM! We have a S/R line
2) Next time you know this line will mean something (Either it will hold, or it will be broken by a big candle) and you can trade it accordingly to Stochastic trading strategy
EXAMPLE 2 (Fibonacci Level finder):
Trading fibo? This can help!
1) Just like fibo trading, find good swing top and bottom
2) You know that price will reverse from 38.2, 50, 61.8, but where? I think this is self explanotory...

