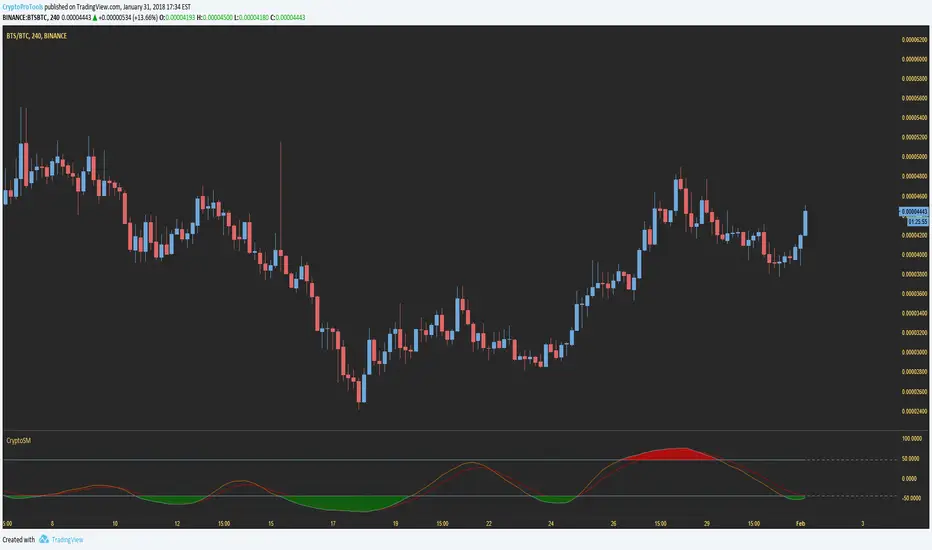
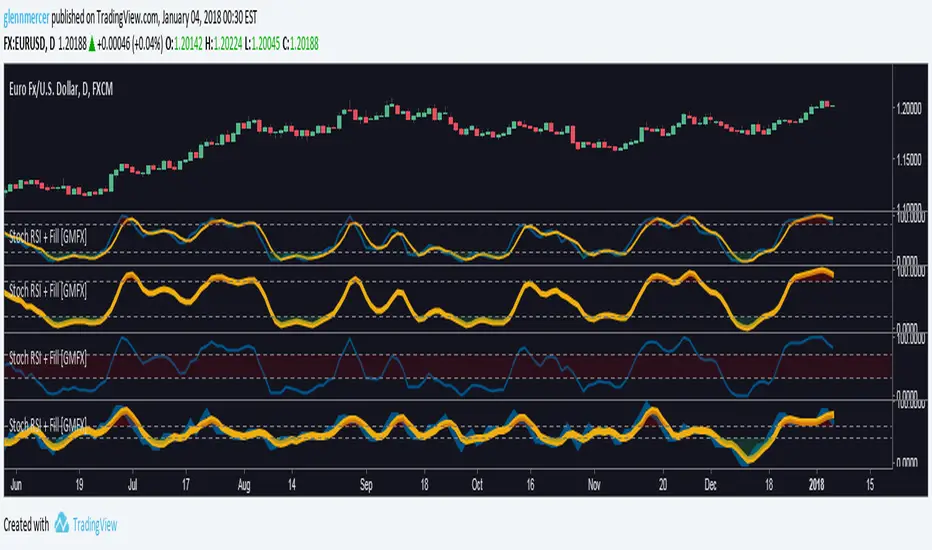
On the chart there are the BB with purple and green circles to give the entry signal once the price has come back in the bands.The background alert appair when BOTH RSI and STOCH are in overbuy or oversell. the defalt is 20/80 but can set it by yourself.
5 indicators in 1. You can choose wich one you want to see (rsi ,aroon,macd,stoch or adx di) Usefull to save space for other indicators
Get the difference between Stochastic RSI k and d. When k > d, the value is positive, and vice versa. Sudden change/reversal of the difference can indicate price reversal.
This indicator measures the difference between the K and the D of the Stochastic indicator. Thia tool could be helpful to identify the time that will take K and D to crossover. Knowing their crossover, changes in price could be determined.
Willams %R with 13 EMA and middle point. It also uses the textbook formula instead of the Tradingview one.
An automated strategy utilizing Autoview and Bitmex on the 5m. Use at your own risk. I take no responsibility lost currency using this. Link to strategy:
i dont know pine script but here i used some free ones and merged them and modified some especially smoothed stoch rsi is Good to decide when buy coz i modified it and when fast K value is over D value it changes color visually better this way also rsi is shown as area o histogram but if u dont like u can change to line for stoch rsi i unclick xtrigger (d value)...
English description: Following script is the realisation of strategy that discribed in one of educational video on YouTube . First of all strategy choose trend direction using moving averages and then searching for entry using stochastic and waiting for a price rollback. Conditions for long entry: 1. Fast MA is under slow MA. 2. Stochastic is increasing. 3....
modify the study name and open soure code
There are many ways we can trade the Peso and some trades have a much higher probability than others, such as the morning NY session trade that we teach as part of the Peso Pros course (el desayuno trade). This indicator relates to a trading strategy that is intraday using the stochastic oscillator indicator, trend detection, fibs and of course... some of...
NOTE #1: Must be used on a 15 minute chart!!!! NOTE #2: In development. Multiple timeline script which has 4 swim lanes, one for a different timeline... ------------------------ 4 HR ------------------------ 1 HR ------------------------ 30 MIN ------------------------ 15 MIN ------------------------ For each timeline script displays divergences + macd X +...
This one combines divergences + macd X + pumps/dumps + supertrend + ATH/ATL + MA X Label meanings.... General - Red is a negative/sell signal - Green is a positive/buy signal Divergences - adds up multiple divergent signals on one candle - Divergences include RSI + MACD + Stochastics + OBV - Due to too many OBV Divergence false signals it only displays OBV...
Just a script I want to share with friends on a discord orange/green line : longs vs short ratio (100 = only longs, 0 = only shorts) purple line : RSI of (longs-shorts)
Do you think it is a good idea to use the Stochastic / MACD / EMA and cross check THREE timeframes to detect a new trend? If you think that it would be a good idea, this is the script that you are looking for. The Trend Following Scalper (3 Time Frames) script has been developed to automate the trading activity by detecting a new trend and by scalping a fixed...