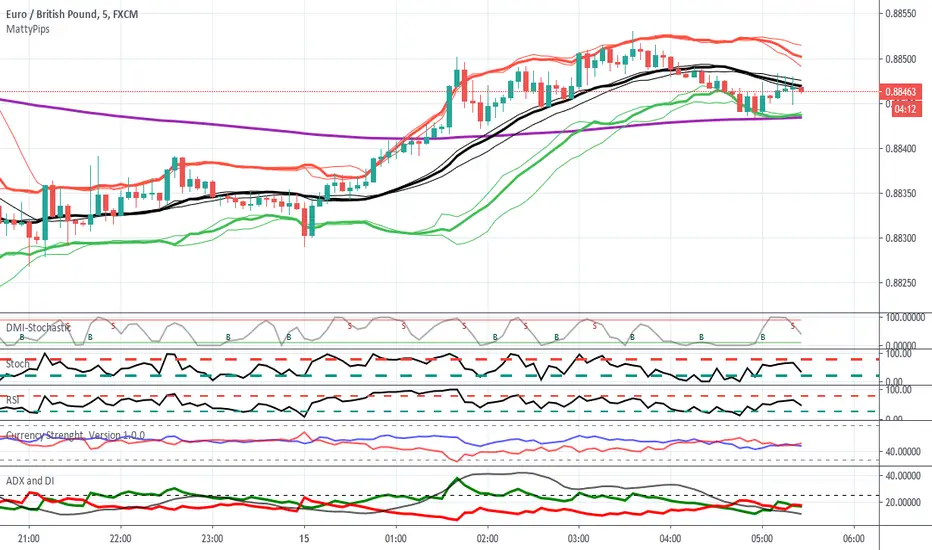
MattyPips Strategy with Alerts For education purpose.
Applied only for Matty Pips Strategy.
Arrow will appear when
DMI + Stoch + RSI are in the same OB/OS.
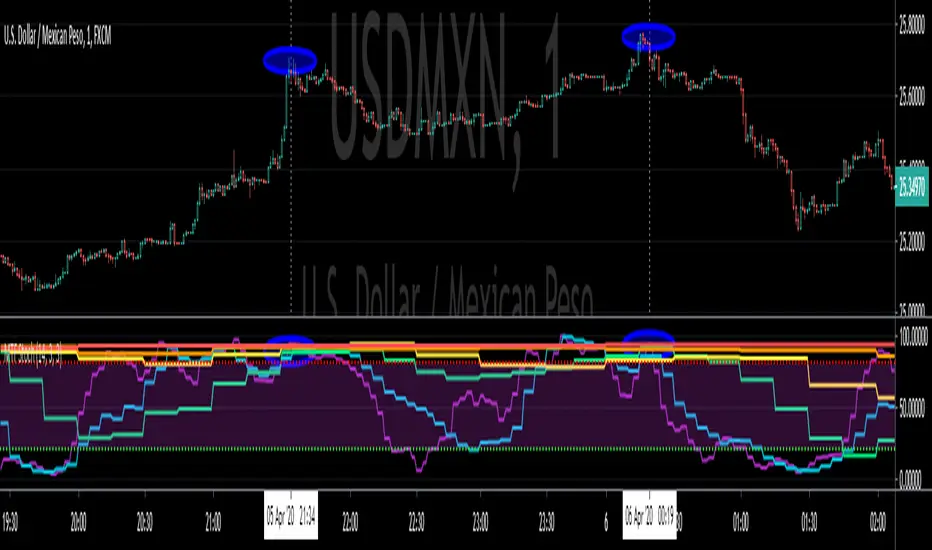
Stochastic Oscillator
Multi Time Frame StochasticThis Indicator draws 6 Stochastic Plots with different Time Frames showing only K Value.
Available Time Frames: 3m, 5m, 15m, 30m, 60m, 240m
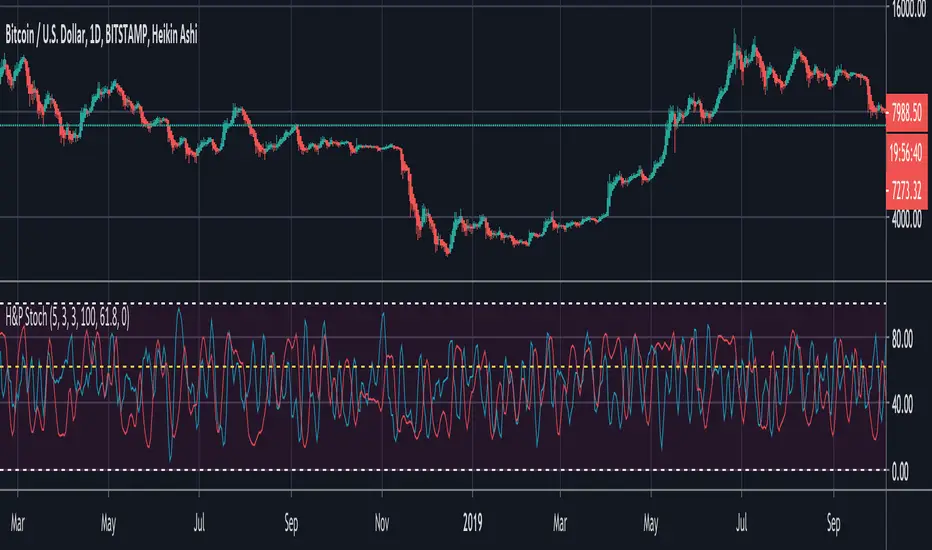
BTC Hash Rate & Price Stochastic IndiciatorFresh off the press, we have a new breed of indicators: Bitcoin's Hash Rate & Price.
As many of you have read, roughly 80% of BTC's price movements can be correlated to its changes in hash rate volume. I decided to make a stochastic indicator that utilizes this principle to track divergence of the price from the hash rate.
Let's break this down...
In red is the CLOSE of BTC's Price, which is then smoothed by a SMA, and smoothed again by a WMA.
In aqua is a STOCH of BTC's Hash Rate, which is then smoothed by a SMA, and smoothed again by a WMA.
The reason why I chose to use the CLOSE of the Price versus a STOCH as I did with the Hash Rate, is because the price tends to signal trends via divergence from the Hash Rate, and eventually converge with the Hash Rate at some point.
You will notice that anytime there is a significant divergence of the RED from the AQUA, a trend is closely aligned with it. This indicator does a remarkable job of indicating the beginnings and ends of both bullish and bearish price movements.
Example Strategy:
Enter long when RED (price) crosses over AQUA (hash rate), and close long when RED crosses under AQUA.
The inverse can be done for shorts, just RED diverges downwards from AQUA versus upwards.
Note:
Unlike a normal Stochastic Indicator, the upper and lower bounds do not appear to hold any significance. In other words, the lines do not seem to reverse at 20/80. As a result, I just set them to 0/100 for aesthetics.
DO NOT make trades based off of small divergences, or simply enter into positions based off the price divergences. Though this indicator times the start/end of movements very accurately, it also comes riddled with false breakouts .
Proceed at your own pace, and please, toy around with the inputs values. I experimented with a few combinations, but I'm sure there are better value combinations that yield sharper results with fewer false signals.
EASTER EGG:
Notice the "Golden Line"? Any avid user of TV knows that Fibonacci ratios show up everywhere in markets. With that said, I plotted a horizontal line at 0.618, which is 1/Phi, an important level in Fibonacci retracements.
Final Comments:
First, this is not investment, merely my experimentation and observation of happenings in the analytical world.
Second, please comment questions, improvements, etc. Dialogue opens up room for exploration!
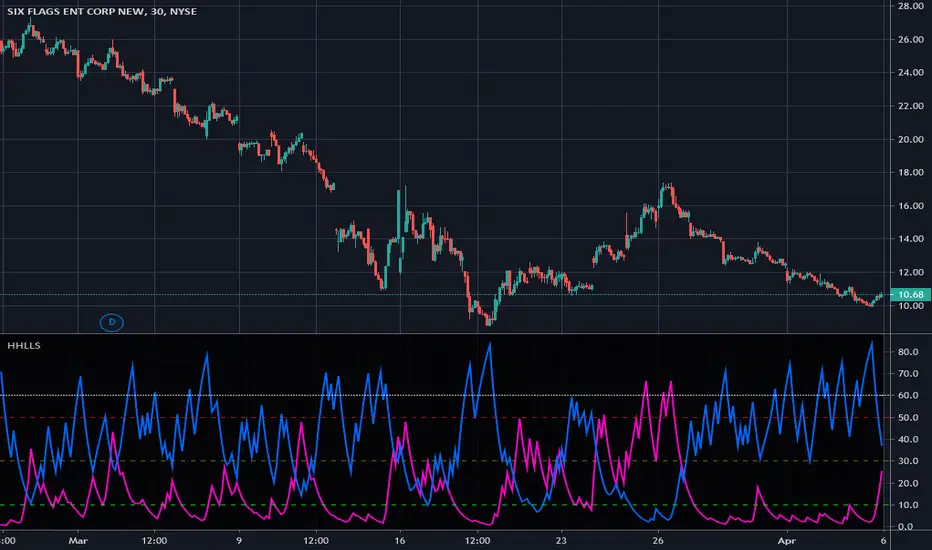
Higher Highs & Lower Lows Stochastics - Vitali ApirineThis is my modified "Higher Highs & Lower Lows Stochastics" employing PSv4.0, originally formulated by Vitali Apirine for TASC - February 2016 Traders Tips. Reading through a TASC magazine of mine, behold, I found a little known indicator that I can't find anywhere on all of Tradingview. That was a tragedy I felt I had to resolve... This indicator is best described as a dual momentum indicator, being helpful with anticipating reversals, spotting emerging trends, and defining correction periods. I felt it worthy of justice to unveil this for all TV members to utilize and also learn from. It's uniqueness is beyond past due for the honor it deserves on Tradingview.
As always, I have included advanced Pine programming techniques that conform to proper "Pine Etiquette". For those of you who are newcomers to Pine Script, this code release may also help you comprehend the "Power of Pine" by employing advanced programming techniques while exhibiting code utilization in a most effective manner. This script's uniqueness displays that we can now override built-in Pine functions. Firstly, you may have noticed that I replaced ema(), sma(), highest(), and lowest(). If you weren't aware of this Pine capability, well, here is a prime example... Now you know! Just heed caution when doing so to ensure your replacement algorithms are 100% sound. Lastly, I also added an additional "Median" line where the companion stochastics seemingly appear to gravitate within a central zone.
NOTICE: You may have observed, there is highest(), lowest(), ema(), and sma() custom functions overwriting Pine built-ins, some of which are audaciously used in ternary. "IF" you are planning to use Pine Script v4.0 functions in ternary, be forewarned, they WILL NOT operate as expected in most scenarios. The reason why I legitimately used them here in ternary is because they are ONLY manually controlled by an input(). If these were dynamically controlled with bar-to-bar dynamic conditional logic, you would most certainly run into serious unexpected programming issues, potentially resulting in hours of frustrations and guaranteed loss of hair. That's my lesson for this release, so never ever forget this when utilizing the full potential of the "Power of Pine". For more information concerning these potential dilemmas, please consult "Execution of Pine functions and historical context inside function blocks" in the "Pine Script v4 User Manual".
Features List Includes:
Dark Background - Easily disabled in indicator Settings->Style for "Light" charts or with Pine commenting
AND much, much more... You have the source!
The comments section below is solely just for commenting and other remarks, ideas, compliments, etc... regarding only this indicator, not others. When available time provides itself, I will consider your inquiries, thoughts, and concepts presented below in the comments section, should you have any questions or comments regarding this indicator. When my indicators achieve more prevalent use by TV members, I may implement more ideas when they present themselves as worthy additions. As always, "Like" it if you simply just like it with a proper thumbs up, and also return to my scripts list occasionally for additional postings. Have a profitable future everyone!
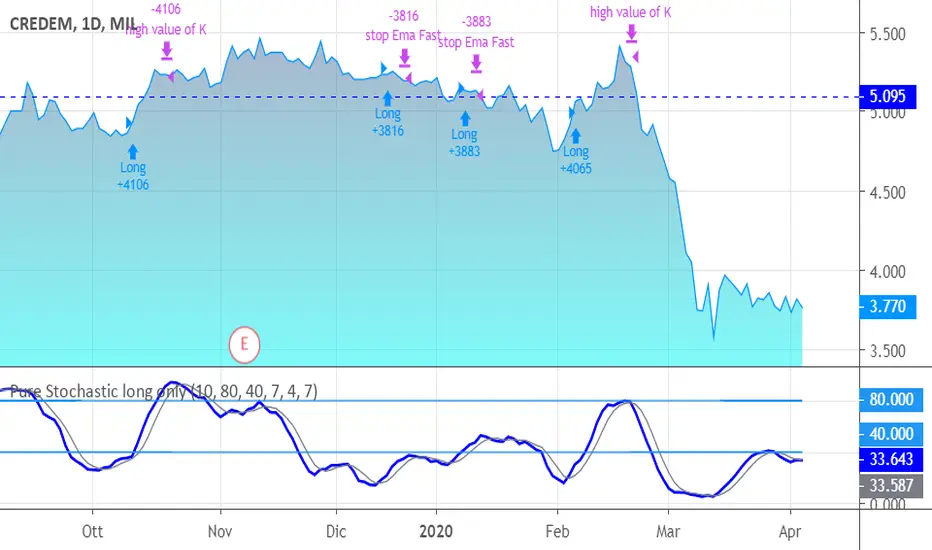
Pure Stochastic long onlyJust a stochastic for giving you a smart and quick signals of entering and exiting.
Your enter is K>D in the low band and close > last bar's high.
An Ema has been added for targeting and stops.
You exit also in case of high values of K or in case D crosses over K but in the "upper".
Length, periods and level of bands are personalized.
The system goes long only, because it fits at best for shares only; I leave you the attemp of writing code for other classes and for going short, in particular.
SUGGESTIONS:
Keep Oversold period high (> 20, also 40-45)
Keep Emaperiodfast higher (> 5)
Stochastic FibonacciThis is your run-of-the-mill stochastic indicator, with one slight difference. I added Fibonacci ratios and colored them across the rainbow for aesthetics.
I noticed that the stochastic moving averages, K & D, would reverse in between 0 & 100. Just like price, they were likely Fibonacci ratios.
My original plan was to create a strategy script, and trade whenever K & D crosses the Fib levels. However, they do not cross them perfectly, rather they merely float near them and reverse. Therefore, the strategy would have never made the trades.
As you will notice in the script, there is Bitcoin Hash Rate data imported. I did so because I would like to create a stochastic hash rate indicator at some point. For those of you with this same passion, there is the hash data to mess around with; consider it an Easter Egg...

Kojirokousi Daijyunkan Stochastics for Ichimoku-Kinko-HyoKojirokousi Daijyunkan Stochastics
Original indicator by Kojirokousi
Evolution of stochastics
Indicator to use with the Ichimoku-kinko-hyo
Checking each lines of the Ichimoku-kinko-hyo with an oscillator.
小次郎講師 大循環ストキャスティクス for 一目均衡表(大スト for ichi)
小次郎講師によるオリジナルのインジケーター
ストキャスティクスを発展させたもの
一目均衡表と一緒に使うためのインジケーター
一目均衡表の各線をオシレーターで確認する

B3 Stochastic Full w/BarColorNow with Bar Color!
The simplest upgrade to the classic indicator, old script:
B3 Stochastic Full
Also, if you like this one you may appreciate my personally modified take on the stochastic readings:
B3 Extended Stochastics

Stochastic %BIt's a Stochastic indicator combined with Bollinger %B. This way you just need to check if it is above 1.0 or below 0.0 (Outside Bollinger Bands).

Stoch tripleThe script has combined the three Stochastic oscillators into one.
It analysed divergences of indicators depending on the flow of stock price, a circle mark or text mark displayed.
The maroon and red marks mean a fall, while the green and lime marks mean a rise.
Especially red and lime of mark are strong signs of decline or rise.
I hope you can make a successful investment by using three Stochastic oscillators properly.

K/D DifferenceThis script provides a histogram for easier analysis of K D difference of a Stochastic oscillator.

StochRSI by Trader PrasadThe Stochastic RSI ( Stoch RSI ) indicator was developed by Tushard Chande and Stanley Kroll. They introduced their indicator in their 1994 book The New Technical Trader.
Original formula is
Stoch RSI = ( RSI - Lowest Low RSI ) / (Highest High RSI - Lowest Low RSI )
I have changed some settings as per my back testing.

RSI & StochasticA combination of RSI and Stochastic using default settings.
- RSI or Relative Strength Index is the white line.
- Stochastic %K is the aqua line
- Stochastic %D is the orange line
- The purple rectangle is the RSI range going from 30 (oversold) at the bottom to 70 (overbought)
- The top dotted line indicates the price being overbought on the stochastic
- The bottom dotted line indicates the price oversold on the stochastic
I mainly use both indicators to spot divergence/ potential upcoming turning points (tops or bottoms).
For example on the chart the white line shows the price of Bitcoin Rising
While the yellow line shows the stochastic declining and the red RSI stayed more or less at the same level.
Another way to use this indicator is to use the aqua line crossing above the orange line as an entry for a long trade this strategy is most useful when both are near the bottom of the range. The opposite is true for short trades but
both should be combined with other indicators such as moving averages support levels or volume for best results.
Generally RSI is more useful in trending markets & the stochastic is more useful in sideways or choppy markets.

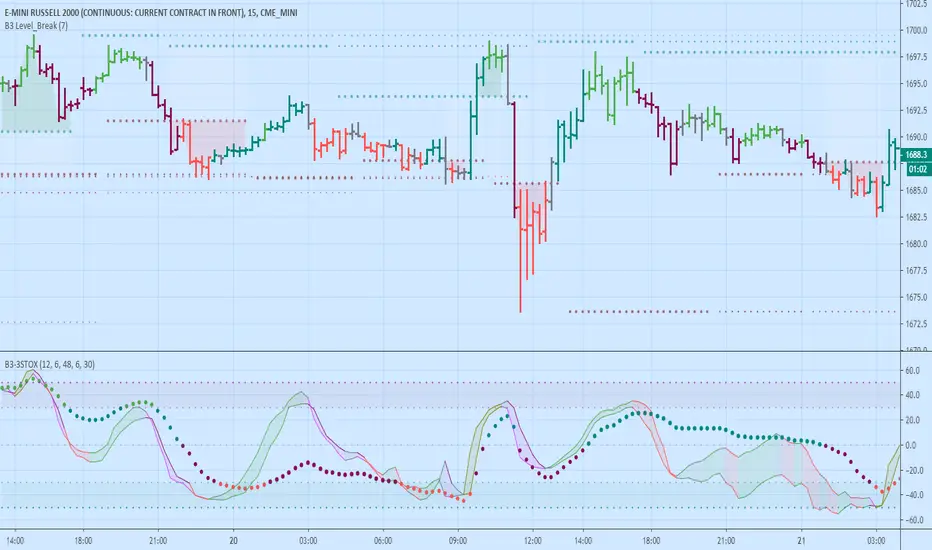
B3 3-Stox - Scalping OscillatorThis is an indicator that combines what I see some scalpers use on youtube videos and webinars.
3 Stox = Three Stochastic Readings
Fast Stochastic of Highs
Fast Stochastic of Lows
Slow Stochastic of Bar Average
Bar Color Code
Bar Color Coded
Light Green = Long with trend
Dark Green = Long counter trend
Light Red = Short with trend
Dark Red = Short counter trend
Fast Line Color Code
Green = Lows leading highs up (Organized Rise)
Olive = Highs leading lows up (Rapid Rise)
Red = Highs leading lows down (Organized Fall)
Fuchsia = Lows leading lows down (Rapid Fall)
Trades to be looked at:
Trading in the direction of the fast lines, when they are similar to and near one another, in the same direction as the Slow stochastic line's color or slope
Trading Long Fastline green color when all 3 lines are oversold
Trading Short Fastline red color when all 3 lines are overbought
AVOID Trading when fast lines are spread out and a large cloud appears between them (Chop Filter)
Look for solid up & down & up & etc. oscillation or you can use the slow line to find trends to trade
Green and red fast lines are organized moves, the olive and purple lines are faster moves and harder to lock in sometimes
Things to note:
Pairs nicely with a level printing study like B3 Level Break (applied on above chart)
There are 2 color schemes for the Fast High and Low Stochastic lines, and 2 color schemes for the bars
In this script the bar average is defined as (open+high+low+close+close ) / 5, keep the slow line at a large length input so that you can get a macro trend reading without zooming out the chart
The Extended Stochastics from one of my previous scripts is defaulted as the style used, however, you may turn that feature off and use the classic Stochastics
More details: drive.google.com
Enjoy!
~ B3 d^.^b
AKMY Multiple StochasticsRefer Sample Chart for description - updated to version 4 and additional script suited with Author's trading setting which original script was inspired from script developed by Manu76

Stochastic MACDStochastic MACD (SMACD) is an oscillating momentum indicator, that combine the Stochastic oscillator and MACD (Moving Average Convergence/Divergence).
SMACD is based on the difference of two exponential moving averages (EMA) and their relative positions compared to the highest and lowest prices of a certain period (standard 45).
A possible high/low is around 15, so those values have been marked with a dotted line.
SMACD have proven to better show positive/negative divergences compared to the traditional MACD indicator. The indicator itself is very close to the MACD, but differ in the way you can compare the historical values.

Stochastic Pop and Drop by Jake Bernstein v1 [Bitduke]I found a simple strategy by Jake Bernstein, modified it a little and created a strategy with Risk Management System (SL+TP); After that I test it on the different cryptocurrency pairs.
About the Indicator
Basically it's the strategy of 2 indicators: Stochastic Oscillator to define the bias and Average Directional Index to confirm it.
One again, It uses Stochastic Oscillator to define the trading bias. In particular, the trading bias was deemed bullish when the weekly 14-period Stochastic Oscillator was above some default value (in him paper - 50) and rising and vice versa.
Once the trading bias is established, Steckler used the Average Directional Index (ADX) to define a slowdown in the trend. ADX measures the strength of the trend and a move below 20 signals a weak trend.
Modifications
I didn't implement Average Directional Index (ADX) and test just different sources for data, oscillator periods and different levels in relation to the crypto market.
So, it shows good results with two tight thresholds at 55 and 45 level.
The bar chart below the defining the bullish and bearish periods (green and red) and gives a signal to enter the trade (purple bars).
Backtesting
Backtested on XBTUSD , BTCPERP (FTX) pairs. You may notice it shows good results on 3h timeframe.
Relatively low drawdown
~ 10% (from 2019 to date) FTX
~ 22% (4 years from 2016) Bitmex
I backtested on the different altcoin pairs as well, but the results were just not good.
Relatively good results were shown by some index pairs from the FTX exchange ( FTX:SHITPERP ), but I think there is a few data for backtesting to be asure in them.
Bitmex 3h (2017 - 2020) :
i.imgur.com
FTX 3h (2019 - 2020):
i.imgur.com
Possible Improvements
- Regarding trading algorithm it would be good to check with strategy with ADX somehow. Maybe for the better entries
- As for Risk Management system, it can be improved by adding trailing stop to the strategy.
Link: school.stockcharts.com

WhiteSRSI
This indicator, combines stochastic and rsi of different timeframes, is convenient when used on younger timeframes.

Stoch RSI+Stoch RSI+
It is based on mainstream setting
Shows Stochastic RSI K line(blue) and nStochastic RSI D line(red)
■Buy sign
will buy when golden cross occured and Stochastic RSI K line <= OverBought%
■Sell sign
will buy when dead cross occured and Stochastic RSI K line >= OverSold%

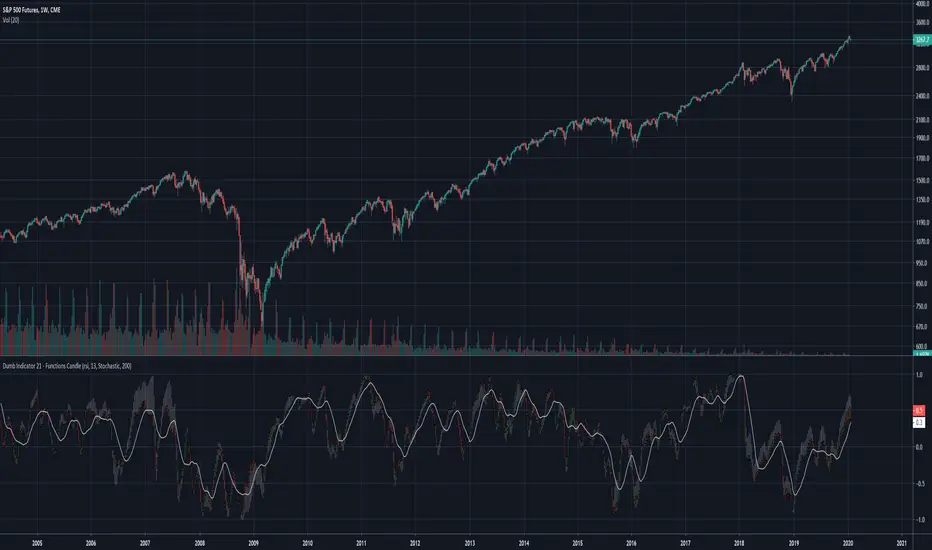
Dumb Indicator 21 - Function's Candlestick Bar's StyleThe idea is help traders to see the patterns and levels from a different point o view.
This script create candlestick using the opening, high, low and close price as source on your favorite function.
It's very simple to use:
Select a function in the drop box list, the number of bars length, check or uncheck the boxes to treat source as logarithm, smooth, and if you want to plot the SMA from the results.
To make a deeper analysis, you can select to plot the candles in Stochastic or in Percent Rank way.
The Stochastic and Percent Rank plot will show how far the price is close to highest or lowest value of the source from the last "Stochastic Length" number of bars.
Some functions with different names can plot the same results.
This indicator works on every kind of market, but you will need to find the best function and length to use.
Please, if you find anything good with this, share to everyone.
CryptoSignalScanner - Stochastic Trend IndicatorDESCRIPTION:
This script has been designed to provide the ideal buy and sell moment on the lower time frames.
• This scripts is based on the Stochastic RSI Indicator.
• When we are in an uptrend the background becomes green.
• When we are in a downtrend the background becomes red.
• It is also possibility to set the overbought and oversold range.
HOW TO USE:
• When the blue line (stochastic K) has crossed above the red line (stochastic D) in the oversold area then this is the ideal moment to get into a trade.
• When the blue line (stochastic K) has crossed below the red line (stochastic D) in the overbought area then this is the ideal moment to get out of a trade.
• Use this together with the CryptoSignalScanner - Advanced BUY/SELL indicator to get a stronger confirmation.
• Use the Fibonacci tool together with the Eliot Waves to help you to find the ideal buy or sell moment.
HOW TO GET ACCESS TO THE SCRIPT:
• Use the link below to subscribe to our indicators.
REMARKS:
• This advice is NOT financial advice.
• We do not provide personal investment advice and we are not a qualified licensed investment advisor.
• All information found here, including any ideas, opinions, views, predictions, forecasts, commentaries, suggestions, or stock picks, expressed or implied herein, are for informational, entertainment or educational purposes only and should not be construed as personal investment advice.
• We will not and cannot be held liable for any actions you take as a result of anything you read here.
• We only provide this information to help you make a better decision.
• While the information provided is believed to be accurate, it may include errors or inaccuracies.
Good Luck,
The CryptoSignalScanner Team

Better Stochastic RSI to find DivergencesThis indicator is a modified version of a stochastic RSI oscillator. I want to share this because it is really good for analysis of divergence between price action and the oscillator. You can also use it to trade overbought and oversold conditions.
To find out more what a divergences is when we talk about trading. Take a look at this: medium.com

Trend Scalper (Expo)Trend Scalper (Expo)
DESCRIPTION
Trend Scalper (Expo) is a Scalping strategy based on RSI, Stochastic and moving averages techniques. The idea is to visualize scalping opportunities in trends.
The trend is determined by the color of the moving average called ‘TrendHolder’ The ‘Trendholer’ consists of 3 colors, green, red and orange. Green is a positive trend, red is a negative trend and orange is a neutral or no trend.
Scalping opportunities are visualized by the circles and the triangles. The circles are based on RSI calculation. The triangles are based on Stochastic calculation.
- If there is a green circle and a green triangle and ‘Trendholder’ is orange or green, Enter Long!
- If there is a red circle and a red triangle and ‘Trendholder’ is orange or red, Enter Short!
Combine the indicator with HEIKIN ASHI candlesticks.
HOW TO USE
1. Use the indicator to find scalping opportunities in trends.
I NDICATOR IN ACTION
BTCUSD
EURUSD
GOLD
The indicator works with RENKO, HEIKIN ASHI and with KAGI charts as well.
I hope you find this indicator useful, and please comment or contact me if you like the script or have any questions/suggestions for future improvements. Thanks!
I will continue to work on this indicator, so please share your experience and feedback with me so that I can continuously improve it. Thanks to everyone that have contacted me regarding my scripts. Y our feedback is valuable for future developments!
ACCESS THE INDICATOR
• Contact me on TradingView or use the links below
-----------------
Disclaimer
Copyright by Zeiierman.
The information contained in my scripts/indicators/ideas does not constitute financial advice or a solicitation to buy or sell any securities of any type. I will not accept liability for any loss or damage, including without limitation any loss of profit, which may arise directly or indirectly from use of or reliance on such information.
All investments involve risk, and the past performance of a security, industry, sector, market, financial product, trading strategy, or individual’s trading does not guarantee future results or returns. Investors are fully responsible for any investment decisions they make. Such decisions should be based solely on an evaluation of their financial circumstances, investment objectives, risk tolerance, and liquidity needs.
My scripts/indicators/ideas are only for educational purposes!
