Stochastic Money Flow IndexThe Stochastic Money Flow Index (or Stochastic MFI ), is a variation of the classic Stochastic RSI that uses the Money Flow Index (MFI) rather than the Relative Strength Index (RSI) in its calculation.
While the RSI focuses solely on price momentum, the MFI is a volume-weighted indicator, meaning it incorporates both price and volume data.
The Stochastic MFI is intended to provide a more precise and sensitive reading of the MFI by measuring the level of the MFI relative to its range over a specific period.
Settings
Stochastic Settings
%K Length : The number of periods used to calculate the Stochastic. (Default: 14)
%K Smoothing : The SMA length used to 'smooth' the %K line. (Default: 3)
%D Smoothing : The SMA length used to 'smooth' the %D line. (Default: 1)
Money Flow Index Settings
MFI Length : The number of periods used to calculate the Money Flow Index. (Default: 14)
MFI Source : The source used to calculate the Money Flow Index. (Default: close)
Additional Settings
Show Overbought/Oversold Gradients? : Toggle the display of overbought/oversold gradients. (Default: true)
Stochastic Oscillator

Stochastic SuperTrend [BigBeluga]🔵 OVERVIEW
A hybrid momentum-trend tool that combines Stochastic RSI with SuperTrend logic to deliver clean directional signals based on momentum turns.
Stochastic SuperTrend is a straightforward yet powerful oscillator overlay designed to highlight turning points in momentum with high clarity. It overlays a SuperTrend-style envelope onto the Stochastic RSI, generating intuitive up/down signals when a momentum shift occurs across the neutral 50 level. Built for traders who appreciate simplicity without sacrificing reliability.
🔵 CONCEPTS
Stochastic RSI: Measures momentum by applying stochastic calculations to the RSI curve instead of raw price.
SuperTrend Bands: Dynamic upper/lower bands are drawn around the smoothed Stoch RSI line using a user-defined multiplier.
Momentum Direction: Trend flips when the smoothed Stoch RSI crosses above/below the calculated bands.
Neutral Bias Filter: Directional arrows only appear when momentum turns above or below the central 50 level—adding confluence.
🔵 FEATURES
Trend Detection on Oscillator: Applies SuperTrend logic directly to the Stoch RSI curve.
Clean Entry Signals:
→ 🢁 arrow printed when trend flips bullish below 50 (bottom reversals).
→ 🢃 arrow printed when trend flips bearish above 50 (top reversals).
Custom Multiplier: Adjust sensitivity of SuperTrend band spacing around the oscillator.
Neutral Zone Highlight: Visual zone between 0–50 (green) and 50–100 (red) for quick momentum polarity reference.
Toggle SuperTrend Line: Option to show/hide the SuperTrend trail on the Stoch RSI.
🔵 HOW TO USE
Use 🢁 signals for potential bottom reversals when momentum flips bullish from oversold regions.
Use 🢃 signals for potential top reversals when momentum flips bearish from overbought areas.
Combine with price-based SuperTrend or support/resistance zones for confluence.
Suitable for scalping, swing trading, or momentum filtering across all timeframes.
🔵 CONCLUSION
Stochastic SuperTrend is a simple yet refined tool that captures clean momentum shifts with directional clarity. Whether you're identifying reversals, filtering entries, or spotting exhaustion in a trend, this oscillator overlay delivers just what you need— no clutter, just clean momentum structure.

Aqua MTF Stochastic Oscillator——————————————————————————————————————————————————————————
The Aqua Multi-Timeframe (MTF) Stochastic Oscillator is a comprehensive momentum analysis tool that synthesizes
stochastic data from up to five distinct, user-configurable sources and timeframes into a single, unified view.
--- CORE CONCEPT ---
Traditional oscillators provide insight into one specific timeframe. This indicator overcomes that limitation by
aggregating momentum readings from multiple timeframes. The core principle is to gauge the confluence of momentum
across different market cycles. A strong trend is often characterized by aligned momentum across short-term,
medium-term, and long-term perspectives. This tool visualizes that alignment in a clear, intuitive oscillator.
--- METHODOLOGY ---
For each of the five analysis slots, the script calculates the Stochastic %K line and its corresponding %D signal line.
To allow for direct comparison and weighting, each of these standard 0-100 oscillator values is then normalized
to a bipolar scale of -100 to +100, where 0 represents the neutral midline.
These normalized scores are then blended, according to user-defined weights, into two master composite lines:
1. A master "Score Line" representing the weighted average of the raw %K momentum values.
2. A master "Signal Line" representing the weighted average of the smoothed %D signal values.
--- KEY FEATURES ---
• Multi-Timeframe & Multi-Symbol Analysis: Configure up to five slots, each with its own symbol, timeframe, price source, and stochastic settings.
• Normalized Momentum Scale: All stochastic values are re-scaled to a -100 to +100 range, providing a standardized measure of momentum. Values above 0 indicate bullish momentum, while values below 0 indicate bearish momentum.
• Weighted Composite Score: User-defined weights allow for prioritizing certain timeframes, creating a custom-tailored final momentum reading.
• Dynamic Color-Coding: The color of the master Score Line and each individual timeframe's line instantly changes based on its position relative to its signal line (%K vs. %D). This provides immediate visual feedback on momentum acceleration (bullish) or deceleration (bearish).
--- HOW TO INTERPRET ---
• Crossovers: The interaction between the master Score Line and the Signal Line can be used to identify potential shifts in momentum, similar to a traditional MACD.
• Line Color: The color of the master Score Line itself serves as a primary signal. A bullish color indicates that overall raw momentum is leading smoothed momentum, and vice-versa.
• Overbought/Oversold Levels: Extreme readings near the +100 or -100 levels suggest that the aggregated momentum may be overextended and due for a reversion.
• Zero Line Crosses: When the oscillator crosses above the zero line, it signals that the balance of momentum has shifted to positive territory. A cross below zero signals a shift to negative territory.
• Divergence: Look for divergences where price makes a new high or low, but the oscillator fails to confirm it. This can often signal a pending reversal.
Author: Aquaritek
——————————————————————————————————————————————————————————

Multi TF Oscillators Screener [TradingFinder] RSI / ATR / Stoch🔵 Introduction
The oscillator screener is designed to simplify multi-timeframe analysis by allowing traders and analysts to monitor one or multiple symbols across their preferred timeframes—all at the same time. Users can track a single symbol through various timeframes simultaneously or follow multiple symbols in selected intervals. This flexibility makes the tool highly effective for analyzing diverse markets concurrently.
At the core of this screener lie two essential oscillators: RSI (Relative Strength Index) and the Stochastic Oscillator. The RSI measures the speed and magnitude of recent price movements and helps identify overbought or oversold conditions.
It's one of the most reliable indicators for spotting potential reversals. The Stochastic Oscillator, on the other hand, compares the current price to recent highs and lows to detect momentum strength and potential trend shifts. It’s especially effective in identifying divergences and short-term reversal signals.
In addition to these two primary indicators, the screener also displays helpful supplementary data such as the dominant candlestick type (Bullish, Bearish, or Doji), market volatility indicators like ATR and TR, and the four key OHLC prices (Open, High, Low, Close) for each symbol and timeframe. This combination of data gives users a comprehensive technical view and allows for quick, side-by-side comparison of symbols and timeframes.
🔵 How to Use
This tool is built for users who want to view the behavior of a single symbol across several timeframes simultaneously. Instead of jumping between charts, users can quickly grasp the state of a symbol like gold or Bitcoin across the 15-minute, 1-hour, and daily timeframes at a glance. This is particularly useful for traders who rely on multi-timeframe confirmation to strengthen their analysis and decision-making.
The tool also supports simultaneous monitoring of multiple symbols. Users can select and track various assets based on the timeframes that matter most to them. For example, if you’re looking for entry opportunities, the screener allows you to compare setups across several markets side by side—making it easier to choose the most favorable trade. Whether you’re a scalper focused on low timeframes or a swing trader using higher ones, the tool adapts to your workflow.
The screener utilizes the widely-used RSI indicator, which ranges from 0 to 100 and highlights market exhaustion levels. Readings above 70 typically indicate potential pullbacks, while values below 30 may suggest bullish reversals. Viewing RSI across timeframes can reveal meaningful divergences or alignments that improve signal quality.
Another key indicator in the screener is the Stochastic Oscillator, which analyzes the closing price relative to its recent high-low range. When the %K and %D lines converge and cross within the overbought or oversold zones, it often signals a momentum reversal. This oscillator is especially responsive in lower timeframes, making it ideal for spotting quick entries or exits.
Beyond these oscillators, the table includes other valuable data such as candlestick type (bullish, bearish, or doji), volatility measures like ATR and TR, and complete OHLC pricing. This layered approach helps users understand both market momentum and structure at a glance.
Ultimately, this screener allows analysts and traders to gain a full market overview with just one look—empowering faster, more informed, and lower-risk decision-making. It not only saves time but also enhances the precision and clarity of technical analysis.
🔵 Settings
🟣 Display Settings
Table Size : Lets you adjust the table’s visual size with options such as: auto, tiny, small, normal, large, huge.
Table Position : Sets the screen location of the table. Choose from 9 possible positions, combining vertical (top, middle, bottom) and horizontal (left, center, right) alignments.
🟣 Symbol Settings
Each of the 10 symbol slots comes with a full set of customizable parameters :
Enable Symbol : A checkbox to activate or hide each symbol from the table.
Symbol : Define or select the asset (e.g., XAUUSD, BTCUSD, EURUSD, etc.).
Timeframe : Set your desired timeframe for each symbol (e.g., 15, 60, 240, 1D).
RSI Length : Defines the period used in RSI calculation (default is 14).
Stochastic Length : Sets the period for the Stochastic Oscillator.
ATR Length : Sets the length used to calculate the Average True Range, a key volatility metric.
🔵 Conclusion
By combining powerful oscillators like RSI and Stochastic with full customization over symbols and timeframes, this tool provides a fast, flexible solution for technical analysts. Users can instantly monitor one or several assets across multiple timeframes without opening separate charts.
Individual configuration for each symbol, along with the inclusion of key metrics like candlestick type, ATR/TR, and OHLC prices, makes the tool suitable for a wide range of trading styles—from scalping to swing and position trading.
In summary, this screener enables traders to gain a clear, high-level view of various markets in seconds and make quicker, smarter, and lower-risk decisions. It saves time, streamlines analysis, and boosts overall efficiency and confidence in trading strategies.

Robby DSS Bressert Colored DotsIntroduction
The Robby DSS Bressert Colored Dots is a technical analysis tool designed to measure momentum and identify potential overbought or oversold conditions in a market. It is a visually enhanced version of the Double Smoothed Stochastic (DSS) indicator, which was developed to be a smoother and more responsive version of the traditional Stochastic Oscillator.
This specific version provides at-a-glance information about momentum shifts through the use of colored dots, making it easy to interpret.
The Core Engine: DSS Bressert
The foundation of this indicator is the Double Smoothed Stochastic, a concept attributed to both William Blau and Walter Bressert, who introduced similar ideas. The goal of the DSS is to filter out the "noise" and false signals common in standard oscillators without introducing significant lag.
It achieves this through a two-step smoothing process:
First Smoothing: A standard Stochastic value is calculated based on the price. This value is then smoothed using an Exponential Moving Average (EMA). This creates a cleaner, less erratic line than the raw stochastic.
Second Smoothing: The indicator then takes this newly smoothed line and performs a second Stochastic calculation on it. This result is then smoothed one final time with another EMA.
This double-application of smoothing results in a very clean oscillator line that reacts quickly to price changes but is less prone to whipsaws.
The Visual Modification: "Robby" Colored Dots
The "Robby DSS Bressert Colored Dots" version takes the powerful DSS calculation and adds a unique visual layer for easier interpretation.
Colored Dots: Instead of plotting a continuous line, the indicator displays a dot for each candle. The color of this dot instantly tells you about the indicator's momentum:
Lime/Green dots appear when the DSS value is rising, indicating bullish or positive momentum.
Red dots appear when the DSS value is falling, indicating bearish or negative momentum.
If the value is unchanged, the dot retains the color of the previous one.
The "Robby" Name: In trading communities like Forex Factory and MQL5, it's common for programmers to modify popular indicators. These enhanced versions are often named after the member who created or popularized them. The "Robby" version specifically refers to this popular colored-dot modification of the DSS Bressert.
How to Interpret and Use It
Traders typically use the Robby DSS Bressert Colored Dots in a few key ways:
Momentum Shifts: The most straightforward signal is the change of dot color. A switch from red to lime can signal that downside momentum is waning and a potential move up is beginning. A switch from lime to red signals the opposite.
Overbought & Oversold Conditions: Like a standard stochastic, the indicator uses levels (typically 80 and 20).
When the dots are above 80, the market is considered overbought. A color change from lime to red in this zone can be a strong signal for a potential reversal down.
When the dots are below 20, the market is considered oversold. A color change from red to lime here can signal a potential reversal up.
Trend Confirmation: In a strong uptrend, traders might ignore red dots and use the appearance of lime dots in the oversold zone (or after a minor pullback) as a signal to join the trend. The opposite is true in a downtrend.
---
This is just an indicator that can found publicly online for mt4, and just translated it to Pinescript.

Dual Stochastic Enhanced (with Presets giua64)Script Title: Dual Stochastic Enhanced (with Presets giua64)
Overview:
This indicator enhances the traditional Dual Stochastic strategy, aiming to provide more filtered and potentially reliable trading signals. By integrating dynamic overbought/oversold levels via Bollinger Bands on the slow stochastic, a trend filter based on a moving average, momentum confirmation via RSI, and user-friendly selectable presets, "Dual Stochastic Enhanced" seeks to offer a more robust approach to identifying potential entry points.
Key Features:
Dual Stochastics: Utilizes a slow stochastic (configurable, e.g., 14 periods) as a context filter and a fast stochastic (configurable, e.g., 5 periods) as a signal trigger.
Bollinger Bands on Slow Stochastic: Instead of fixed overbought/oversold levels (80/20), Bollinger Bands are applied to the %K line of the slow stochastic. This creates dynamic zones that adapt to the stochastic's own volatility.
Trend Filter: A moving average (configurable type and length, e.g., EMA 100 as seen in the example chart for general context) on the price helps filter signals, allowing only trades aligned with the prevailing trend.
RSI Confirmation: An RSI oscillator (configurable length, e.g., 14 periods) is used to confirm momentum. Signals require the RSI to cross certain thresholds to validate the strength of the move.
User Presets: Includes presets for "Scalping," "Intraday," and "Swing trading," which quickly set all key parameters to suit different styles and timeframes. A "Custom" option is also available for full manual configuration.
Clear Visual Signals: Long (green) and Short (red) arrows appear on the chart when all entry conditions are met.
Active Zone Highlighting: The background of the indicator panel changes color (green or red) when "active zone" conditions (a combination of stochastics, trend, and RSI) are favorable.
Information Panel: A table in the top-right corner of the indicator panel displays the current status of the selected preset, trend filter, RSI value, and stochastic levels.
Signal Logic:
A LONG signal is generated when:
The fast stochastic %K crosses above its %D line.
The slow stochastic %K line is below its lower Bollinger Band (dynamic oversold condition).
The fast stochastic %K line is also in a low area (e.g., <25) to confirm the trigger is not premature.
The closing price is above the trend moving average (uptrend).
The RSI is above its long confirmation level (e.g., >40), indicating sufficient bullish momentum.
A SHORT signal is generated when:
The fast stochastic %K crosses below its %D line.
The slow stochastic %K line is above its upper Bollinger Band (dynamic overbought condition).
The fast stochastic %K line is also in a high area (e.g., >75).
The closing price is below the trend moving average (downtrend).
The RSI is below its short confirmation level (e.g., <60), indicating sufficient bearish momentum.
How to Use:
Select a Preset suitable for your trading style and the timeframe you are analyzing (e.g., Scalping for M1-M15, Intraday for M5-H1, Swing for H4-D1).
Alternatively, choose "Custom" and manually adjust all parameters (stochastic lengths, smoothing, Bollinger Bands, Moving Average, RSI, confirmation thresholds).
Observe the Information Panel for a quick understanding of the current conditions.
Evaluate the arrow signals, always considering the broader market context, price action, and any other confluences (supports/resistances, chart patterns).
The background highlighting can help quickly identify periods where conditions are aligned for potential trades.
Disclaimer:
This script is provided for educational and informational purposes only. Trading involves significant risk, and past performance is not indicative of future results. Always thoroughly test any strategy or indicator on historical data and on a demo account before risking real capital. The author assumes no responsibility for any losses incurred from the use of this script.
Author: giua64

Mits Pixel BTCUSDStrategy
Using Rsi Stochastic, Hull Moving Average, Price Action and volume differences to get signals
HOW IT WORKS
Pixel parts :
- (U) The first pixel is a pixel that shows a trend during an uptrend, a trend when the market is considered bullish (above the MA line)
- (V) The second pixel is the volume pixel, showing the up and down movement of the buy / sell volume .
- (M) The third pixel is the momentum pixel, showing the market momentum whether it is overbought or oversold.
- (D) The fourth pixel is a pixel that shows a trend during a downtrend, a trend when the market is considered bearish (below the MA line)
When the price opens above the MA line, 3 pixels will appear, namely the first Pixel which is called the Trend up Pixel, Pixel Volume , and also the Momentum Pixel.
When the price opens below the MA line, 3 pixels will appear, namely Pixel Volume , Pixel Momentum, and the bottom one is the Pixel Down Trend.
* Pixel up trend (appears when the open is above the MA line)
- The pixel will show a solid green color when a gap up is opened or volume up, then the close price is greater than the open price.
- The pixel will show a light green color if there is normal strengthening (the close is bigger than the previous day's close without creating a gap up), then the close price is bigger than the open price.
- Pixel will show yellow color if it meets several criteria, for example, close is equal to open or close is bigger than the previous close but close is smaller than open.
- The pixel will show a dark red color when there is attenuation and a Gap down is created, then the close price is smaller than the open price.
- Pixel will show red color if there is normal weakening (close is smaller than the close of the previous day without creating a gap down), then the close price is smaller than the open price.
* Pixel down trend (appears when the open is below the Moving Average)
The pixel color indication is the same as the Trend up Pixel
* Volume Pixel
- The pixel is dark green when there is an increase and a gap up is created and the volume for that day is bigger than the volume of the previous day.
- The pixel will be green if there is a normal strengthening and also the volume for that day is greater than the volume of the previous day, or there is a gap up but the volume is smaller than the volume of the previous day.
- The pixel is yellow if it meets several conditions, for example, the volume of the day is the same as the volume of the previous day.
- The pixel is dark red when there is weakness and a Gap down is created and also the volume of the day's weakness is greater than the volume of the previous day.
- The pixel is red if there is normal weakening and also the volume of the day's weakness is bigger than the previous day's volume , or if there is a gap down but the volume is smaller than the previous day's volume .
* Momentum Pixel (basically StochRSI combined with other HMA , TopBox (Resistance), BottomBox(Support)).
- The pixel is dark green when it meets several conditions, for example the golden cross is below 50.
- The pixel is green if it meets several conditions, for example a golden cross below 50 without Gap up.
- Pixel will be yellow if it meets several conditions, for example k is greater than d and k has entered the overbought area (greater than 80).
- Pixel is dark red when it meets several conditions, for example k is smaller than d and k has entered the overbought area.
- Pixel is red when it meets several conditions, for example k is smaller than d and k is greater than 50 and k is less than 80.
Bar Color
Dark Green : Price Up + Volume Up
Green : Price Up + Volume Down
Dark Red : Price Down + Volume Up
Red : Price Down + Volume Down
Too many details that cannot be detailed one by one , but in broad outline as explained above.
HOW TO USE
* Signals Buy
- Strong Buy : All pixels are green, and Momentum Pixel is dark green.
- Normal Buy : All pixels are green or two dark green (one of them must momentum pixel) and one yellow.
- Spek Buy : * Two green pixels (one of them must momentum pixel) and one yellow or 1 green/dark green in momentum pixel, and other pixels yellow
* Signals Sell
- Strong Sell : All pixels are red, and Momentum Pixel is dark red.
- Normal Sell : All pixels are either red or two dark red (one of them must momentum pixel) and one yellow.
- Spek Sell : Two red pixels (one of them must momentum pixel) and one yellow or 1 dark red in momentum pixel, and other pixels yellow
- Warning Sell : Momentum pixels are dark red, regardless of the color of the other pixels.
* Best use for trading in BTCUSD markets
Thanks for Moderators

RTH Session Range Position (0-100) with EMAA Pine Script indicator designed to help traders understand where the current price is located within the Regular Trading Hours (RTH) session range, from 0 (session low) to 100 (session high). It also plots a smoothed EMA of this position to provide insight into momentum or trend during the RTH session.
What the Indicator Does
Defines RTH (Regular Trading Hours):
Start: 9:30 AM
End: 4:00 PM
These are typical US equity market hours.
Tracks the session's high and low during RTH:
sessionHigh and sessionLow update only during RTH.
Calculates position of the current price within the RTH range:
Formula: ((close - sessionLow) / (sessionHigh - sessionLow)) * 100
Result is a percentage:
0 = at session low
100 = at session high
50 = middle of session range
Calculates an EMA of that position (posEMA):
Smooths out the raw position to help visualize momentum within the range.
Plots and table:
Plots pos and posEMA on a separate chart pane.
Adds horizontal lines at key levels (0, 30, 50, 70, 100).
Table shows current values for Position, EMA, and Range.
Visual cues:
bgcolor highlights when pos crosses over or under the EMA — potential momentum shifts.
Alerts:
Cross above/below 50 (session midpoint).
Cross above/below EMA.
How to Use It Effectively
1. Session Strength & Momentum
Position above 70: Price is near session highs — strong upward momentum.
Position below 30: Price is near session lows — strong downward momentum.
Use the EMA of position to filter out noise and identify trends.
2. Breakout or Reversal Detection
Cross above EMA: Momentum may be turning bullish.
Cross below EMA: Momentum may be turning bearish.
These crosses (especially near mid-levels like 50) can hint at session trend shifts.
3. Range Context for Entries
If you're a mean-reversion trader, look for:
Price > 70 + turning down below EMA → possible short.
Price < 30 + turning up above EMA → possible long.
For breakout traders, you might wait for:
Crosses above 70 with EMA support.
Crosses below 30 with EMA resistance.
4. Confirmation Tool
Use this indicator alongside others to confirm:
Whether price action has strength within the day.
Whether breakouts have real momentum or are extended already.

Stoch Quad Oscillator📘 Stoch Quad Oscillator – User Guide
✅ Purpose
The Stoch Quad Oscillator is a multi-timeframe stochastic oscillator tool that helps traders detect oversold and overbought conditions, momentum shifts, and quad rotation signals using four distinct stochastic configurations. It includes visual cues, customizable parameters, and background highlights to improve decision-making during trend reversals or momentum surges.
🛠️ Inputs & Parameters
⏱ Timeframe
Timeframe for Stochastic Calculation: Defines which chart timeframe to use for stochastic calculations (default is "1" minute). This enables multi-timeframe analysis while on a lower timeframe chart.
📈 Stochastic Parameters
Four different stochastic configurations are used:
Label %K Length %D Smoothing Notes
K9 D3 9 3 Fastest, short-term view
K14 D3 14 3 Moderately short-term
K40 D4 40 4 Medium-term trend view
K60 D10 60 10 Long-term strength
Smoothing Type: Choose between SMA or EMA to control how smoothed the %D line is.
🎯 Levels
Overbought Level: Default 80
Oversold Level: Default 20
These are used to indicate overextended price conditions on any of the stochastic plots.
🔄 Quad Rotation Detection Settings
When enabled, the script detects synchronized oversold/overbought conditions with strong momentum using all 4 stochastic readings.
Enable Quad Rotation: Toggles detection on or off
Slope Calculation Bars: Number of bars used to calculate slope of %D lines
Slope Threshold: Minimum slope strength for signal (higher = stronger confirmation)
Oversold Quad Level: Total of all four stochastic values that define a quad oversold zone
Overbought Quad Level: Total of all four stochastic values that define a quad overbought zone
Oversold Quad Highlight Color: Background color when oversold quad is triggered
Overbought Quad Highlight Color: Background color when overbought quad is triggered
Slope Averaging Method: Either Simple Average or Weighted Average (puts more weight on higher timeframes)
Max Signal Bar Window: Defines how recent the signal must be to be considered valid
📊 Plots & Visual Elements
📉 Stochastic %D Lines
Each stochastic is plotted separately:
K9 D3 – Red
K14 D3 – Orange
K40 D4 – Fuchsia
K60 D10 – Silver
These help visualize short to long-term momentum simultaneously.
📏 Horizontal Reference Lines
Overbought Line (80) – Red
Oversold Line (20) – Green
These help you identify threshold breaches visually.
🌈 Background Highlighting
The indicator provides background highlights to mark potential signal zones:
✅ All Oversold or Overbought Conditions
When all four stochastics are either above overbought or below oversold:
Bright Red if all are overbought
Bright Green if all are oversold
🚨 Quad Rotation Signal Zones (if enabled)
Triggered when:
The combined sum of all four stochastic levels is extremely low/high (below/above oversoldQuadLevel or overboughtQuadLevel)
The average slope of the 4 %D lines is sharply positive (> slopeThreshold)
Highlights:
Custom Red Tint = Strong overbought quad signal
Custom Green Tint = Strong oversold quad signal
These zones can indicate momentum shifts or reversal potential when used with price action or other tools.
⚠️ Limitations & Considerations
This indicator does not provide trade signals. It visualizes conditions and potential setups.
It is best used in confluence with price action, support/resistance levels, and other indicators.
False positives may occur in ranging markets. Reduce reliance on slope thresholds during low volatility.
Quad signals rely on slope strength, which may lag slightly behind sudden reversals.
🧠 Tips for Use
Combine with volume, MACD, or PSAR to confirm direction before entry.
Watch for divergences between price and any of the stochastics.
Use on higher timeframes (e.g., 5m–30m) to filter for swing trading setups; use shorter TFs (1m–5m) for scalping signals.
Adjust oversoldQuadLevel and overboughtQuadLevel based on market conditions (e.g., in trending vs ranging markets).

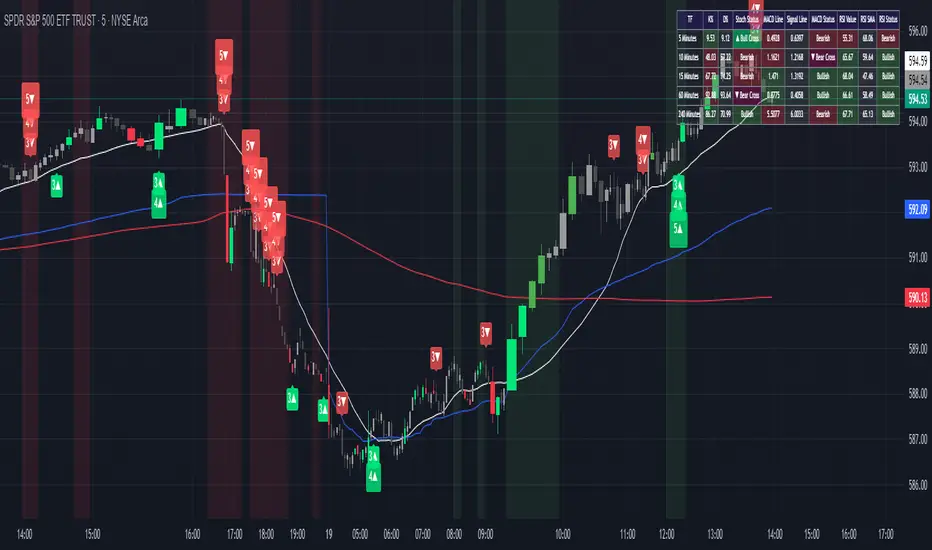
MTF Dashboard (Stoch,MACD,RSI) & Stochastic Signals
English Script Description:
Indicator Title: MTF Dashboard (Stoch,MACD,RSI) & Stochastic Signals
1. Overview
The "MTF Dashboard (Stoch,MACD,RSI) & Stochastic Signals" indicator is an advanced, multi-faceted analytical tool designed for comprehensive market analysis. It consolidates a detailed multi-timeframe (MTF) dashboard for Stochastic, MACD, and RSI, hierarchical Stochastic alignment signals (S3, S4, S5), PVSRA-based candle coloring, a customizable moving average, optional MA/VWAP filters for signals, and dynamic background coloring into a single, integrated Pine Script™ utility. This indicator aims to provide traders with a deeper market perspective by consolidating multiple layers of analysis onto the current chart.
2. Originality and Usefulness
This script’s originality stems from its comprehensive integration of several distinct analytical methodologies into a cohesive and highly customizable framework. While the core concept for the hierarchical Stochastic signals (S3-S5) was inspired by the work of f56eroon (ابو بتال - خطيرون), this indicator represents a significant original development by Saleh_ABO_RAED. Key original contributions include:
The specific implementation and extensive customization of the MTF dashboard displaying Stochastic, MACD, and RSI across five user-defined timeframes.
The seamless integration of PVSRA ( Volume) candle coloring, providing an immediate visual layer of volume confirmation.
The inclusion of a fully customizable general-purpose Moving Average.
The advanced and independent MA and VWAP filtering options for the S3-S5 Stochastic signals.
The overall script architecture that allows these diverse components to work synergistically.
Justification for Mashup:
This indicator is designed to provide a multi-dimensional view of the market, which is often necessary for robust trade decision-making. By combining:
MTF Analysis (Dashboard & Signals): To understand the broader context and identify signals aligning across multiple perspectives.
Momentum & Trend (Stoch, MACD, RSI, MA): To gauge the strength and direction of price movements.
Volume Analysis (PVSRA): To assess the conviction behind price action.
Signal Filtering (MA/VWAP): To enhance the reliability of generated signals.
This "mashup" is justified by its utility in helping traders identify higher-probability setups through the confluence of these varied analytical signals, all within a single tool, thus reducing chart clutter and streamlining the analytical process. The script is useful for traders who appreciate a detailed, layered approach to market analysis and seek to confirm signals from multiple non-correlated perspectives.
Practical Benefit for Traders:
This tool empowers traders to:
Quickly assess market conditions across multiple timeframes and key indicators.
Identify potential trade entries based on hierarchical Stochastic signals, confirmed by PVSRA and optional MA/VWAP filters.
Visually gauge market strength and conviction through PVSRA candle coloring.
Utilize a customizable MA for trend direction and dynamic support/resistance.
Make more informed decisions by considering a confluence of analytical factors.
3. Key Features
Multi-Timeframe Dashboard (Stochastic, MACD, RSI): Displays Stochastic (%K, %D, Status), MACD (Line, Signal, Status), and RSI (Value, SMA, Status) for up to five user-configurable timeframes (TF1 to TF5).
Hierarchical Stochastic Alignment Signals (S3, S4, S5): Generates signals based on a sequence of Stochastic confirmations across TF1-TF5, with user-defined K-level thresholds for initial crosses and subsequent confirmations.
PVSRA Candle Coloring: Integrates PVSRA logic to color candles based on volume and price action analysis (e.g., Bullish/Bearish 200% Volume, 150% Volume, Normal Volume candles). Option to override current symbol for PVSRA calculation.
Customizable Moving Average (MA): Plots a user-selectable MA (SMA or EMA) with configurable length, source, color, and width.
Dual Independent Optional Signal Filters (for S3-S5 signals):
MA Filter: Optionally filter S3-S5 signals using a separate configurable MA (SMA, EMA, WMA).
VWAP Filter: Optionally filter S3-S5 signals using VWAP with advanced anchoring options.
Customizable Background Coloring: Optionally colors the chart background when Stochastic indicators on TF3, TF4, and TF5 are in bullish or bearish alignment.
Extensive Customization: Configure all timeframes, all indicator parameters (Stoch, MACD, RSI, PVSRA colors, MA settings, VWAP settings), signal confirmation K-levels, table appearance, and alert conditions.
Alerts: Defines multiple alert conditions for S3, S4, and S5 Bullish/Bearish alignment signals, with alert messages indicating active filters.
4. How It Works
MTF Data & Dashboard: The script fetches and calculates Stochastic, MACD, and RSI data for each of the five user-defined timeframes using request.security with barmerge.lookahead_on to prevent future data leakage. This data populates the on-chart table.
PVSRA Candle Coloring: Analyzes each bar's volume and price range against historical averages (e.g., 10-period SMA of volume) to identify candles with significantly high volume (e.g., >=150% or >=200% of average) or high "value2" (volume * range), coloring them accordingly to denote strong buying or selling pressure.
Stochastic Signal Generation (S3-S5):
An initial Stochastic cross on TF1 (optionally filtered by K-level) serves as the trigger.
This cross is then confirmed sequentially by congruent Stochastic conditions (K above/below D, and K above/below user-defined confirmation levels) on TF2, TF3 (for an S3 signal), then TF4 (for S4), and finally TF5 (for S5).
MA & VWAP Signal Filtering: If enabled, generated S3-S5 signals are only plotted (and trigger alerts) if the price also satisfies the condition relative to the chosen MA (e.g., price > MA for longs) and/or VWAP. Both MA and VWAP lines can be plotted independently.
Background Coloring: Based on the consensus of Stochastic states (bullish/bearish) on TF3, TF4, and TF5.
5. How to Use
Configure Timeframes & Base Indicators: Set up your desired MTF levels (TF1-TF5) and the parameters for Stoch, MACD, and RSI via the script's "Settings/Inputs" dialogue.
Configure PVSRA & General MA: Enable/disable PVSRA candle coloring and the general MA plot; adjust their respective parameters (colors, lengths, types).
Set Stochastic Signal Parameters:
Adjust K-level thresholds for TF1 Stochastic crosses (set to 0 for bull/100 for bear to disable K-level entry filter).
Configure K-level confirmation thresholds for TF2-TF5.
Configure Optional MA/VWAP Signal Filters: Independently enable plotting and/or signal filtering for the MA and/or VWAP; choose their types, lengths, and anchor periods.
Interpret:
Dashboard: For an overview of market conditions.
PVSRA Candles: For volume confirmation of price movements.
S3-S5 Signals: As potential indications of strengthening multi-timeframe Stochastic alignment. The more filters a signal passes (MA, VWAP), the more confluent it might be considered.
MA/VWAP Lines: As dynamic support/resistance or trend indicators.
Background Color: For quick visual assessment of broader Stochastic momentum.
Setting Up Alerts: Add the indicator to your chart. Click the "Alert" button in TradingView, select this indicator under "Condition," and choose from the defined alert conditions (e.g., "Stoch TF3 Bullish Alignment"). Alert messages will indicate active filters.
6. Important Considerations / Disclaimer
This indicator provides analytical tools and potential signals; it is not a standalone trading system and does not guarantee profits.
Always use in conjunction with your trading strategy, risk management, and other analyses. Test thoroughly.
The effectiveness of filters and signals varies with market conditions and assets. Experimentation with settings is crucial.
This script is for educational/informational purposes only and is not financial advice. Trading involves substantial risk. The author, Saleh_ABO_RAED, is not responsible for any trading decisions based on this indicator.
7. Credits
The hierarchical Stochastic signal logic (S3-S5) and the initial strategic framework were inspired by the work of f56eroon (ابو بتال - خطيرون). This script, "MTF Dashboard (Stoch,MACD,RSI) & Stochastic Signals," represents an original development by Saleh_ABO_RAED, featuring the specific MTF dashboard implementation for Stochastic, MACD, and RSI, the integration of PVSRA candle coloring and a general Moving Average, advanced MA/VWAP signal filtering, background coloring, and the overall customizable script architecture.
Arabic Script Description (الوصف العربي للإسكريبت):
عنوان المؤشر: MTF Dashboard (Stoch,MACD,RSI) & Stochastic Signals
1. نظرة عامة
مؤشر "MTF Dashboard (Stoch,MACD,RSI) & Stochastic Signals" هو أداة تحليلية متقدمة ومتعددة الأوجه مصممة للتحليل الشامل للسوق. يدمج هذا المؤشر لوحة معلومات مفصلة متعددة الأطر الزمنية (MTF) لمؤشرات ستوكاستيك، الماكد (MACD)، ومؤشر القوة النسبية (RSI)، مع إشارات ستوكاستيك الهرمية التوافقية (S3, S4, S5)، وتلوين الشموع بناءً على PVSRA، ومتوسط متحرك قابل للتخصيص، وفلاتر اختيارية (MA و VWAP) للإشارات، وتلوين ديناميكي للخلفية، كل ذلك في أداة واحدة متكاملة مبرمجة بلغة Pine Script™. يهدف هذا المؤشر إلى تزويد المتداولين بمنظور أعمق للسوق من خلال دمج طبقات تحليل متعددة على الرسم البياني الحالي.
2. الأصالة والفائدة
تنبع أصالة هذا الإسكريبت من تكامله الشامل للعديد من المنهجيات التحليلية المتميزة ضمن إطار عمل متماسك وقابل للتخصيص بدرجة عالية. بينما المفهوم الأساسي لإشارات ستوكاستيك الهرمية (S3-S5) مستوحى من f56eroon (ابو بتال - خطيرون)، يمثل هذا المؤشر تطويراً أصيلاً وجوهرياً قام به Saleh_ABO_RAED. تشمل المساهمات الأصلية الرئيسية ما يلي:
التنفيذ المحدد والتخصيص الشامل للوحة معلومات MTF التي تعرض ستوكاستيك، الماكد، ومؤشر القوة النسبية عبر خمسة أطر زمنية يحددها المستخدم.
التكامل السلس لتلوين شموع PVSRA (، الحجم، )، مما يوفر طبقة تأكيد مرئية فورية للحجم.
إدراج متوسط متحرك عام قابل للتخصيص بالكامل.
خيارات التصفية المتقدمة والمستقلة باستخدام المتوسط المتحرك (MA) ومتوسط السعر المرجح بالحجم (VWAP) لإشارات ستوكاستيك S3-S5.
البنية البرمجية الشاملة التي تسمح لهذه المكونات المتنوعة بالعمل بشكل متآزر.
مبررات الدمج (Mashup Justification):
تم تصميم هذا المؤشر لتوفير رؤية متعددة الأبعاد للسوق، وهو أمر ضروري غالبًا لاتخاذ قرارات تداول قوية. من خلال الجمع بين:
تحليل MTF (لوحة المعلومات والإشارات): لفهم السياق الأوسع وتحديد الإشارات المتوافقة عبر وجهات نظر متعددة.
الزخم والاتجاه (ستوكاستيك، ماكد، RSI، المتوسط المتحرك): لقياس قوة واتجاه تحركات الأسعار.
تحليل الحجم (PVSRA): لتقييم قوة الاقتناع وراء حركة السعر.
تصفية الإشارات (MA/VWAP): لتعزيز موثوقية الإشارات المولدة.
هذا "الدمج" مبرر بفائدته في مساعدة المتداولين على تحديد إعدادات تداول ذات احتمالية أعلى من خلال التقاء هذه الإشارات التحليلية المتنوعة، كل ذلك ضمن أداة واحدة، مما يقلل من فوضى الرسم البياني ويبسط العملية التحليلية. الإسكريبت مفيد للمتداولين الذين يقدرون النهج التفصيلي متعدد الطبقات لتحليل السوق ويسعون لتأكيد الإشارات من وجهات نظر متعددة غير مترابطة.
الفائدة العملية للمتداولين:
تمكّن هذه الأداة المتداولين من:
تقييم ظروف السوق بسرعة عبر أطر زمنية متعددة ومؤشرات رئيسية.
تحديد إدخالات التداول المحتملة بناءً على إشارات ستوكاستيك الهرمية، المؤكدة بواسطة PVSRA وفلاتر MA/VWAP الاختيارية.
قياس قوة السوق والاقتناع بصريًا من خلال تلوين شموع PVSRA.
استخدام متوسط متحرك قابل للتخصيص لاتجاه الاتجاه والدعم والمقاومة الديناميكية.
اتخاذ قرارات أكثر استنارة من خلال النظر في التقاء العوامل التحليلية.
3. الميزات الرئيسية
لوحة معلومات متعددة الأطر الزمنية (ستوكاستيك، ماكد، RSI): تعرض قيم ستوكاستيك (K%, D%, الحالة)، الماكد (الخط، خط الإشارة، الحالة)، ومؤشر القوة النسبية (القيمة، المتوسط البسيط، الحالة) لما يصل إلى خمسة أطر زمنية قابلة للتخصيص (TF1 إلى TF5).
إشارات توافق ستوكاستيك الهرمية (S3, S4, S5): يتم إنشاء الإشارات بناءً على سلسلة من تأكيدات ستوكاستيك عبر الأطر TF1-TF5، مع عتبات مستوى K يحددها المستخدم للتقاطعات الأولية والتأكيدات اللاحقة.
تلوين شموع PVSRA: يدمج منطق PVSRA لتلوين الشموع بناءً على تحليل الحجم وحركة السعر (مثل شموع حجم صاعد/هابط 200%، حجم 150%، حجم عادي). خيار لتجاوز الرمز الحالي لحساب PVSRA.
متوسط متحرك قابل للتخصيص (MA): يرسم متوسطًا متحركًا (SMA أو EMA) يمكن للمستخدم اختياره مع طول ومصدر ولون وعرض قابل للتكوين.
فلتران اختياريان مستقلان للإشارات (لإشارات S3-S5):
فلتر MA: قم اختياريًا بتصفية إشارات S3-S5 باستخدام متوسط متحرك منفصل قابل للتكوين (SMA, EMA, WMA).
فلتر VWAP: قم اختياريًا بتصفية إشارات S3-S5 باستخدام VWAP مع خيارات إرساء متقدمة.
تلوين خلفية قابل للتخصيص: يقوم اختياريًا بتلوين خلفية الرسم البياني عندما تكون مؤشرات ستوكاستيك على الأطر TF3، TF4، و TF5 جميعها في توافق صاعد أو هابط.
تخصيص واسع النطاق: قم بتكوين جميع الأطر الزمنية، وجميع معلمات المؤشرات (ستوكاستيك، ماكد، RSI، ألوان PVSRA، إعدادات MA، إعدادات VWAP)، ومستويات تأكيد K للإشارات، ومظهر الجدول، وشروط التنبيه.
التنبيهات: يُعرّف المؤشر العديد من شروط التنبيه لتوافق إشارات S3 و S4 و S5 الصاعدة/الهابطة، مع إشارة رسائل التنبيه إلى الفلاتر النشطة.
4. كيف يعمل المؤشر
بيانات MTF ولوحة المعلومات: يقوم الإسكريبت بجلب وحساب بيانات ستوكاستيك، الماكد، و RSI لكل من الأطر الزمنية الخمسة التي يحددها المستخدم باستخدام request.security مع barmerge.lookahead_on لمنع تسرب البيانات المستقبلية. تملأ هذه البيانات الجدول على الرسم البياني.
تلوين شموع PVSRA: يحلل حجم كل شمعة ونطاق سعرها مقابل المتوسطات التاريخية (مثل متوسط متحرك بسيط لـ10 فترات للحجم) لتحديد الشموع ذات الحجم المرتفع بشكل كبير (مثل >=150% أو >=200% من المتوسط) أو "value2" مرتفعة (الحجم * النطاق)، وتلوينها وفقًا لذلك للدلالة على ضغط شراء أو بيع قوي.
توليد إشارات ستوكاستيك (S3-S5):
يعمل تقاطع ستوكاستيك أولي على TF1 (يمكن تصفيته اختياريًا بمستوى K) كمُشغِّل.
يتم بعد ذلك تأكيد هذا التقاطع بالتتابع بواسطة شروط ستوكاستيك متوافقة (K فوق/تحت D، و K فوق/تحت مستويات التأكيد المحددة من المستخدم) على TF2، ثم TF3 (لإشارة S3)، ثم TF4 (لـ S4)، وأخيرًا TF5 (لـ S5).
تصفية الإشارات بـ MA و VWAP: في حالة التمكين، لا يتم رسم إشارات S3-S5 المولدة (ولا تُطلق تنبيهات) إلا إذا كان السعر يستوفي أيضًا الشرط المتعلق بالمتوسط المتحرك المختار (مثال: السعر > MA للشراء) و/أو VWAP. يمكن رسم خطوط MA و VWAP بشكل مستقل.
تلوين الخلفية: بناءً على إجماع حالات ستوكاستيك (صاعدة/هابطة) على الأطر TF3، TF4، و TF5.
5. كيفية الاستخدام
تكوين الأطر الزمنية والمؤشرات الأساسية: قم بإعداد مستويات MTF المطلوبة (TF1-TF5) ومعلمات ستوكاستيك، الماكد، و RSI عبر مربع حوار "الإعدادات/المدخلات" الخاص بالإسكريبت.
تكوين PVSRA و MA العام: قم بتمكين/تعطيل تلوين شموع PVSRA ورسم المتوسط المتحرك العام؛ اضبط معلمات كل منهما (الألوان، الأطوال، الأنواع).
ضبط معلمات إشارة ستوكاستيك:
عدّل عتبات مستوى K لتقاطعات ستوكاستيك TF1 (اضبط على 0 للصاعد/100 للهابط لتعطيل فلتر دخول مستوى K).
قم بتكوين عتبات تأكيد مستوى K لـ TF2-TF5.
تكوين فلاتر MA/VWAP الاختيارية للإشارات: قم بتمكين الرسم و/أو تصفية الإشارات بشكل مستقل لـ MA و/أو VWAP؛ اختر أنواعها وأطوالها وفترات الإرساء.
التفسير:
لوحة المعلومات: للحصول على نظرة عامة على ظروف السوق.
شموع PVSRA: لقياس قوة الاقتناع وراء تحركات الأسعار.
إشارات S3-S5: كمؤشرات محتملة لتوافق ستوكاستيك متعدد الأطر يزداد قوة. كلما زاد عدد الفلاتر التي تجتازها الإشارة (MA, VWAP)، كلما أمكن اعتبارها أكثر قوة.
خطوط MA/VWAP: كدعم/مقاومة ديناميكية أو مؤشرات اتجاه.
لون الخلفية: لتقييم بصري سريع لزخم ستوكاستيك الأوسع.
إعداد التنبيهات: أضف المؤشر إلى الرسم البياني. انقر فوق زر "تنبيه" في TradingView، واختر هذا المؤشر ضمن "الشرط"، ثم اختر من شروط التنبيه المحددة (مثل "Stoch TF3 Bullish Alignment"). ستشير رسائل التنبيه إلى الفلاتر النشطة.
6. اعتبارات هامة / إخلاء مسؤولية
يوفر هذا المؤشر أدوات تحليلية وإشارات محتملة؛ إنه ليس نظام تداول قائم بذاته ولا يضمن الأرباح.
استخدمه دائمًا بالاقتران مع استراتيجية التداول الخاصة بك، إدارة المخاطر، والتحليلات الأخرى. اختبره جيدًا.
تختلف فعالية الفلاتر والإشارات باختلاف ظروف السوق والأصول. التجربة مع الإعدادات أمر بالغ الأهمية.
هذا الإسكريبت مخصص للأغراض التعليمية/المعلوماتية فقط وليس نصيحة مالية. ينطوي التداول على مخاطر كبيرة. المؤلف، Saleh_ABO_RAED، غير مسؤول عن أي قرارات تداول بناءً على هذا المؤشر.
7. الحقوق والتقدير
منطق إشارات ستوكاستيك الهرمية (S3-S5) والإطار الاستراتيجي الأولي مستوحيان من عمل f56eroon (ابو بتال - خطيرون). هذا الإسكريبت، "MTF Dashboard (Stoch,MACD,RSI) & Stochastic Signals"، يمثل تطويراً أصيلاً قام به Saleh_ABO_RAED، ويتميز بالتنفيذ المحدد للوحة معلومات MTF لمؤشرات ستوكاستيك، الماكد، و RSI، ودمج تلوين شموع PVSRA والمتوسط المتحرك العام، والتصفية المتقدمة للإشارات باستخدام MA/VWAP، وتلوين الخلفية، والبنية البرمجية الشاملة القابلة للتخصيص.
Intraday Trading Hit and Run# Strategy Overview
This is a short-term trading system designed for quick entries/exits (intraday). It uses multiple technical indicators to identify momentum trades in the direction of the trend, with built-in risk management through trailing stops.
# Main Components
1. Trend Filter
Uses two EMAs (10-period "fast" blue line and 100-period "slow" red line)
Only trades when:
Long: Price AND fast EMA are above slow EMA
Short: Price AND fast EMA are below slow EMA
2. Main Signal
////Stochastic Oscillator (14-period):
Buy when %K line crosses above %D line
Sell when %K crosses below %D
////Trend Strength Check
Smoothed ADX indicator (5-period EMA of ADX):
Requires ADX value ≥ 25 to confirm strong trend
3. Confirmation using Volume Filter (Optional)
Checks if current volume is 1.5× greater than 20-period average volume
# Entry Rules
A trade is only taken when:
All 3 indicators agree (EMA trend, Stochastic momentum, ADX strength)
Volume filter is satisfied (if enabled)
# Exit Rules
1. Emergency Exit:
Close long if price drops below fast EMA
Close short if price rises above fast EMA
2. Trailing Stop:
Actively protects profits by moving stop-loss:
Maintains 0.1% distance from highest price (longs) or lowest price (shorts)
# Risk Management
Only use 10% of account per trade
Includes 0.04% commission cost in calculations
All trades monitored with trailing stops
# How It Operates
The strategy looks for strong, high-volume momentum moves in the direction of the established trend (as determined by EMAs). It jumps in quickly ("hit") when conditions align, then protects gains with an automatic trailing stop ("run"). Designed for fast markets where trends develop rapidly.
You can use it on 15m, 1h or 4h

Gap Reversal Signal with Indicators🔍 Gap Reversal Signal with Indicators — 結合 KD、MACD、SAR 與背離分析的多功能指標
🔍 Gap Reversal Signal with Indicators — A Multi-Tool Signal Indicator Combining KD, MACD, SAR, and Divergence Analysis
中文說明:
本指標結合多種常用技術分析工具,包括 KD 隨機指標、MACD 動能交叉、SAR 趨勢方向、以及 MACD 背離偵測,用以辨識潛在的價格反轉區域。適用於日內交易與波段操作,支援各類市場,如加密貨幣、股票與外匯等。
English Description:
This indicator combines several popular technical tools: Stochastic KD, MACD momentum crossovers, SAR trend direction, and MACD divergence detection. It helps traders identify potential reversal areas and is ideal for both intraday and swing trading. Works well on crypto, stocks, and forex markets.
🧠 功能特點 | Key Features
✅ KD指標(慢速隨機指標)檢測超買超賣並提供%K與%D交叉訊號
✅ Stochastic KD (slow) to detect overbought/oversold zones and crossover signals
✅ MACD金叉/死叉與零軸突破捕捉趨勢轉變與動能反轉
✅ MACD Crossovers + Zero-Line Breaks to capture trend changes and momentum reversals
✅ SAR指標即時顯示多空方向
✅ Parabolic SAR for real-time trend direction indication
✅ MACD背離偵測協助辨識潛在反轉區域
✅ MACD Divergence Detection for identifying hidden trend reversals
✅ 圖形提示與標籤提示可視化呈現各類訊號
✅ Visual Alerts and Labels for easy and quick signal recognition
📈 支援市場 | Supported Markets
📊 台股 / 美股 / 外匯 / 加密貨幣
📊 Taiwan Stocks / US Stocks / Forex / Cryptocurrencies (e.g. BTC, ETH)
🔧 推薦用法 | Recommended Use
搭配缺口策略與支撐壓力位使用
Use with gap-trading strategies and support/resistance zones
用於盤整末期或趨勢反轉的提示
Helpful for end-of-consolidation signals or trend reversals
支援短線與波段交易風格
Suitable for scalping and swing trading styles
💡 把這個指標加入你的圖表,立即體驗多重技術分析所帶來的交易優勢!
💡 Add this indicator to your chart now and experience the power of multi-tool technical analysis!

Stochastic RainbowThe Stochastic Rainbow indicator is a multi-layered momentum oscillator designed to provide a comprehensive view of market dynamics by combining multiple stochastic oscillators of varying periods. This approach allows traders to analyze both short-term and long-term momentum within a single visual framework, enhancing decision-making for entries and exits.
🔧 Indicator Settings and Customization
Select from various moving average methods (e.g., SMA, EMA, DEMA, TEMA, WMA, VWMA, RMA, T3) to smooth the stochastic lines. Different methods can affect the responsiveness of the indicator.
The indicator computes five sets of stochastic oscillators with Fibonacci values.
Each %K line is smoothed using the selected moving average type, and a corresponding %D line is plotted for each %K.
🎨 Visual Interpretation
The Stochastic Rainbow indicator plots multiple %K and %D lines, each with distinct colors for easy differentiation.
Additionally, horizontal dotted lines are drawn at levels 80 (Upper Band), 50 (Midline), and 20 (Lower Band) to indicate overbought, neutral, and oversold conditions, respectively.
📈 Trading Strategies Using Stochastic Rainbow
The multi-layered structure of the Stochastic Rainbow allows for nuanced analysis.
Trend Confirmation:
When all %K lines are above 50 and aligned in ascending order (short-term above long-term), it suggests a strong uptrend.
Conversely, when all %K lines are below 50 and aligned in descending order, it indicates a strong downtrend.
Overbought/Oversold Conditions:
If the shorter-term %K lines (e.g., %K 5,3 and %K 8,3) enter the overbought zone (>80) while longer-term lines remain below, it may signal a potential reversal.
Similarly, if shorter-term lines enter the oversold zone (<20) while longer-term lines remain above, it could indicate an upcoming bullish reversal.
Crossovers:
A bullish signal occurs when a %K line crosses above its corresponding %D line.
A bearish signal occurs when a %K line crosses below its corresponding %D line.
Divergence Analysis:
If price makes a new high while the %K lines do not, it may indicate bearish divergence and a potential reversal.
If price makes a new low while the %K lines do not, it may indicate bullish divergence and a potential reversal.
⚙️ Adjusting Settings for Optimal Use
The Stochastic Rainbow's flexibility allows traders to adjust settings to match their trading style and the specific asset's behavior:
Short-Term Trading: Use shorter periods (e.g., 5 for %K) and more responsive moving averages (e.g., WMA, VWMA, EMA, DEMA, TEMA, HMA) to capture quick market movements.
Long-Term Trading: Opt for longer periods (e.g., 55 for %K) and smoother moving averages (e.g., SMA, RMA, T3) to filter out noise and focus on broader trends.
Volatile Markets: Consider using the T3 moving average for its smoothing capabilities, helping to reduce false signals in choppy markets.
By experimenting with different settings, traders can fine-tune the indicator to better suit their analysis and improve decision-making.

AP IFTCCIv2/IFTStoch/IFTRSI Multi-TimeframeMulti-Timeframe IFT-CCI/Stoch/RSI Composite
This enhanced indicator combines three powerful oscillators—Inverse Fisher Transform (IFT) versions of the Commodity Channel Index (CCI), Stochastic, and Relative Strength Index (RSI)—into a unified multi-timeframe analysis tool. Originally developed by John Ehlers (pioneer of cyclical analysis and signal processing in trading systems) and adapted by KIVANC (@fr3762), this version adds dual-timeframe capability to compare indicator values across different chart resolutions.
Key Features:
Triple Oscillator Composite
IFT-CCI: Smoothed CCI values transformed via Ehlers' Inverse Fisher Transform (blue-gold)
IFT-Stochastic: Classic stochastic oscillator processed through IFT (blue)
IFT-RSI: RSI oscillator converted to IFT format (magenta)
Composite Average Line: Combined average of all three indicators (green)
Multi-Timeframe Analysis
Compare primary and secondary timeframes (e.g., 1H vs. 4H, daily vs. weekly)
Primary timeframe plots use solid lines with 80% opacity
Secondary timeframe (optional) uses dashed/circle markers with 40% opacity
Key Levels
Overbought (+0.75) and oversold (-0.75) reference lines
Zero-centerline for momentum direction bias
Applications:
Trend Confirmation: Align higher timeframe signals with lower timeframe entries
Divergence Detection: Spot inter-timeframe discrepancies in momentum
Regime Filter: Use higher timeframe composite values to filter trades
Technical Basis:
Inverse Fisher Transform: Compresses oscillator values into bounded (-1 to +1) range while emphasizing extreme moves
Dual WMA Smoothing: Combines initial calculation smoothing (WMA1) with final output smoothing (WMA2)
Exponential Scaling: (e^2x - 1)/(e^2x + 1) formula converts Gaussian-like distributions to bounded outputs
Credits:
Original Concept: John Ehlers (IFT methodology, cyclical analysis foundations)
Initial Implementation: KIVANC (@fr3762 on Twitter) for the base IFT-CCI/Stoch/RSI script
Multi-Timeframe Adaptation: for cross-resolution analysis capabilities
This tool is particularly effective for traders seeking to align multiple timeframes while using Ehlers' noise-reduction techniques. The composite average line provides a consensus view, while the individual oscillators help identify component strength/weakness.

Stochastics + VixFix Buy/Sell SignalsThis script is designed for long-term investors using ETFs on a weekly timeframe, where catching high-probability bottoms is the goal. It combines the Stochastic Oscillator with the Williams VixFix to identify moments of extreme fear and potential reversals.
A Buy signal is triggered when:
Stochastic %K drops below 20
VixFix forms a green spike (suggesting a panic-driven market flush)
A Sell signal is triggered when:
Stochastic %K rises above 90
VixFix falls below 5 (indicating excessive complacency)
Catching tops is much harder than catching bottoms.
These Sell signals are not designed to fully exit positions. Instead, they suggest trimming a small portion of ETF holdings — simply to free up liquidity for future opportunities.
This strategy is ideal for:
Long-term ETF investors
Weekly charts
Systematic decision-making in volatile markets
Use in conjunction with macro indicators, sector rotation, and valuation frameworks for best results.

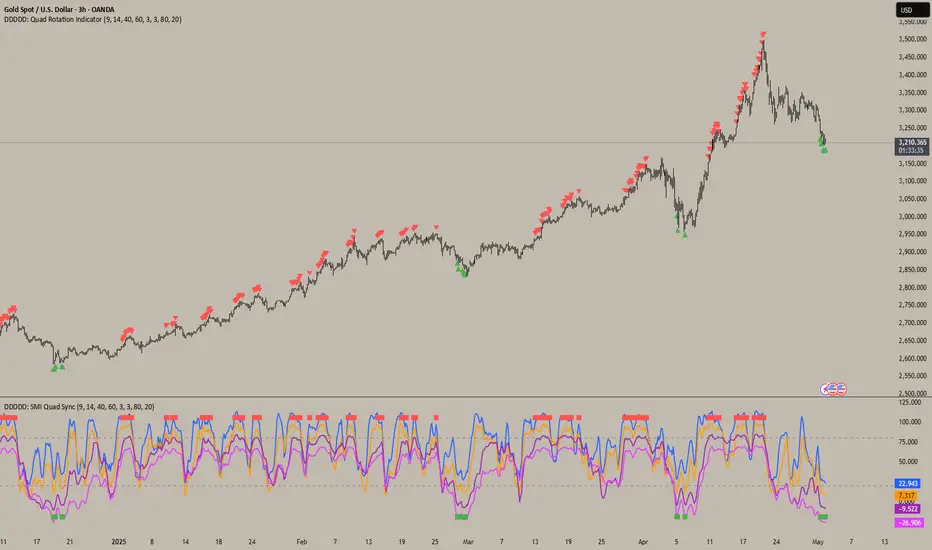
DDDDD: SMI Quad Sync📄DDDDD: SMI Quad Sync
A multi-timeframe momentum synchronization indicator using 4 Stochastic Oscillators with different lengths (9, 14, 40, 60) to detect collective oversold and overbought zones.
✅ Key Features:
Plots 4 stochastic lines with vertical offsets for better visual separation.
Generates a Long Signal (green square) when all 4 stochastics are below the oversold level.
Generates a Short Signal (red square) when all 4 stochastics are above the overbought level.
Use signals to confirm multi-timeframe momentum alignment or exhaustion.
🎯 How to Use:
Look for green square → potential LONG entry: signals multi-timeframe oversold condition.
Look for red square → potential SHORT entry: signals multi-timeframe overbought condition.
Combine with trend analysis, price action, or other confirmation for optimal entries.
📝 Notes:
The plotted stochastic lines are visually shifted (offset) for clarity; signals are computed from raw, unshifted values.
Designed for traders who prefer confluence across different stochastic lookback periods to improve confidence.
👉 Ideal for scalping, swing trading, or as a momentum filter in broader strategies.
Stochastic w/ Crossovers and Deadspace FilterThis is my extremely useful modification of the classic Stochastic indicator. It includes clear signals of crossovers and crossunders of the K/D lines.
Additionally, I added a "deadspace" filter to remove plotting of signals in the middle of the range, which tend to be misleading.
This can be incredibly useful to find entries and trends, especially when using 2 instances of this indicator at different lengths (such as one of 14,1,3 and another of 28,3,6).
The deadspace filter works based on the middle line, so a value of 20 will not plot any crossovers between 30-70.
Quad Rotation StochasticQuad Rotation Stochastic
The Quad Rotation Stochastic is a powerful and unique momentum oscillator that combines four different stochastic setups into one tool, providing an incredibly detailed view of market conditions. This multi-timeframe stochastic approach helps traders better anticipate trend continuations, reversals, and momentum shifts with greater precision than traditional single stochastic indicators.
Why this indicator is useful:
Multi-layered Momentum Analysis: Instead of relying on one stochastic, this script tracks four independent stochastic readings, smoothing out noise and confirming stronger signals.
Advanced Divergence Detection: It automatically identifies bullish and bearish divergences for each stochastic, helping traders spot potential reversals early.
Background Color Alerts: When a configurable number (e.g., 3 or 4) of the stochastics agree in direction and position (overbought/oversold), the background colors green (bullish) or red (bearish) to give instant visual cues.
ABCD Pattern Recognition: The script recognizes "shield" patterns when Stochastic 4 remains stuck at extreme levels (above 90 or below 10) for a set time, warning of potential trend continuation setups.
Super Signal Alerts: If all four stochastics align in extreme conditions and slope in the same direction, the indicator plots a special "Super Signal," offering high-confidence entry opportunities.
Why this indicator is unique:
Quad Confirmation Logic: Combining four different stochastics makes this tool much less prone to false signals compared to using a single stochastic.
Customizable Divergence Coloring: Traders can choose to have divergence lines automatically match the stochastic color for clear visual association.
Adaptive ABCD Shields: Innovative use of bar counting while a stochastic remains extreme acts as a "shield," offering a unique way to filter out minor fake-outs.
Flexible Configuration: Each stochastic's sensitivity, divergence settings, and visual styling can be fully customized, allowing traders to adapt it to their own strategy and asset.
Example Usage: Trading Bitcoin with Quad Rotation Stochastic
When trading Bitcoin (BTCUSD), you might set the minimum count (minCount) to 3, meaning three out of four stochastics must be in agreement to trigger a background color.
If the background turns green, and you notice an ABCD Bullish Shield (Green X), you might look for bullish candlestick patterns or moving average crossovers to enter a long trade.
Conversely, if the background turns red and a Super Down Signal appears, it suggests high probability for further downside, giving you strong confirmation to either short BTC or avoid entering new longs.
By combining divergence signals with background colors and the ABCD shields, the Quad Rotation Stochastic provides a layered confirmation system that gives traders greater confidence in their entries and exits — particularly in fast-moving, volatile markets like Bitcoin.

Stochastic and RSI2 entriesStochastic and RSI2 entries, v1.0
This indicator combines Stochastic and RSI to facilitate "RSI2" entry signals. Buy signals will be shown at the bottom.
The default configuration uses non-standard settings for the underlying indicators to tailor it for this type of entry strategy.
This is an entry strategy that tries to find entries close to "the dip".
A combination of Stochastic crossovers, VWAP, daily SMA50 and daily SMA200 are used to verify buy signals.
This indicator is written for bullish signals and aims to find the start of short trends or cheap entries for longer positions.
Like with any strategy, some signals will be false, and the user is advised to do some own research before using the buy signals for actual entries.
Happy trading!

Oath KeeperOath Keeper - Advanced Money Flow & Market Dynamics Indicator
A sophisticated indicator that analyzes market dynamics through money flow patterns, volume analysis, and liquidation detection to identify high-probability trading opportunities.
Core Features:
• Smart Money Flow Analysis: Proprietary calculation of institutional money movement
• Volume-Enhanced Signals: Multi-timeframe volume confirmation
• Liquidation Detection: Identifies potential forced liquidation events
• Advanced Signal Classification: Regular, Super, and Fakeout signals
Signal Types:
1. Regular Signals (Green/Purple Circles)
• Volume-confirmed momentum shifts
• Money flow threshold breaches
• Institutional participation confirmation
2. Super Signals (Green/Purple Squares)
• Deep oversold/overbought reversals
• High-volume rejection patterns
• Liquidation event confirmation
3. Fakeout Signals (Red X)
• Rapid sentiment shifts
• Trap detection
• False breakout warnings
Visual Components:
• Dynamic Money Flow Line (White/Purple)
• Order Flow Clouds (Green/Red with high transparency)
• Reference Levels (20, 50, 80)
• Multi-type Signal Markers
• Color-coded momentum visualization
Interpretation Guide:
• Green Cloud: Bullish money flow dominance
• Red Cloud: Bearish money flow dominance
• Circle Markers: Standard reversals
• Square Markers: High-conviction moves
• X Markers: Potential trap zones
Best Practices:
• Most effective on 1H+ timeframes
• Use with major trading pairs
• Wait for candle close confirmation
• Combine with support/resistance levels
• Monitor volume confirmation
• Use multiple timeframe analysis
This indicator helps traders identify institutional money flow, potential liquidation events, and market reversals by analyzing volume patterns and money flow dynamics, providing multiple confirmation layers for trade decisions.
Note: Performance varies with market conditions and timeframes. Always employ proper risk management.

RSI+Stoch Band Oscillator📈 RSI + Stochastic Band Oscillator
Overview:
The RSI + Stochastic Band Oscillator is a technical indicator that combines the strengths of both the Relative Strength Index (RSI) and the Stochastic Oscillator. Instead of using static thresholds, this indicator dynamically constructs upper and lower bands based on the RSI and Stochastic overbought/oversold zones. It then measures the relative position of the current price within this adaptive range, effectively producing a normalized oscillator.
Key Components:
RSI-Based Dynamic Bands:
Using RSI values and exponential moving averages of price changes, upper and lower dynamic bands are constructed.
These bands adjust based on overbought and oversold levels, offering a more responsive framework than fixed RSI thresholds.
Stochastic-Based Dynamic Bands:
Similarly, Stochastic %K and %D values are used to construct dynamic bands.
These adapt to overbought and oversold levels by recalculating potential high/low values within the lookback window.
Oscillator Calculation:
The oscillator (osc) is computed as the relative position of the current close within the combined upper and lower bands of both RSI and Stochastic.
This value is normalized between 0 and 100, allowing clear identification of extreme conditions.
Visual Features:
The oscillator is plotted as a line between 0 and 100.
Color-filled areas highlight when the oscillator enters extreme zones:
Above 100 with falling momentum: Red zone (potential reversal).
Below 0 with rising momentum: Green zone (potential reversal).
Additional trend conditions (falling/rising RSI, %K, and %D) are used to strengthen reversal signals by confirming momentum shifts.

Stochastic with 4 %K LinesQuad Rotation Stochastic Strategy – Indicator Description
The Quad Rotation Strategy is a momentum-based technical analysis tool that overlays four distinct Stochastic %K lines on a single chart. Each line is calculated using a unique set of parameters, allowing traders to visualize and compare momentum signals across varying sensitivities — from fast-reacting setups to slower, trend-confirming ones.
This multi-speed stochastic view is designed to help traders:
Identify rotation points where shorter-term stochastic lines cross faster than longer-term lines, signaling early reversals or trend continuation.
Confirm strength or weakness in price action by observing alignment or divergence among the %K lines.
Fine-tune entries and exits by using fast %K lines for timing and slower ones for confirmation.
🔍 How It Works:
Four separate %K lines are plotted, each with configurable Length and Smoothing.
All lines are calculated using the standard Stochastic formula:
(%K = SMA of (Close - Low) / (High - Low) over period)
No %D lines are included to keep the focus on %K behavior across different speeds.
Standard overbought (80), oversold (20), and midline (50) levels are provided for context.
This indicator is best used in:
Trend continuation setups where faster stochastics pull back to oversold while slower ones remain bullish.
Reversal zones where all four %K lines converge or cross in extreme levels.
Range-bound environments where confluence of extremes offers swing trade opportunities.

Stochastic Overlay - Regression Channel (Zeiierman)█ Overview
The Stochastic Overlay – Regression Channel (Zeiierman) is a next-generation visualization tool that transforms the traditional Stochastic Oscillator into a dynamic price-based overlay.
Instead of leaving momentum trapped in a lower subwindow, this indicator projects the Stochastic oscialltor directly onto price itself — allowing traders to visually interpret momentum, overbought/oversold conditions, and market strength without ever taking their eyes off price action.
⚪ In simple terms:
▸ The Bands = The Stochastic Oscillator — but on price.
▸ The Midline = Stochastic 50 level
▸ Upper Band = Stochastic Overbought Threshold
▸ Lower Band = Stochastic Oversold Threshold
When the price moves above the midline → it’s the same as the oscillator moving above 50
When the price breaks above the upper band → it’s the same as Stochastic entering overbought.
When the price reaches the lower band →, think of it like Stochastic being oversold.
This makes market conditions visually intuitive. You’re literally watching the oscillator live on the price chart.
█ How It Works
The indicator layers 3 distinct technical elements into one clean view:
⚪ Stochastic Momentum Engine
Tracks overbought/oversold conditions and directional strength using:
%K Line → Momentum of price
%D Line → Smoothing filter of %K
Overbought/Oversold Bands → Highlight potential reversal zones
⚪ Volatility Adaptive Bands
Dynamic bands plotted above and below price using:
ATR * Stochastic Scaling → Creates wider bands during volatile periods & tighter bands in calm conditions
Basis → Moving average centerline (EMA, SMA, WMA, HMA, RMA selectable)
This means:
→ In strong trends: Bands expand
→ In consolidations: Bands contract
⚪ Regression Channel
Projects trend direction with different models:
Logarithmic → Captures non-linear growth (perfect for crypto or exponential stocks)
Linear → Classic regression fit
Adaptive → Dynamically adjusts sensitivity
Leading → Projects trend further ahead (aggressive mode)
Channels include:
Midline → Fair value trend
Upper/Lower Bounds → Deviation-based support/resistance
⚪ Heatmap - Bull & Bear Power Strength
Visual heatmeter showing:
% dominance of bulls vs bears (based on close > or < Band Basis)
Automatic normalization regardless of timeframe
Table display on-chart for quick visual insight
Dynamic highlighting when extreme levels are reached
⚪ Trend Candlestick Coloring
Bars auto-color based on trend filter:
Above Basis → Bullish Color
Below Basis → Bearish Color
█ How to Use
⚪ Trend Trading
→ Use Band direction + Regression Channel to identify trend alignment
→ Longs favored when price holds above the Basis
→ Shorts favored when price stays below the Basis
→ Use the Bull & Bear heatmap to asses if the bulls or the bears are in control.
⚪ Mean Reversion
→ Look for price to interact with Upper or Lower Band extremes
→ Stochastic reaching OB/OS zones further supports reversals
⚪ Momentum Confirmation
→ Crossovers between %K and %D can confirm continuation or divergence signals
→ Especially powerful when happening at band boundaries
⚪ Strength Heatmap
→ Quickly visualize current buyer vs seller control
→ Sharp spikes in Bull Power = Aggressive buying
→ Sharp spikes in Bear Power = Heavy selling pressure
█ Why It Useful
This is not a typical Stochastic or regression tool. The tool is designed for traders who want to:
React dynamically to price volatility
Map momentum into volatility context
Use adaptive regression channels across trend styles
Visualize bull vs bear power in real-time
Follow trends with built-in reversal logic
█ Settings
Stochastic Settings
Stochastic Length → Period of calculation. Higher = smoother, Lower = faster signals.
%K Smoothing → Smooths the Stochastic line itself.
%D Smoothing → Smooths the moving average of %K for slower signals.
Stochastic Band
Band Length → Length of the Moving Average Basis.
Volatility Multiplier → Controls band width via ATR scaling.
Band Type → Choose MA type (EMA, SMA, WMA, HMA, RMA).
Regression Channel
Regression Type → Logarithmic / Linear / Adaptive / Leading.
Regression Length → Number of bars for regression calculation.
Heatmap Settings
Heatmap Length → Number of bars to calculate bull/bear dominance.
-----------------
Disclaimer
The content provided in my scripts, indicators, ideas, algorithms, and systems is for educational and informational purposes only. It does not constitute financial advice, investment recommendations, or a solicitation to buy or sell any financial instruments. I will not accept liability for any loss or damage, including without limitation any loss of profit, which may arise directly or indirectly from the use of or reliance on such information.
All investments involve risk, and the past performance of a security, industry, sector, market, financial product, trading strategy, backtest, or individual's trading does not guarantee future results or returns. Investors are fully responsible for any investment decisions they make. Such decisions should be based solely on an evaluation of their financial circumstances, investment objectives, risk tolerance, and liquidity needs.
