Indicator

Technical Strength Gauge [HexaTrades]Most traders watch a handful of indicators and weigh them by gut feel. Technical Strength Meter does this objectively and at scale: It evaluates 74 indicator votes across 34 technical indicator families, turns each into a single Buy / Neutral / Sell vote, and aggregates those votes into three colour-graded strength gauges, each scored 0-100: Leading, Lagging, and an overall Summary. On top sits an analytics row that translates the raw votes into market context: regime, trend strength, volatility, confidence, probability and an A+ to D quality grade.
HOW IT WORKS - THE VOTING ENGINE
Each indicator votes : All 74 indicators are evaluated, and each casts exactly one vote:
+1 Buy (its bullish condition is met)
0 Neutral (no clear signal)
-1 Sell (its bearish condition is met)
The voting rule is matched to the indicator's nature:
• Oscillators vote by mean reversion, e.g. RSI must be below the oversold level AND turning back up to vote Buy; above the overbought level AND turning down to vote Sell; otherwise Neutral. The same "stretched, then turning" logic drives Stochastic, CCI, Williams %R, MFI, Ultimate, Stochastic RSI, TSI, Fisher and CMO.
• Moving averages vote by price location: close above the MA = Buy, below = Sell. This repeats for 10 MA families across 5 lengths (50 votes in total).
• Trend tools vote on their own state: Supertrend direction, price vs the Ichimoku cloud, +DI vs -DI, Parabolic SAR side, Linear-Regression slope, Vortex, and so on.
Votes are grouped & averaged : The votes split into a Leading set (early movers) and a Lagging set (trend confirmers). Each set is averaged into one number from -1 to +1, and the Summary is the average of the two halves.
Weighting & exclusions: By default every vote counts equally, but each gauge is a weighted average: you can scale whole categories (Oscillators / MAs / Trend) up or down, or switch any indicator off. A disabled indicator (weight 0) is dropped from both the average and the counts; it is NOT silently counted as Neutral. On symbols with no volume data, volume-based votes (VWMA, MFI) are auto-excluded the same way, so they don't dilute the score.
Score & verdict : Each -1…+1 average is rescaled to a 0-100 score and mapped to a five-step verdict:
0-25 Strong Sell · 25-45 Sell · 45-55 Neutral · 55-75 Buy · 75-100 Strong Buy
(Internally: rating <= -0.5 = Strong Sell, <= -0.1 = Sell, between = Neutral, >= 0.1 = Buy, >= 0.5 = Strong Buy.)
⭐️THREE GAUGES
• LEADING (16 indicators) momentum / early-mover tools that tend to turn before price: RSI, Stochastic, CCI, Williams %R, MFI, ROC, Momentum, Ultimate Oscillator, Awesome Oscillator, Stochastic RSI, TSI, Fisher Transform, CMO, plus Bollinger, Donchian and Aroon.
• LAGGING (58 indicators): trend-followers that confirm an established move: MACD histogram, 50 moving-average votes (10 MA types EMA, SMA, VWMA, WMA, HMA, RMA, ALMA, DEMA, TEMA, KAMA across 5 lengths), and Supertrend, ADX, Ichimoku, Parabolic SAR, Linear Regression, Vortex and DMI.
• SUMMARY: the balance of the Leading and Lagging halves; your one-number bias.
When the two halves agree, conviction is high; when Leading leads Lagging, a turn may be forming.
⭐️ANALYTICS ROW
• MARKET REGIME : Strong Bull / Bull / Sideways / Bear / Strong Bear. Combines five trend engines (Supertrend, Ichimoku, DMI, stacked-MA alignment, LinReg slope) into a directional bias, then gates it with ADX: low ADX = Sideways; high ADX + strong bias = a "Strong" trend.
• TREND STRENGTH % : how strong and aligned the trend is, blending the size of that directional bias with ADX magnitude.
• VOLATILITY : Low / Normal / High / Extreme, from the percentile rank of Bollinger Band width over the last 100 bars (so it adapts to each symbol).
• CONFIDENCE % : how trustworthy the current reading is: a blend of decisiveness (how far Summary is from neutral), Leading–Lagging agreement, and vote consistency.
• BULL / BEAR PROBABILITY % : the weighted balance of all votes, always summing to 100.
• SIGNAL-QUALITY GRADE : A+ to D, a composite of Confidence, Trend Strength and favourable volatility, for a quick "is this a clean setup?" read.
⭐️ SETTINGS GUIDE
Layout : anchor position, total width, summary size, height, compact mode, per-gauge show/hide, the five MA lengths, and toggles for the analytics row and breakdown table.
Signals & timeframe: analysis timeframe (MTF), confirm-on-close, Strong and normal Buy/Sell arrows, the signal trigger levels, the ADX whipsaw filter, background tint and the volatility alert.
Indicator periods : lengths for RSI, Stochastic, CCI, MFI, Williams %R, ROC, Momentum, ADX/DMI, Bollinger and MACD.
Overbought / Oversold: the OB/OS thresholds for RSI, Stochastic, MFI, Ultimate Oscillator, CCI and Williams %R.
Analytics thresholds: the ADX bands for regime and the percentile bands for volatility.
Weights & toggles: category weights (Oscillators / MAs / Trend) and an on/off switch for all 34 named indicators.
Colors: the full Strong-Sell to Strong-Buy palette and table colours.
Signals are calculated using closed-bar data when "Confirm on Close" is enabled. The indicator does not intentionally use future data or repaint historical signals.
⭐️How to use
Context first: read Market Regime and Volatility. "Strong" regimes favour trend-following; "Sideways" favours mean-reversion or standing aside; "Extreme" volatility means wider stops and more false breaks.
Bias: read the Summary gauge and its 0–100 score: your single-number lean.
Alignment:compare Leading vs Lagging. Both same side = confirmed conviction; Leading
ahead of Lagging = possible early turn; disagreement = mixed/choppy, so smaller size or wait.
Quality: check Confidence % and the A+…D Grade. An A-grade Strong Buy in a Strong Bull regime ≠ a borderline Buy in chop.
Execute: use the Buy/Sell arrows as visual triggers, or attach the built-in alerts.
Make it yours: shorter periods/lower triggers for scalping, longer/higher for swing; re-weight or disable indicators you don't trust; set an Analysis timeframe to read a higher TF from a lower chart.
⭐️ BEST USE CASES
Best suited for:
• Trend confirmation and trend-following strategies
• Market regime analysis (Bull, Bear, Sideways)
• Multi-indicator consensus and bias assessment
• Swing trading and position trading
• Day trading and intraday market analysis
• Higher-timeframe directional bias and confirmation
• Identifying alignment between momentum and trend indicators
Not designed for:
• Standalone trade entries without additional analysis
• Predicting exact tops, bottoms, or reversals
• Guaranteed market forecasts or future price predictions
• Fully automated trading systems without validation
• Replacing risk management, position sizing, or trading plans
Technical Strength Meter combines the signals of 74 widely used technical indicators into a single, transparent decision-support framework. By separating indicators into Leading and Lagging categories, the indicator helps traders identify potential turning points, confirm established trends, and understand the overall market bias at a glance. Rather than relying on a single indicator, it provides a structured consensus view supported by market regime, volatility, confidence, probability, and signal-quality analysis. Whether used for scalping, day trading, or swing trading, the goal is to simplify complex technical data into actionable market context while keeping every vote visible and explainable.
We would love to hear your suggestions. If you have ideas for new features, indicators, analytics, or improvements, please share your feedback. Your input helps guide future updates and improve the indicator for all traders.
For educational and informational purposes only. This indicator is designed to assist technical analysis and should not be considered financial, investment, or trading advice.
Indicator

Pullback Sniper Method [trade_w_samet]🎯 Pullback Sniper Method
Pullback Sniper Method is a free open-source pullback, breakout, and trade-visualization indicator designed to help traders analyze structured trend-continuation setups directly on the price chart.
This script combines:
📈 EMA-based trend context
🚀 breakout detection
🎯 pullback confirmation logic
✅ Fast / Balanced / Strict confirmation modes
🧠 optional McGinley and RSI filters
📦 ATR-based TP/SL projection boxes
🎯 TP1 / TP2 / TP3 tracking
🛑 SL tracking
🏷️ result labels
⭐ signal quality tooltip information
📊 statistics table
💎 premium-style dashboard
🎨 multiple visual themes
🚨 alert conditions
The goal of Pullback Sniper Method is not to predict the future or provide guaranteed buy/sell instructions.
Its purpose is to help users visually study:
⚡ trend continuation behavior
🎯 pullback quality
📈 breakout-following structure
🧠 confirmation strength
📦 projected risk/reward zones
📊 historical visual outcomes
💎 dashboard-based system feedback
🚨 alert-based monitoring
Pullback Sniper Method should be treated as a structured chart-analysis and educational decision-support tool, not as financial advice, not as an automated trading system, and not as a guarantee of profitable results.
━━━━━━━━━━━━━━━━━━━━━━
🔓 OPEN-SOURCE PUBLICATION NOTE
━━━━━━━━━━━━━━━━━━━━━━
This script is published as an open-source educational and visual market-analysis tool.
The source code is visible so users can inspect, review, understand, and learn from the logic.
The description is intentionally detailed because many users do not inspect every part of the Pine Script code line by line.
The purpose of this page is to explain:
✅ what the script does
✅ how the main logic works
✅ how signals are created
✅ what the trend engine checks
✅ how pullbacks are validated
✅ how confirmation modes differ
✅ how TP/SL projections are drawn
✅ how historical trade visuals are managed
✅ what the statistics table means
✅ what the premium dashboard means
✅ what the quality score tooltip represents
✅ what the limitations are
✅ how the indicator should and should not be used
Pullback Sniper Method is designed to support structured analysis.
It does not promise profitable results.
It does not remove market risk.
It does not execute trades.
It does not place broker orders.
It should not be used as a blind buy/sell system.
It is best used as a visual framework for reviewing trend, breakout, pullback, confirmation, and projected risk/reward behavior.
━━━━━━━━━━━━━━━━━━━━━━
📌 OVERVIEW
━━━━━━━━━━━━━━━━━━━━━━
At a high level, Pullback Sniper Method does the following:
📈 Calculates a trend engine using Fast EMA, Slow EMA, and EMA slope.
🚀 Detects breakout conditions after trend alignment.
🎯 Waits for price to pull back toward the Pullback EMA.
✅ Confirms entries using Fast, Balanced, or Strict confirmation logic.
🧠 Applies optional McGinley Dynamic distance filtering.
📊 Applies optional RSI directional filtering.
🧊 Uses a cooldown system to reduce signal clustering.
📦 Draws ATR-based TP/SL projection boxes.
🎯 Tracks TP1, TP2, TP3, and SL visually.
🏷️ Displays active TP labels and final result labels.
🗂️ Keeps historical TP/SL visuals on the chart.
⭐ Displays a Quality Score only inside the STRONG label tooltip.
📊 Builds a statistics table for TP1, TP2, TP3, SL, Total, and Win Rate.
💎 Builds a premium dashboard with deeper internal performance metrics.
🎨 Includes three visual themes.
🚨 Includes alert conditions for strong signals and trade outcomes.
This makes the script more than a simple signal label tool.
It is a complete pullback-analysis framework built around trend context, breakout confirmation, pullback behavior, ATR-based visual planning, and historical result review.
━━━━━━━━━━━━━━━━━━━━━━
🧠 CORE IDEA
━━━━━━━━━━━━━━━━━━━━━━
The core idea behind Pullback Sniper Method is simple:
A trend continuation setup should not be judged from one isolated candle.
A single breakout, one EMA touch, one candle close, or one label is usually not enough by itself.
Market context matters.
For that reason, Pullback Sniper Method combines several layers:
📈 trend alignment
🚀 breakout structure
🎯 pullback location
✅ confirmation candle behavior
📏 ATR-based distance filtering
🧠 optional McGinley distance filtering
📊 optional RSI direction filtering
📦 projected TP/SL structure
📊 visual statistics
💎 dashboard feedback
The indicator does not attempt to mark every possible move.
Instead, it attempts to make pullback-based trend continuation conditions easier to read, compare, and review.
The purpose is not to create more signals.
The purpose is to make signal conditions more structured and understandable.
━━━━━━━━━━━━━━━━━━━━━━
🧩 WHY THIS SCRIPT IS NOT A SIMPLE BUY/SELL INDICATOR
━━━━━━━━━━━━━━━━━━━━━━
Pullback Sniper Method is not intended to behave like a simple “buy here / sell here” script.
It is built as a structured workflow:
Trend Engine
→ Breakout Detection
→ Pullback Wait
→ Confirmation Mode
→ Optional Filters
→ STRONG Signal Label
→ Quality Tooltip
→ TP/SL Projection
→ Active Trade Visualization
→ Result Tracking
→ Statistics Review
→ Dashboard Review
→ Alerts
Each part has a specific role.
📈 The Trend Engine defines directional context.
🚀 The Breakout Engine identifies fresh movement beyond recent highs or lows.
🎯 The Pullback Engine waits for price to return toward the pullback EMA.
✅ The Confirmation Engine decides whether the reaction is strong enough.
🧠 The optional filters reduce signals that do not meet additional conditions.
⭐ The Quality Score tooltip gives extra signal context without changing the signal.
📦 The TP/SL boxes provide projected visual structure.
📊 The statistics table summarizes historical visual outcomes.
💎 The dashboard gives a broader state and performance-style overview.
🚨 The alert system helps monitor the script without constantly watching the chart.
This makes the script a full review environment, not a one-condition signal tool.
━━━━━━━━━━━━━━━━━━━━━━
⚙️ HOW THE SCRIPT WORKS
━━━━━━━━━━━━━━━━━━━━━━
📈 TREND ENGINE
The Trend Engine is based on three key components:
⚡ Fast EMA
🐢 Slow EMA
📐 Fast EMA slope
The default structure uses:
Fast EMA = 50
Slow EMA = 200
Pullback EMA = 21
Slope Lookback = 5
For bullish context, the script checks whether:
🟢 Fast EMA is above Slow EMA
🟢 Price is above Slow EMA
🟢 Fast EMA is rising compared to previous bars
For bearish context, the script checks whether:
🔴 Fast EMA is below Slow EMA
🔴 Price is below Slow EMA
🔴 Fast EMA is falling compared to previous bars
This helps the script avoid treating every price move as a valid pullback opportunity.
The trend engine creates the directional foundation for the rest of the logic.
━━━━━━━━━━━━━━━━━━━━━━
🚀 BREAKOUT ENGINE
━━━━━━━━━━━━━━━━━━━━━━
After trend alignment is detected, the script looks for a breakout.
For bullish setups, price must close above the recent breakout high.
For bearish setups, price must close below the recent breakout low.
The breakout engine uses:
🚀 Breakout Lookback
🛑 Invalidation Lookback
🔥 Minimum Breakout Body / ATR
The breakout candle must also have enough body size relative to ATR.
This is important because very small breakouts can create low-quality setup conditions.
The breakout does not immediately create a STRONG label.
Instead, it activates a setup state.
After that, the script waits for a pullback.
━━━━━━━━━━━━━━━━━━━━━━
🎯 PULLBACK SETUP ENGINE
━━━━━━━━━━━━━━━━━━━━━━
Once a breakout setup is active, the script waits for price to return toward the Pullback EMA.
For a bullish setup:
🟢 Price must pull back toward the Pullback EMA.
🟢 The setup must not be invalidated.
🟢 Enough bars must have passed after breakout.
For a bearish setup:
🔴 Price must pull back toward the Pullback EMA from the opposite direction.
🔴 The setup must not be invalidated.
🔴 Enough bars must have passed after breakout.
The script also includes a maximum number of bars to find the pullback.
If no valid pullback appears within that window, the setup expires.
This prevents old breakout conditions from staying active forever.
━━━━━━━━━━━━━━━━━━━━━━
✅ CONFIRMATION ENGINE
━━━━━━━━━━━━━━━━━━━━━━
After a valid pullback touch, the script waits for confirmation.
There are three confirmation modes:
⚡ Fast
⚖️ Balanced
🛡️ Strict
⚡ Fast Mode
Fast mode is the earliest and simplest confirmation style.
It checks whether price closes back in the expected direction relative to the Pullback EMA.
This mode can react faster but may produce more noise.
Useful for:
• faster review
• active chart monitoring
• lower-timeframe analysis
• users who prefer earlier signals
⚖️ Balanced Mode
Balanced mode is the default middle-ground profile.
It requires directional candle behavior and also considers either a break of the previous candle level or wick/rejection behavior.
This helps the signal feel more structured than a basic close-based trigger.
Useful for:
• general chart review
• balanced signal frequency
• intraday analysis
• users who want neither too many nor too few signals
🛡️ Strict Mode
Strict mode is the most selective confirmation profile.
It requires stronger candle body behavior and a more decisive close.
This can reduce signal frequency.
Useful for:
• cleaner setups
• fewer signals
• higher selectivity
• users who prefer stricter confirmation
Important note:
A stricter mode does not guarantee better future outcomes.
It only applies stricter internal confirmation logic.
━━━━━━━━━━━━━━━━━━━━━━
📏 ATR-BASED DISTANCE FILTERING
━━━━━━━━━━━━━━━━━━━━━━
ATR is used in several areas of the script.
The script uses ATR to evaluate:
📌 breakout body strength
📌 confirmation candle body strength
📌 entry distance from Pullback EMA
📌 stop-loss projection distance
📌 TP/SL visual structure
The Max Entry Distance / ATR setting helps block entries that are too far away from the Pullback EMA.
This is important because a pullback system generally works best when the signal appears close enough to the pullback reference area.
If price runs too far away before confirmation, the setup may become less efficient from a risk/reward perspective.
━━━━━━━━━━━━━━━━━━━━━━
🧠 MCGINLEY DYNAMIC FILTER
━━━━━━━━━━━━━━━━━━━━━━
Pullback Sniper Method includes an optional McGinley Dynamic filter.
The purpose of this filter is to avoid signals that appear too close to the McGinley Dynamic line.
This distance is measured using ATR.
When enabled, the script checks whether price has enough distance from the McGinley line.
This can help reduce low-quality signals in crowded or compressed areas.
The McGinley filter is optional.
Users can turn it off if they prefer to use only the main trend/pullback logic.
━━━━━━━━━━━━━━━━━━━━━━
📊 RSI DIRECTION FILTER
━━━━━━━━━━━━━━━━━━━━━━
The script also includes an optional RSI direction filter.
When enabled:
🟢 Long signals require RSI to be above the selected long threshold.
🔴 Short signals require RSI to be below the selected short threshold.
By default, the RSI filter is turned off.
This keeps the base system cleaner and allows users to decide whether they want additional oscillator-style directional filtering.
The RSI filter should be treated as context, not as a guarantee.
━━━━━━━━━━━━━━━━━━━━━━
🧊 SIGNAL COOLDOWN SYSTEM
━━━━━━━━━━━━━━━━━━━━━━
The script includes a cooldown system to prevent signals from appearing too close to each other.
After a signal appears, the script waits for the selected number of bars before allowing another signal.
This helps reduce visual clutter and prevents the chart from printing too many labels in a short period.
The cooldown system is especially useful on lower timeframes or volatile assets.
━━━━━━━━━━━━━━━━━━━━━━
💪 STRONG SIGNAL LABELS
━━━━━━━━━━━━━━━━━━━━━━
When all required conditions align, the script can display a STRONG label on the chart.
A STRONG label appears only after the script detects:
📈 valid trend context
🚀 valid breakout setup
🎯 valid pullback touch
✅ valid confirmation
🧠 optional filter approval
🧊 cooldown approval
📦 no active trade conflict
The STRONG label does not mean the future outcome is guaranteed.
It simply means the script’s internal conditions aligned at that point.
━━━━━━━━━━━━━━━━━━━━━━
⭐ QUALITY SCORE TOOLTIP
━━━━━━━━━━━━━━━━━━━━━━
Pullback Sniper Method includes a Quality Score tooltip on the STRONG label.
This score does not filter signals.
It does not change entries.
It does not block or approve trades.
It is only informational.
To view it, hover your mouse over the STRONG label.
The tooltip can show:
⭐ Quality Score
🌟 Star rating
📌 Direction
📈 Trend alignment
🔥 Body / ATR ratio
📍 EMA Distance / ATR
Example tooltip:
Quality Score: 82/100 ⭐⭐⭐⭐ | Quality: HIGH | Direction: LONG | Trend: Bullish | Body/ATR: 0.48 | EMA Distance/ATR: 0.32
Star guide:
⭐⭐⭐⭐⭐ = very strong internal quality
⭐⭐⭐⭐ = high internal quality
⭐⭐⭐ = good internal quality
⭐⭐ = medium internal quality
⭐ = lower internal quality
Important note:
A score of 82 does not mean there is an 82% chance of winning.
The score only summarizes internal signal quality according to the script’s own visual model.
━━━━━━━━━━━━━━━━━━━━━━
📦 TP / SL PROJECTION SYSTEM
━━━━━━━━━━━━━━━━━━━━━━
Pullback Sniper Method includes an ATR-based TP/SL projection system.
When a STRONG signal appears, the script can draw:
📦 TP box
📦 SL box
🎯 TP1 line
🎯 TP2 line
🎯 TP3 line
🏷️ TP price labels
🏁 final result label
The system uses ATR-based risk.
Default structure:
🛡️ SL ATR Multiplier = 2.0
🎯 TP3 Reward R = 2.0R
🥉 TP1 = 25% of TP3 distance
🥈 TP2 = 50% of TP3 distance
🏆 TP3 = final target distance
This creates a clean visual projection of the potential trade structure.
The boxes are not broker orders.
They are visual projections based on the script’s internal logic.
━━━━━━━━━━━━━━━━━━━━━━
🎯 TP1 / TP2 / TP3 / SL TRACKING
━━━━━━━━━━━━━━━━━━━━━━
The script tracks projected trade progress visually.
Possible outcome states include:
🥉 TP1 reached
🥈 TP2 reached
🏆 TP3 reached
🛑 SL reached
If price reaches TP3, the result is marked as TP3.
If price hits SL before reaching any TP level, the result is marked as SL.
If price reaches TP1 and later returns to SL, the result can be treated as a TP1-style protected outcome.
If price reaches TP2 and later returns to SL, the result can be treated as a TP2-style protected outcome.
This allows the visual projection to remember the best target reached before the trade closes.
━━━━━━━━━━━━━━━━━━━━━━
⚠️ SAME-CANDLE TP/SL HANDLING
━━━━━━━━━━━━━━━━━━━━━━
If TP and SL are both touched on the same candle, there is ambiguity.
The script cannot know the true intrabar sequence from standard OHLC data.
For that reason, Pullback Sniper Method uses a conservative rule:
🔴 If TP and SL are both touched on the same candle, the script treats it as SL.
This avoids overly optimistic visual outcomes when the true intrabar order is unknown.
This conservative approach is useful when reviewing historical visual performance.
━━━━━━━━━━━━━━━━━━━━━━
🙈 EARLY SL HIDING LOGIC
━━━━━━━━━━━━━━━━━━━━━━
The script includes an early SL hiding feature.
If a projected trade hits SL within the first selected number of bars, the visual trade can be hidden and excluded from statistics.
Default:
🙈 Hide Early SL Bars = 3
This feature is designed to reduce extremely fast failed projections from cluttering the visual history.
Users should understand that this affects the visual/statistical display of the script.
It is not a broker-side execution rule.
━━━━━━━━━━━━━━━━━━━━━━
🗂️ HISTORICAL TRADE VISUALS
━━━━━━━━━━━━━━━━━━━━━━
Pullback Sniper Method can keep historical TP/SL visuals on the chart.
This includes:
📦 previous TP boxes
📦 previous SL boxes
🎯 TP1 / TP2 / TP3 lines
🛑 SL lines
🏷️ result labels
🏷️ TP price labels
The script also includes a maximum historical trade limit.
Default:
🧮 Max Historical Trades = 40
This helps prevent TradingView object-limit issues while still allowing users to review past signals visually.
━━━━━━━━━━━━━━━━━━━━━━
📊 STATISTICS TABLE
━━━━━━━━━━━━━━━━━━━━━━
The statistics table summarizes visual trade outcomes.
It can display:
🥉 TP1 count
🥈 TP2 count
🏆 TP3 count
🛑 SL count
📊 Total closed trades
✅ Win Rate
The statistics are calculated internally using the script’s visual TP/SL logic.
They are not broker execution results.
They do not include real slippage, spread, commission, liquidity, partial fills, or order execution issues.
They should be used for visual review and educational analysis only.
━━━━━━━━━━━━━━━━━━━━━━
💎 PREMIUM DASHBOARD
━━━━━━━━━━━━━━━━━━━━━━
Pullback Sniper Method includes a premium-style dashboard.
The dashboard can display:
📈 Trend
📡 Current status
📊 Total trades
✅ Win rate
📈 Total R
📉 Average R
🧮 Profit Factor
🎯 Expectancy
🔥 Max win streak
❄️ Max loss streak
🔁 Current streak
⏱️ Average bars in trade
🏆 TP3 rate
🛑 SL rate
🧭 Best direction
🟢 Long win rate
🔴 Short win rate
📌 Active trade state
🧾 Last signal
🎯 Best TP reached
The dashboard is designed to give users a structured overview of the script’s internal visual results.
Important note:
These dashboard values are not official TradingView Strategy Tester results.
They are internally calculated visual-analysis metrics.
They should not be interpreted as guaranteed performance.
━━━━━━━━━━━━━━━━━━━━━━
🎨 VISUAL THEME SYSTEM
━━━━━━━━━━━━━━━━━━━━━━
The script includes three visual themes:
🔵 Neon Pro
🧊 Ice Blue
🟡 Gold Black
The theme system affects:
🎨 STRONG label colors
📦 TP/SL box colors
🎯 TP/SL line colors
🏷️ TP price labels
📊 statistics table colors
💎 premium dashboard colors
🟢 long-side visuals
🟠 short-side visuals
Color settings are handled internally to keep the Inputs tab cleaner and more organized.
━━━━━━━━━━━━━━━━━━━━━━
🏷️ TP PRICE LABELS
━━━━━━━━━━━━━━━━━━━━━━
TP labels are displayed next to the TP levels rather than inside the boxes.
This helps keep the projection boxes cleaner.
The labels can show:
TP1 price
TP2 price
TP3 price
Example:
TP1 102450.5
TP2 103120.0
TP3 104300.0
This makes it easier to visually read the projected target levels without opening the settings or manually checking each line.
━━━━━━━━━━━━━━━━━━━━━━
🏁 RESULT LABELS
━━━━━━━━━━━━━━━━━━━━━━
When a projected trade closes, the script can display a result label.
Examples:
🏆 TP3 HIT WIN +2R
🥈 TP2 EXIT WIN +1R
🥉 TP1 EXIT WIN +0.5R
🛑 SL HIT LOSS -1R
The exact value depends on the selected TP/SL structure and the highest TP reached before closure.
These labels are visual summaries only.
They do not represent broker execution.
━━━━━━━━━━━━━━━━━━━━━━
🚨 ALERT SYSTEM
━━━━━━━━━━━━━━━━━━━━━━
Pullback Sniper Method includes alert conditions for:
🟢 Strong Long
🟠 Strong Short
🏆 TP3 Hit
🛑 SL Hit
🎯 Protected TP Exit
Users can create TradingView alerts from these alert conditions.
Alerts can help monitor the chart without constantly watching every candle.
Important note:
Alerts are based on the script’s conditions.
They are not trade execution instructions.
Users are responsible for validating alerts and applying their own risk management.
━━━━━━━━━━━━━━━━━━━━━━
🧪 HOW TO USE THE INDICATOR
━━━━━━━━━━━━━━━━━━━━━━
A practical workflow:
Add Pullback Sniper Method to your chart.
Start with the default settings.
Review the overall trend direction.
Wait for a valid breakout setup.
Let the script wait for a pullback toward the Pullback EMA.
Watch for a STRONG label after confirmation.
Hover over the STRONG label to review the Quality Score tooltip.
Review the TP/SL projection box.
Check TP1, TP2, TP3, and SL levels.
Observe whether the projected trade reaches TP levels or SL.
Use the statistics table for visual outcome review.
Use the premium dashboard for deeper internal metrics.
Use alerts if you want automated signal notifications.
Validate the behavior on the exact symbols and timeframes you personally study.
This indicator is best used as a structured review tool.
It should not be used as a blind execution system.
━━━━━━━━━━━━━━━━━━━━━━
⚙️ SETTINGS REFERENCE
━━━━━━━━━━━━━━━━━━━━━━
📈 Trend Engine
⚡ Fast EMA Length
Controls the fast trend EMA. Lower values react faster, while higher values are smoother.
🐢 Slow EMA Length
Controls the broader trend EMA used for directional context.
🎯 Pullback EMA Length
Defines the EMA area where price is expected to pull back before confirmation.
📐 Trend Slope Lookback
Checks whether the fast EMA is sloping in the expected trend direction.
━━━━━━━━━━━━━━━━━━━━━━
🎯 Pullback Setup Engine
🚀 Breakout Lookback
Defines how many bars are used to detect a fresh breakout level.
🛑 Invalidation Lookback
Defines the invalidation level for the active pullback setup.
⏳ Min Bars After Breakout
Controls how many bars must pass after breakout before pullback detection begins.
⌛ Max Bars To Find Pullback
If no valid pullback appears within this range, the setup expires.
━━━━━━━━━━━━━━━━━━━━━━
✅ Confirmation Engine
✅ Confirmation Mode
Available modes:
⚡ Fast
⚖️ Balanced
🛡️ Strict
📏 ATR Length
ATR used for body-size and distance filters.
🔥 Min Breakout Body / ATR
Minimum breakout candle body size compared to ATR.
💪 Min Confirm Body / ATR
Minimum confirmation candle body size compared to ATR. Mainly used in Strict mode.
📍 Max Entry Distance / ATR
Blocks entries that are too far away from the Pullback EMA.
🧊 Use Signal Cooldown
Prevents too many signals from appearing too close to each other.
⏱️ Cooldown Bars
Number of bars to wait after a signal before allowing another one.
━━━━━━━━━━━━━━━━━━━━━━
🧠 Optional Filters
🧲 Block Signals Near McGinley
Avoids entries too close to the McGinley Dynamic line.
〽️ McGinley Length
Length used for the McGinley Dynamic filter.
📐 Min McGinley Distance / ATR
Minimum distance required between price and McGinley Dynamic.
📊 Use RSI Direction Filter
Filters long/short signals based on RSI direction.
📈 RSI Length
RSI length used for the optional direction filter.
🟢 RSI Long Minimum
Long signals are allowed only when RSI is above this value.
🔴 RSI Short Maximum
Short signals are allowed only when RSI is below this value.
━━━━━━━━━━━━━━━━━━━━━━
📦 Trade Visual Engine
📏 Show TP / SL Lines
Shows TP1, TP2, TP3, and SL lines.
📦 Show TP / SL Boxes
Shows TP and SL projection zones.
🏷️ Show Active TP Label
Shows the latest touched TP label while the projected trade is active.
🗂️ Show Historical TP / SL Trades
Keeps previous TP/SL boxes, lines, and labels on the chart.
🧮 Max Historical Trades
Limits historical visual trades to help avoid object-limit issues.
🛡️ SL ATR Length
ATR length used for stop-loss calculation.
🛑 SL ATR Multiplier
ATR multiplier used for stop-loss distance.
🎯 TP3 Reward R
Final TP target multiple based on the initial risk distance.
🥉 TP1 % Of TP3
TP1 distance as a percentage of final TP3 distance.
🥈 TP2 % Of TP3
TP2 distance as a percentage of final TP3 distance.
↔️ Initial TP / SL Length
Initial visual length of TP/SL lines and boxes.
🙈 Hide Early SL Bars
If SL is reached within this number of bars, the projection can be hidden and excluded from statistics.
📊 Show Statistics Table
Shows TP1, TP2, TP3, SL, total trades, and win rate.
💎 Show Premium Dashboard
Shows the extended dashboard with deeper internal metrics.
━━━━━━━━━━━━━━━━━━━━━━
🎨 Visual Settings
🎭 Color Theme
Available themes:
🔵 Neon Pro
🧊 Ice Blue
🟡 Gold Black
💪 Show STRONG Labels
Shows the main STRONG labels on the chart.
🔠 Signal Label Size
Controls the size of STRONG signal labels.
━━━━━━━━━━━━━━━━━━━━━━
🧠 WHAT MAKES THIS SCRIPT ORIGINAL
━━━━━━━━━━━━━━━━━━━━━━
Pullback Sniper Method uses familiar concepts such as:
📈 EMA trend context
🚀 breakout detection
🎯 pullback confirmation
🧠 optional technical filters
📦 ATR-based TP/SL projection
📊 dashboard metrics
🚨 alerts
These components are not unique by themselves.
The originality of the script lies in how these components are organized into one workflow:
Trend Engine
→ Breakout Detection
→ Pullback Validation
→ Confirmation Mode
→ Optional Filters
→ STRONG Label
→ Quality Tooltip
→ TP/SL Projection
→ Historical Trade Visualization
→ Statistics Table
→ Premium Dashboard
→ Alerts
This structure is intended to give users a cleaner way to review pullback-based trend continuation setups.
━━━━━━━━━━━━━━━━━━━━━━
⚠️ IMPORTANT PRACTICAL NOTES
━━━━━━━━━━━━━━━━━━━━━━
The script’s behavior depends heavily on settings.
Signal frequency and visual output may change based on:
🎛️ selected confirmation mode
📈 EMA lengths
🎯 pullback EMA length
🚀 breakout lookback
🛑 invalidation lookback
📏 ATR settings
🧠 McGinley filter
📊 RSI filter
🧊 cooldown setting
📦 TP/SL settings
📊 market
⏱️ timeframe
📉 symbol volatility
📚 available historical bars
A configuration that looks cleaner on one market may not behave the same way on another.
The TP/SL boxes are visual projections based on script rules.
They are not broker orders.
They do not account for real execution conditions.
━━━━━━━━━━━━━━━━━━━━━━
⚠️ LIMITATIONS AND SHORTCOMINGS
━━━━━━━━━━━━━━━━━━━━━━
This script has important limitations:
❌ It does not guarantee profitable trades.
❌ It does not predict future price movement.
❌ It does not replace risk management.
❌ It does not execute trades.
❌ It does not place orders.
❌ It does not include broker slippage.
❌ It does not include commissions.
❌ It does not include spreads.
❌ It uses bar-based chart data.
❌ Same-candle TP/SL order cannot be known from standard OHLC data.
❌ Same-candle TP/SL is handled conservatively as SL.
❌ Quality Score is not a win-rate prediction.
❌ Dashboard statistics are internal visual metrics, not broker results.
❌ ATR-based TP/SL projections are visual analysis tools, not trade instructions.
❌ Strong labels can still fail in choppy or low-quality market conditions.
❌ Historical visual behavior does not ensure future behavior.
For these reasons, Pullback Sniper Method should be used as an educational decision-support tool, not as a standalone trading strategy.
━━━━━━━━━━━━━━━━━━━━━━
👤 WHO THIS SCRIPT MAY BE USEFUL FOR
━━━━━━━━━━━━━━━━━━━━━━
This script may be useful for traders who:
✅ study pullback-based trend continuation
✅ want structured breakout/pullback confirmation
✅ want ATR-based TP/SL visualization
✅ want historical visual trade review
✅ want a clean statistics table
✅ want a premium-style dashboard
✅ want signal quality information without changing signal logic
✅ want configurable confirmation strictness
✅ want visual themes
✅ want alert-based monitoring
✅ prefer organized chart-based analysis
✅ want an open-source educational TradingView tool
It may be less suitable for users who:
❌ want guaranteed buy/sell signals
❌ want a fully automated trading bot
❌ do not use technical analysis
❌ do not want chart visuals
❌ expect one setting to work on every market
❌ want an indicator that replaces their own decision-making
❌ expect internal visual statistics to match broker execution results
━━━━━━━━━━━━━━━━━━━━━━
🧭 BEST PRACTICE SUGGESTIONS
━━━━━━━━━━━━━━━━━━━━━━
For cleaner review:
✅ Start with the default settings.
✅ Use Balanced confirmation first.
✅ Test Fast and Strict modes only after understanding the default behavior.
✅ Review STRONG labels together with market structure.
✅ Hover over labels to inspect Quality Score context.
✅ Use TP/SL boxes as visual planning tools, not automatic orders.
✅ Review dashboard metrics as internal script feedback only.
✅ Avoid treating every signal as a trade.
✅ Test the indicator on the symbols and timeframes you actually use.
✅ Combine the tool with independent analysis and risk management.
✅ Keep expectations realistic.
━━━━━━━━━━━━━━━━━━━━━━
🚨 ALERT USAGE
━━━━━━━━━━━━━━━━━━━━━━
The script includes alert conditions for important events.
Available alert types include:
🟢 Strong Long
🟠 Strong Short
🏆 TP3 Hit
🛑 SL Hit
🎯 Protected TP Exit
A practical alert workflow:
Add the indicator to your chart.
Open TradingView’s alert window.
Select Pullback Sniper Method as the condition.
Choose the alert condition you want.
Configure frequency according to your preference.
Use alerts as monitoring tools only.
Confirm all alerts manually with your own analysis.
Alerts do not execute trades.
Alerts are not financial advice.
━━━━━━━━━━━━━━━━━━━━━━
🔓 OPEN-SOURCE NOTE
━━━━━━━━━━━━━━━━━━━━━━
This script is published open-source for educational review, transparency, and community learning.
Users can inspect how the indicator works, study the logic, modify it for personal learning, and understand the internal conditions behind the visual output.
Please respect TradingView’s House Rules when reusing or republishing open-source code.
The purpose of open-source publication is to support learning and transparent script review.
━━━━━━━━━━━━━━━━━━━━━━
🛡️ DISCLAIMER
━━━━━━━━━━━━━━━━━━━━━━
Pullback Sniper Method is provided for educational and informational purposes only.
It does not constitute financial, investment, or trading advice.
No indicator can guarantee future results.
Markets are uncertain, conditions change, and historical behavior does not ensure future performance.
Every user is responsible for their own analysis, validation, risk management, position sizing, and trading decisions.
The TP/SL boxes, labels, dashboard statistics, Quality Score, and alerts are visual analysis tools only.
Use this script as a structured decision-support and visual review framework, not as a promise of profitability. Indicator

SuperTrend Take-Profit Dimensions [AlgoAlpha]🟠 OVERVIEW
A multi-dimensional take-profit aid that scores how typical the current bar looks compared to past SuperTrend pivots, so you can tell when a trend has reached favorable exit conditions.
The indicator runs a standard SuperTrend and records every confirmed zigzag pivot that occurs during a matching-direction run. Tops go into a bull pool , bottoms into a bear pool . Each pivot is stored as a set of readings across several independent axes, such as relative volume , time of day , and price position inside the recent range .
On every bar, the current reading on each axis is compared to that historical pool. A blended score from 0 to 100 tells you how closely the current conditions resemble where past pivots in the same direction have clustered. The idea is to give trend followers a data-backed sense of when to start tightening up, rather than guessing an exit or using a fixed R-multiple.
The three built-in axes were chosen deliberately to be as uncorrelated as possible , each describing a different dimension of market context: volume (relative volume percentile), time (time of day), and price (position in recent range). Correlated inputs would double-count the same information and distort the blended score; picking axes that describe genuinely different aspects of the market means each one contributes independent evidence, and the score reflects how many distinct dimensions are currently in agreement.
🟠 CONCEPTS
SuperTrend — An ATR-based trailing stop that flips between bullish and bearish states. Controls which pool of historical pivots the script reads from.
Pivot pool — A rolling store of confirmed zigzag pivots, split by direction. Bull pool holds pivot highs that printed during bullish SuperTrend runs; bear pool holds pivot lows from bearish runs. Capped at 2000 entries per side .
Context axis — A 0–100 value measured at the pivot bar. The script ships with three built-ins ( relative volume percentile , time of day , position in recent range ) and one optional user-plugged signal.
Axis independence — The three built-in axes cover volume , time , and price respectively, chosen so each describes a structurally different part of the market. Low correlation between axes keeps the blended score from being dominated by any single factor.
Conditional histogram — For each active axis, the script walks its pool and keeps only pivots whose bins on every other active axis match the current bar. The survivors are binned to form a histogram.
Axis score — For one axis, the count of pivots in the current bar's bin divided by the count in the histogram's tallest bin, scaled to 0–100 . 100 means the current context sits in the densest part of past pivots.
Blended favourability score — Arithmetic mean of the active per-axis scores. This is what the gauge and table display.
Density-match scoring — The score measures how common the current context is among past pivots. It is not a forward probability and makes no claim about what happens next.
🟠 FEATURES
Right-side context profiles — Stacked mini histograms render to the right of price, one per active axis.
• Bar heights show how pivots in each axis's conditional pool distribute across bins.
• A dashed vertical line marks the current bar's bin on that axis, so you can see at a glance where today sits against history.
• Bar hue tracks the active SuperTrend direction.
Favourability gauge — A vertical gradient table in the bottom-right showing the blended score, with a chevron marking the current level. Green at the top, red at the bottom.
Favourability breakdown table — A two-column readout of each active axis's individual score out of 100, plus a final row that classifies the blended score as Good , Neutral , or Bad . Position and text size are configurable.
Bar coloring — Bars fade from neutral grey toward the opposing trend colour as the blended score rises toward 100, so the chart itself signals when the context is stretched.
Take-profit markers — Small orange markers print above or below the bar when the blended score hits 100 for the active SuperTrend direction.
Timeframe guard — The time-of-day axis disables automatically on daily and higher timeframes, where the reading has no meaning, and a banner explains this so the blended score stays honest.
Multi-dimensional scoring engine — Four independent axes feed into a single score, each conditioned on all the others.
• Three built-in axes can be toggled on or off individually.
• A fourth axis accepts any plot via source input , provided the series stays within 0–100 on all loaded bars.
• An on-chart warning prints if the custom signal leaves that range, and the axis is ignored until it is corrected.
Deliberately uncorrelated built-in axes — Volume ( relative volume percentile ), time ( time of day ), and price ( position in recent range ) cover three structurally different facets of market context. Keeping the axes independent means each one adds new information to the blend rather than reinforcing the others.
Alert conditions — Six alerts are included: SuperTrend bullish flip, SuperTrend bearish flip, score peak match, and crossovers into the Good , Neutral , and Bad bands.
🟠 HOW TO USE
Add the script to an intraday chart on a liquid instrument and let it run long enough to populate the pools. More history means more stable conditional histograms.
Let SuperTrend define the active regime. The script only scores in the direction of the current trend; bar coloring and take-profit markers respect that regime.
Read the gauge and breakdown table together. The gauge shows the blended level; the table shows which individual axes are pulling it up or down.
Use the right-side profiles as a sanity check. If the dashed current-bin marker is sitting on or near the tallest bar across most axes, the current context closely resembles past pivot contexts in that direction.
Treat high scores as a cue to tighten management, not as reversal signals. A reading of 100 means conditions match where pivots have historically clustered, not that the trend is guaranteed to end.
Adjust the zigzag pivot length to control how strict the pool is. Lower values admit more pivots ( bigger, noisier sample ); higher values keep only firmer pivots ( smaller, cleaner sample ).
Plug your own signal into the custom axis to test whether an existing 0–100 oscillator adds useful conditioning, such as an RSI or a normalised momentum reading. For best results, pick a signal that is not strongly correlated with the three built-ins, so the custom axis adds a new dimension rather than re-stating an existing one.
Enable only the alerts that fit your workflow. The band-crossover alerts fire once per transition , not on every bar inside a band.
🟠 LIMITATIONS
The pool holds every confirmed pivot during a matching-direction run, not only pivots that ended the trend. Intermediate pullbacks sit alongside genuine terminal pivots. Raising the zigzag pivot length filters the pool further if you want a cleaner sample.
On strongly trending symbols the pool is dominated by pullback pivots rather than true terminal exits, because strong trends have many small pullbacks and only one final top or bottom. On choppy symbols the ratio is more balanced. Read the score with this in mind.
The blended score is a density-match measure, not a forward probability . A high reading means today's context is common among past pivots of this direction. It does not predict that the trend is about to end.
The time-of-day axis has no meaning on daily and higher timeframes and is disabled automatically on those timeframes. A warning banner confirms when this is active.
The custom axis requires a source already scaled to 0–100 on every loaded bar. Values outside that range disable the axis and surface a warning. Toggling the custom axis on a live chart starts the range check from the current bar; reload the chart to validate against full loaded history .
Pools are capped at 2000 entries per direction , with the oldest entries dropped first. On very long intraday histories the effective lookback is symbol- and timeframe-dependent.
All scoring uses data up to and including the confirmation bar of each pivot; pivots themselves are detected with the standard zigzag confirmation lag, meaning the scoring population on any given bar reflects pivots confirmed at least zzLen bars earlier.
🟠 CONCLUSION
SuperTrend Take-Profit Dimensions combines a standard SuperTrend with a rolling pool of historical pivot contexts and scores the current bar against that pool across up to four independent axes spanning volume, time, and price. The output is a blended 0–100 favourability reading , a per-axis breakdown, and a set of context profiles that show where past pivots have clustered. It gives trend followers a structured, data-backed way to judge when the current context matches where trends have historically given back profit, without pretending to predict the next bar. Indicator

Indicator

Indicator

Indicator

Indicator

Indicator

Indicator

Indicator

Indicator

The 'Qualified' POI Scorer [PhenLabs]📊 The “Qualified” POI Scorer (Q-POI)
Version: PineScript™ v6
📌 Description
The “Qualified” POI Scorer helps intermediate traders overcome "analysis paralysis" by filtering Smart Money Concepts (SMC) structures based on their probability. Instead of flooding your chart with every possible Order Block, this script assigns a proprietary “Quality Score” (0-100) to each zone. It analyzes the strength of the displacement, the presence of imbalances (FVG), and liquidity mechanics to determine which zones are worth your attention. It is designed to clean up your charts and enforce discipline by visually fading out low-quality setups.
🚀 Points of Innovation
Dynamic “Glass UI” Transparency that automatically fades weak zones based on their score.
Proprietary Scoring Algorithm (0-100) based on three distinct institutional factors.
Visual Icon System that prints analytical context (💧— 🚀/🐌—🧱) directly on the chart.
Automated Mitigation Tracking that changes the visual state of zones after they are tested.
Displacement Velocity calculation using ATR to verify institutional intent.
🔧 Core Components
Liquidity Sweep Engine: Detects if a pivot point grabbed liquidity from the previous X bars before reversing.
FVG Validator: Checks if the move away from the zone created a valid Fair Value Gap.
Momentum Scorer: Calculates the size of the displacement candle relative to the Average True Range (ATR).
🔥 Key Features
Quality Filtering: Automatically hides or dims zones that score below 50 (user configurable).
State Management: Zones turn grey when mitigated and delete themselves when invalidated.
Visual Scorecard: Displays the exact numeric score on the zone for quick decision-making.
Time-Decay Logic: Keeps the chart clean by managing the lifespan of old zones.
🎨 Visualization
High Score Zones (80-100): Display as bright, semi-solid boxes indicating high probability.
Medium Score Zones (50-79): Display as translucent “glass” boxes.
Low Score Zones (<50): Display as faint “ghost” boxes or are completely hidden.
Rocket Icon (🚀): Indicates high momentum displacement.
Snail Icon (🐌): Indicates low momentum displacement.
Drop Icon (💧): Indicates the zone swept liquidity.
Brick Icon (🧱): Indicates the zone is supported by an FVG.
📖 Usage Guidelines
Swing Structure Length (Default: 5): Controls the sensitivity of the pivot detection; lower numbers create more zones, higher numbers find major swing points.
ATR Length (Default: 14): Determines the lookback period for calculating relative momentum.
Minimum Quality Score (Default: 50): The threshold for which zones are considered “valid” enough to be fully visible.
Bullish/Bearish Colors: Fully customizable colors that adapt their own transparency based on the score.
Show Weak Zones (Default: False): Toggles the visibility of zones that failed the quality check.
✅ Best Use Cases
Filtering noise during high-volatility sessions by focusing only on Score 80+ zones.
Confirming trend continuation entries by looking for the Rocket (🚀) momentum icon.
Avoiding “stale” zones by ignoring any box that has turned grey (Mitigated).
⚠️ Limitations
The indicator is reactive to closed candles and cannot predict news-driven spikes.
Scoring is based on technical structure and does not account for fundamental drivers.
In extremely choppy markets, the ATR filter may produce lower scores due to lack of displacement.
💡 What Makes This Unique
It transforms subjective SMC analysis into an objective, quantifiable score.
The visual hierarchy allows traders to assess chart quality in milliseconds without reading data.
It integrates three separate SMC concepts (Liquidity, Imbalance, Structure) into a single tool.
🔬 How It Works
Step 1: The script identifies a Swing High or Low based on your length input.
Step 2: It looks backward to see if that swing swept liquidity, and looks forward to check for an FVG and displacement.
Step 3: It calculates a weighted score (30pts for Sweep, 30pts for FVG, 40pts for Momentum).
Step 4: It draws the zone with a transparency level designated by the score and appends the relevant icons.
💡 Note:
For the best results, use this indicator on the timeframe you execute trades on (e.g., 15m or 1h). Do not use it to find entries on the 1m chart if your analysis is based on the 4h chart. Indicator

VWAP TrendSignalVWAP TrendSignal
VWAP (Volume-Weighted Average Price) is the market’s true fair value — the benchmark institutions use to see when price is balanced, extended, or trending with real intent.
Price often snaps back when it moves too far (mean reversion), and only shows genuine strength when it holds above or below VWAP.
VWAP TrendSignal makes this insight effortless by color-coding VWAP direction:
Yellow = VWAP rising → bullish pressure
Red = VWAP falling → bearish pressure
No bands. No noise. Just pure directional clarity.
Anchor VWAP to the Session, Week, Month, Quarter, or Year, and tailor the Slope Smoothing Filter to your timeframe:
1–2 smoothing → fast & reactive (1–5m scalping)
3–5 smoothing → clean & stable (5–15m intraday)
6–10 smoothing → slow flips (1H–4H swings)
10–15 smoothing → macro bias only (Daily/Weekly)
The line adapts to how you trade.
How to Use It
Mean Reversion
When price stretches far from VWAP, expect pullbacks or snapbacks.
Trend Direction
Yellow supports long bias, red supports short bias.
Simple, reliable, instantly visible.
Balance Zones
Price sitting near VWAP = compression, buildup, or chop.
A perfect signal to wait or prepare for a breakout.
Why It Works
VWAP TrendSignal distills institutional logic into a clean, single-line tool.
It shows fair value, trend slope, and balance all at once — making your chart clearer and your decisions faster.
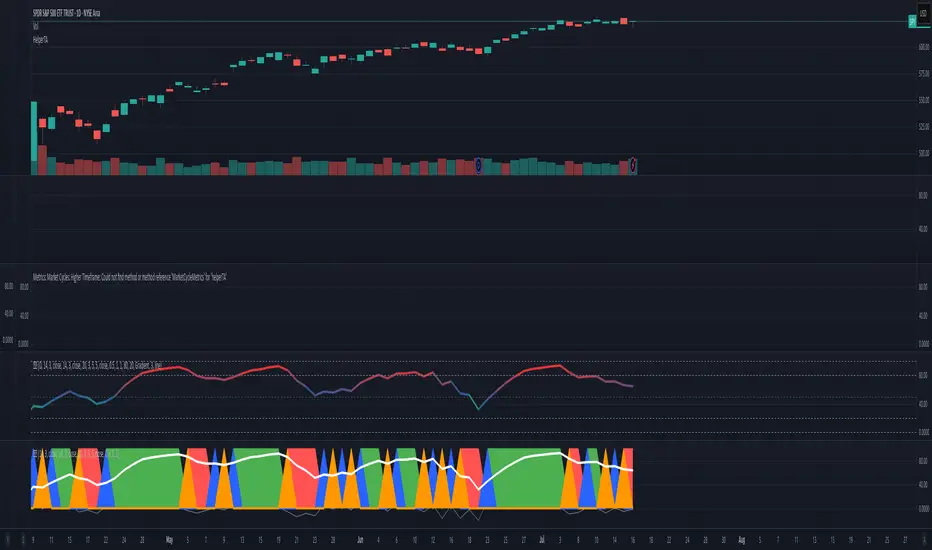
Once you get used to reading it, trading without it feels blind. Indicator

Hidden Impulse═══════════════════════════════════════════════════════════════════
HIDDEN IMPULSE - Multi-Timeframe Momentum Detection System
═══════════════════════════════════════════════════════════════════
OVERVIEW
Hidden Impulse is an advanced momentum oscillator that combines the Schaff Trend Cycle (STC) and Force Index into a comprehensive multi-timeframe trading system. Unlike standard implementations of these indicators, this script introduces three distinct trading setups with specific entry conditions, multi-timeframe confirmation, and trend filtering.
═══════════════════════════════════════════════════════════════════
ORIGINALITY & KEY FEATURES
This indicator is original in the following ways:
1. DUAL-TIMEFRAME STC ANALYSIS
Standard STC implementations work on a single timeframe. This script
simultaneously analyzes STC on both your trading timeframe and a higher
timeframe, providing trend context and filtering out low-probability signals.
2. FORCE INDEX INTEGRATION
The script combines STC with Force Index (volume-weighted price momentum)
to confirm the strength behind price moves. This combination helps identify
when momentum shifts are backed by genuine buying/selling pressure.
3. THREE DISTINCT TRADING SETUPS
Rather than generic overbought/oversold signals, the indicator provides
three specific, rule-based setups:
- Setup A: Classic trend-following entries with multi-timeframe confirmation
- Setup B: Divergence-based reversal entries (highest probability)
- Setup C: Mean-reversion bounce trades at extreme levels
4. INTELLIGENT FILTERING
All signals are filtered through:
- 50 EMA trend direction (prevents counter-trend trades)
- Higher timeframe STC alignment (ensures macro trend agreement)
- Force Index confirmation (validates volume support)
═══════════════════════════════════════════════════════════════════
HOW IT WORKS - TECHNICAL EXPLANATION
SCHAFF TREND CYCLE (STC) CALCULATION:
The STC is a cyclical oscillator that combines MACD concepts with stochastic
smoothing to create earlier and smoother trend signals.
Step 1: Calculate MACD
- Fast MA = EMA(close, Length1) — default 23
- Slow MA = EMA(close, Length2) — default 50
- MACD Line = Fast MA - Slow MA
Step 2: First Stochastic Smoothing
- Apply stochastic calculation to MACD
- Stoch1 = 100 × (MACD - Lowest(MACD, Smoothing)) / (Highest(MACD, Smoothing) - Lowest(MACD, Smoothing))
- Smooth result with EMA(Stoch1, Smoothing) — default 10
Step 3: Second Stochastic Smoothing
- Apply stochastic calculation again to the smoothed stochastic
- This creates the final STC value between 0-100
The dual stochastic smoothing makes STC more responsive than MACD while
being smoother than traditional stochastics.
FORCE INDEX CALCULATION:
Force Index measures the power behind price movements by incorporating volume:
Force Raw = (Close - Close ) × Volume
Force Index = EMA(Force Raw, Period) — default 13
Interpretation:
- Positive Force Index = Buying pressure (bulls in control)
- Negative Force Index = Selling pressure (bears in control)
- Force Index crossing zero = Momentum shift
- Divergences with price = Weakening momentum (reversal signal)
TREND FILTER:
A 50-period EMA serves as the trend filter:
- Price above EMA50 = Uptrend → Only LONG signals allowed
- Price below EMA50 = Downtrend → Only SHORT signals allowed
This prevents counter-trend trading which accounts for most losing trades.
═══════════════════════════════════════════════════════════════════
THE THREE TRADING SETUPS - DETAILED
SETUP A: CLASSIC MOMENTUM ENTRY
Concept: Enter when STC exits oversold/overbought zones with trend confirmation
LONG CONDITIONS:
1. Higher timeframe STC > 25 (macro trend is up)
2. Primary timeframe STC crosses above 25 (momentum turning up)
3. Force Index crosses above 0 OR already positive (volume confirms)
4. Price above 50 EMA (local trend is up)
SHORT CONDITIONS:
1. Higher timeframe STC < 75 (macro trend is down)
2. Primary timeframe STC crosses below 75 (momentum turning down)
3. Force Index crosses below 0 OR already negative (volume confirms)
4. Price below 50 EMA (local trend is down)
Best for: Trending markets, continuation trades
Win rate: Moderate (60-65%)
Risk/Reward: 1:2 to 1:3
───────────────────────────────────────────────────────────────────
SETUP B: DIVERGENCE REVERSAL (HIGHEST PROBABILITY)
Concept: Identify exhaustion points where price makes new extremes but
momentum (Force Index) fails to confirm
BULLISH DIVERGENCE:
1. Price makes a lower low (LL) over 10 bars
2. Force Index makes a higher low (HL) — refuses to follow price down
3. STC is below 25 (oversold condition)
Trigger: STC starts rising AND Force Index crosses above zero
BEARISH DIVERGENCE:
1. Price makes a higher high (HH) over 10 bars
2. Force Index makes a lower high (LH) — refuses to follow price up
3. STC is above 75 (overbought condition)
Trigger: STC starts falling AND Force Index crosses below zero
Why this works: Divergences signal that the current trend is losing steam.
When volume (Force Index) doesn't confirm new price extremes, a reversal
is likely.
Best for: Reversal trading, range-bound markets
Win rate: High (70-75%)
Risk/Reward: 1:3 to 1:5
───────────────────────────────────────────────────────────────────
SETUP C: QUICK BOUNCE AT EXTREMES
Concept: Catch rapid mean-reversion moves when price touches EMA50 in
extreme STC zones
LONG CONDITIONS:
1. Price touches 50 EMA from above (pullback in uptrend)
2. STC < 15 (extreme oversold)
3. Force Index > 0 (buyers stepping in)
SHORT CONDITIONS:
1. Price touches 50 EMA from below (pullback in downtrend)
2. STC > 85 (extreme overbought)
3. Force Index < 0 (sellers stepping in)
Best for: Scalping, quick mean-reversion trades
Win rate: Moderate (55-60%)
Risk/Reward: 1:1 to 1:2
Note: Use tighter stops and quick profit-taking
═══════════════════════════════════════════════════════════════════
HOW TO USE THE INDICATOR
STEP 1: CONFIGURE TIMEFRAMES
Primary Timeframe (STC - Primary Timeframe):
- Leave empty to use your current chart timeframe
- This is where you'll take trades
Higher Timeframe (STC - Higher Timeframe):
- Default: 30 minutes
- Recommended ratios:
* 5min chart → 30min higher TF
* 15min chart → 1H higher TF
* 1H chart → 4H higher TF
* Daily chart → Weekly higher TF
───────────────────────────────────────────────────────────────────
STEP 2: ADJUST STC PARAMETERS FOR YOUR MARKET
Default (23/50/10) works well for stocks and forex, but adjust for:
CRYPTO (volatile):
- Length 1: 15
- Length 2: 35
- Smoothing: 8
(Faster response for rapid price movements)
STOCKS (standard):
- Length 1: 23
- Length 2: 50
- Smoothing: 10
(Balanced settings)
FOREX MAJORS (slower):
- Length 1: 30
- Length 2: 60
- Smoothing: 12
(Filters out noise in 24/7 markets)
───────────────────────────────────────────────────────────────────
STEP 3: ENABLE YOUR PREFERRED SETUPS
Toggle setups based on your trading style:
Conservative Trader:
✓ Setup B (Divergence) — highest win rate
✗ Setup A (Classic) — only in strong trends
✗ Setup C (Bounce) — too aggressive
Trend Trader:
✓ Setup A (Classic) — primary signals
✓ Setup B (Divergence) — for entries on pullbacks
✗ Setup C (Bounce) — not suitable for trending
Scalper:
✓ Setup C (Bounce) — quick in-and-out
✓ Setup B (Divergence) — high probability scalps
✗ Setup A (Classic) — too slow
───────────────────────────────────────────────────────────────────
STEP 4: READ THE SIGNALS
ON THE CHART:
Labels appear when conditions are met:
Green labels:
- "LONG A" — Setup A long entry
- "LONG B DIV" — Setup B divergence long (best signal)
- "LONG C" — Setup C bounce long
Red labels:
- "SHORT A" — Setup A short entry
- "SHORT B DIV" — Setup B divergence short (best signal)
- "SHORT C" — Setup C bounce short
IN THE INDICATOR PANEL (bottom):
- Blue line = Primary timeframe STC
- Orange dots = Higher timeframe STC (optional)
- Green/Red bars = Force Index histogram
- Dashed lines at 25/75 = Entry/Exit zones
- Background shading = Oversold (green) / Overbought (red)
INFO TABLE (top-right corner):
Shows real-time status:
- STC values for both timeframes
- Force Index direction
- Price position vs EMA
- Current trend direction
- Active signal type
═══════════════════════════════════════════════════════════════════
TRADING STRATEGY & RISK MANAGEMENT
ENTRY RULES:
Priority ranking (best to worst):
1st: Setup B (Divergence) — wait for these
2nd: Setup A (Classic) — in confirmed trends only
3rd: Setup C (Bounce) — scalping only
Confirmation checklist before entry:
☑ Signal label appears on chart
☑ TREND in info table matches signal direction
☑ Higher timeframe STC aligned (check orange dots or table)
☑ Force Index confirming (check histogram color)
───────────────────────────────────────────────────────────────────
STOP LOSS PLACEMENT:
Setup A (Classic):
- LONG: Below recent swing low
- SHORT: Above recent swing high
- Typical: 1-2 ATR distance
Setup B (Divergence):
- LONG: Below the divergence low
- SHORT: Above the divergence high
- Typical: 0.5-1.5 ATR distance
Setup C (Bounce):
- LONG: 5-10 pips below EMA50
- SHORT: 5-10 pips above EMA50
- Typical: 0.3-0.8 ATR distance
───────────────────────────────────────────────────────────────────
TAKE PROFIT TARGETS:
Conservative approach:
- Exit when STC reaches opposite level
- LONG: Exit when STC > 75
- SHORT: Exit when STC < 25
Aggressive approach:
- Hold until opposite signal appears
- Trail stop as STC moves in your favor
Partial profits:
- Take 50% at 1:2 risk/reward
- Let remaining 50% run to target
───────────────────────────────────────────────────────────────────
WHAT TO AVOID:
❌ Trading Setup A in sideways/choppy markets
→ Wait for clear trend or use Setup B only
❌ Ignoring higher timeframe STC
→ Always check orange dots align with your direction
❌ Taking signals against the major trend
→ If weekly trend is down, be cautious with longs
❌ Overtrading Setup C
→ Maximum 2-3 bounce trades per session
❌ Trading during low volume periods
→ Force Index becomes unreliable
═══════════════════════════════════════════════════════════════════
ALERTS CONFIGURATION
The indicator includes 8 alert types:
Individual setup alerts:
- "Setup A - LONG" / "Setup A - SHORT"
- "Setup B - DIV LONG" / "Setup B - DIV SHORT" ⭐ recommended
- "Setup C - BOUNCE LONG" / "Setup C - BOUNCE SHORT"
Combined alerts:
- "ANY LONG" — fires on any long signal
- "ANY SHORT" — fires on any short signal
Recommended alert setup:
- Create "Setup B - DIV LONG" and "Setup B - DIV SHORT" alerts
- These are the highest probability signals
- Set "Once Per Bar Close" to avoid false alerts
═══════════════════════════════════════════════════════════════════
VISUALIZATION SETTINGS
Show Labels on Chart:
Toggle on/off the signal labels (green/red)
Disable for cleaner chart once you're familiar with the indicator
Show Higher TF STC:
Toggle the orange dots showing higher timeframe STC
Useful for visual confirmation of multi-timeframe alignment
Info Panel:
Cannot be disabled — always shows current status
Positioned top-right to avoid chart interference
═══════════════════════════════════════════════════════════════════
EXAMPLE TRADE WALKTHROUGH
SETUP B DIVERGENCE LONG EXAMPLE:
1. Market Context:
- Price in downtrend, below 50 EMA
- Multiple lower lows forming
- STC below 25 (oversold)
2. Divergence Formation:
- Price makes new low at $45.20
- Force Index refuses to make new low (higher low forms)
- This indicates selling pressure weakening
3. Signal Trigger:
- STC starts turning up
- Force Index crosses above zero
- Label appears: "LONG B DIV"
4. Trade Execution:
- Entry: $45.50 (current price at signal)
- Stop Loss: $44.80 (below divergence low)
- Target 1: $47.90 (STC reaches 75) — risk/reward 1:3.4
- Target 2: Opposite signal or trail stop
5. Trade Management:
- Price rallies to $47.20
- STC reaches 68 (approaching target zone)
- Take 50% profit, move stop to breakeven
- Exit remaining at $48.10 when STC crosses 75
Result: 3.7R gain
═══════════════════════════════════════════════════════════════════
ADVANCED TIPS
1. MULTI-TIMEFRAME CONFLUENCE
For highest probability trades, wait for:
- Primary TF signal
- Higher TF STC aligned (>25 for longs, <75 for shorts)
- Even higher TF trend in same direction (manual check)
2. VOLUME CONFIRMATION
Watch the Force Index histogram:
- Increasing bar size = Strengthening momentum
- Decreasing bar size = Weakening momentum
- Use this to gauge signal strength
3. AVOID THESE MARKET CONDITIONS
- Major news events (Force Index becomes erratic)
- Market open first 30 minutes (volatility spikes)
- Low liquidity instruments (Force Index unreliable)
- Extreme trending days (wait for pullbacks)
4. COMBINE WITH SUPPORT/RESISTANCE
Best signals occur near:
- Key horizontal levels
- Fibonacci retracements
- Previous day's high/low
- Psychological round numbers
5. SESSION AWARENESS
- Asia session: Use lower timeframes, Setup C works well
- London session: Setup A and B both effective
- New York session: All setups work, highest volume
═══════════════════════════════════════════════════════════════════
INDICATOR WINDOWS LAYOUT
MAIN CHART:
- Price action
- 50 EMA (green/red)
- Signal labels
- Info panel
INDICATOR WINDOW:
- STC oscillator (blue line, 0-100 scale)
- Higher TF STC (orange dots, optional)
- Force Index histogram (green/red bars)
- Reference levels (25, 50, 75)
- Background zones (green oversold, red overbought)
═══════════════════════════════════════════════════════════════════
PERFORMANCE OPTIMIZATION
For best results:
Backtesting:
- Test on your specific instrument and timeframe
- Adjust STC parameters if win rate < 55%
- Record which setup works best for your market
Position Sizing:
- Risk 1-2% per trade
- Setup B can use 2% risk (higher win rate)
- Setup C should use 1% risk (lower win rate)
Trade Frequency:
- Setup B: 2-5 signals per week (be patient)
- Setup A: 5-10 signals per week
- Setup C: 10+ signals per week (scalping)
═══════════════════════════════════════════════════════════════════
CREDITS & REFERENCES
This indicator builds upon established technical analysis concepts:
Schaff Trend Cycle:
- Developed by Doug Schaff (1996)
- Original concept published in Technical Analysis of Stocks & Commodities
- Implementation based on standard STC formula
Force Index:
- Developed by Dr. Alexander Elder
- Described in "Trading for a Living" (1993)
- Classic volume-momentum indicator
The multi-timeframe integration, three-setup system, and specific
entry conditions are original contributions of this indicator.
═══════════════════════════════════════════════════════════════════
DISCLAIMER
This indicator is a technical analysis tool and does not guarantee profits.
Past performance is not indicative of future results. Always:
- Use proper risk management
- Test on demo account first
- Combine with fundamental analysis
- Never risk more than you can afford to lose
═══════════════════════════════════════════════════════════════════
SUPPORT & QUESTIONS
If you find this indicator helpful, please:
- Leave a like and comment
- Share your feedback and results
- Report any bugs or issues
For questions about usage or optimization for specific markets,
feel free to comment below.
═════════════════════════════════════════════════════════════ Indicator

Algorithmic Value Oscillator [CRYPTIK1]Algorithmic Value Oscillator
Introduction: What is the AVO? Welcome to the Algorithmic Value Oscillator (AVO), a powerful, modern momentum indicator that reframes the classic "overbought" and "oversold" concept. Instead of relying on a fixed lookback period like a standard RSI, the AVO measures the current price relative to a significant, higher-timeframe Value Zone .
This gives you a more contextual and structural understanding of price. The core question it answers is not just "Is the price moving up or down quickly?" but rather, " Where is the current price in relation to its recently established area of value? "
This allows traders to identify true "premium" (overbought) and "discount" (oversold) levels with greater accuracy, all presented with a clean, futuristic aesthetic designed for the modern trader.
The Core Concept: Price vs. Value The market is constantly trying to find equilibrium. The AVO is built on the principle that the high and low of a significant prior period (like the previous day or week) create a powerful area of perceived value.
The Value Zone: The range between the high and low of the selected higher timeframe.
Premium Territory (Distribution Zone): When the oscillator moves into the glowing pink/purple zone above +100, it is trading at a premium.
Discount Territory (Accumulation Zone): When the oscillator moves into the glowing teal/blue zone below -100, it is trading at a discount.
Key Features
1. Glowing Gradient Oscillator: The main oscillator line is a dynamic visual guide to momentum.
The line changes color smoothly from light blue to neon teal as bullish momentum increases.
It shifts from hot pink to bright purple as bearish momentum increases.
Multiple transparent layers create a professional "glow" effect, making the trend easy to see at a glance.
2. Dynamic Volatility Histogram: This histogram at the bottom of the indicator is a custom volatility meter. It has been engineered to be adaptive, ensuring that the visual differences between high and low volatility are always clear and dramatic, no matter your zoom level. It uses a multi-color gradient to visualize the intensity of market volatility.
3. Volatility Regime Dashboard: This simple on-screen table analyzes the histogram and provides a clear, one-word summary of the current market state: Compressing, Stable, or Expanding.
How to Use the AVO: Trading Strategies
1. Reversion Trading This is the most direct way to use the indicator.
Look for Buys: When the AVO line drops into the teal "Accumulation Zone" (below -100), the price is trading at a discount. Watch for the oscillator to form a bottom and start turning up as a signal that buying pressure is returning.
Look for Sells: When the AVO line moves into the pink "Distribution Zone" (above +100), the price is trading at a premium. Watch for the oscillator to form a peak and start turning down as a signal that selling pressure is increasing.
2. Best Practices & Settings
Timeframe Synergy: The AVO is most effective when your chart timeframe is lower than your selected "Value Zone Source." For example, if you trade on the 1-hour chart, set your Value Zone to "Previous Day."
Confirmation is Key: This indicator provides powerful context, but it should not be used in isolation. Always combine its readings with your primary analysis, such as market structure and support/resistance levels.
Indicator

Indicator

Volume Block Order AnalyzerCore Concept
The Volume Block Order Analyzer is a sophisticated Pine Script strategy designed to detect and analyze institutional money flow through large block trades. It identifies unusually high volume candles and evaluates their directional bias to provide clear visual signals of potential market movements.
How It Works: The Mathematical Model
1. Volume Anomaly Detection
The strategy first identifies "block trades" using a statistical approach:
```
avgVolume = ta.sma(volume, lookbackPeriod)
isHighVolume = volume > avgVolume * volumeThreshold
```
This means a candle must have volume exceeding the recent average by a user-defined multiplier (default 2.0x) to be considered a significant block trade.
2. Directional Impact Calculation
For each block trade identified, its price action determines direction:
- Bullish candle (close > open): Positive impact
- Bearish candle (close < open): Negative impact
The magnitude of impact is proportional to the volume size:
```
volumeWeight = volume / avgVolume // How many times larger than average
blockImpact = (isBullish ? 1.0 : -1.0) * (volumeWeight / 10)
```
This creates a normalized impact score typically ranging from -1.0 to 1.0, scaled by dividing by 10 to prevent excessive values.
3. Cumulative Impact with Time Decay
The key innovation is the cumulative impact calculation with decay:
```
cumulativeImpact := cumulativeImpact * impactDecay + blockImpact
```
This mathematical model has important properties:
- Recent block trades have stronger influence than older ones
- Impact gradually "fades" at rate determined by decay factor (default 0.95)
- Sustained directional pressure accumulates over time
- Opposing pressure gradually counteracts previous momentum
Trading Logic
Signal Generation
The strategy generates trading signals based on momentum shifts in institutional order flow:
1. Long Entry Signal: When cumulative impact crosses from negative to positive
```
if ta.crossover(cumulativeImpact, 0)
strategy.entry("Long", strategy.long)
```
*Logic: Institutional buying pressure has overcome selling pressure, indicating potential upward movement*
2. Short Entry Signal: When cumulative impact crosses from positive to negative
```
if ta.crossunder(cumulativeImpact, 0)
strategy.entry("Short", strategy.short)
```
*Logic: Institutional selling pressure has overcome buying pressure, indicating potential downward movement*
3. Exit Logic: Positions are closed when the cumulative impact moves against the position
```
if cumulativeImpact < 0
strategy.close("Long")
```
*Logic: The original signal is no longer valid as institutional flow has reversed*
Visual Interpretation System
The strategy employs multiple visualization techniques:
1. Color Gradient Bar System:
- Deep green: Strong buying pressure (impact > 0.5)
- Light green: Moderate buying pressure (0.1 < impact ≤ 0.5)
- Yellow-green: Mild buying pressure (0 < impact ≤ 0.1)
- Yellow: Neutral (impact = 0)
- Yellow-orange: Mild selling pressure (-0.1 < impact ≤ 0)
- Orange: Moderate selling pressure (-0.5 < impact ≤ -0.1)
- Red: Strong selling pressure (impact ≤ -0.5)
2. Dynamic Impact Line:
- Plots the cumulative impact as a line
- Line color shifts with impact value
- Line movement shows momentum and trend strength
3. Block Trade Labels:
- Marks significant block trades directly on the chart
- Shows direction and volume amount
- Helps identify key moments of institutional activity
4. Information Dashboard:
- Current impact value and signal direction
- Average volume benchmark
- Count of significant block trades
- Min/Max impact range
Benefits and Use Cases
This strategy provides several advantages:
1. Institutional Flow Detection: Identifies where large players are positioning themselves
2. Early Trend Identification: Often detects institutional accumulation/distribution before major price movements
3. Market Context Enhancement: Provides deeper insight than simple price action alone
4. Objective Decision Framework: Quantifies what might otherwise be subjective observations
5. Adaptive to Market Conditions: Works across different timeframes and instruments by using relative volume rather than absolute thresholds
Customization Options
The strategy allows users to fine-tune its behavior:
- Volume Threshold: How unusual a volume spike must be to qualify
- Lookback Period: How far back to measure average volume
- Impact Decay Factor: How quickly older trades lose influence
- Visual Settings: Labels and line width customization
This sophisticated yet intuitive strategy provides traders with a window into institutional activity, helping identify potential trend changes before they become obvious in price action alone.
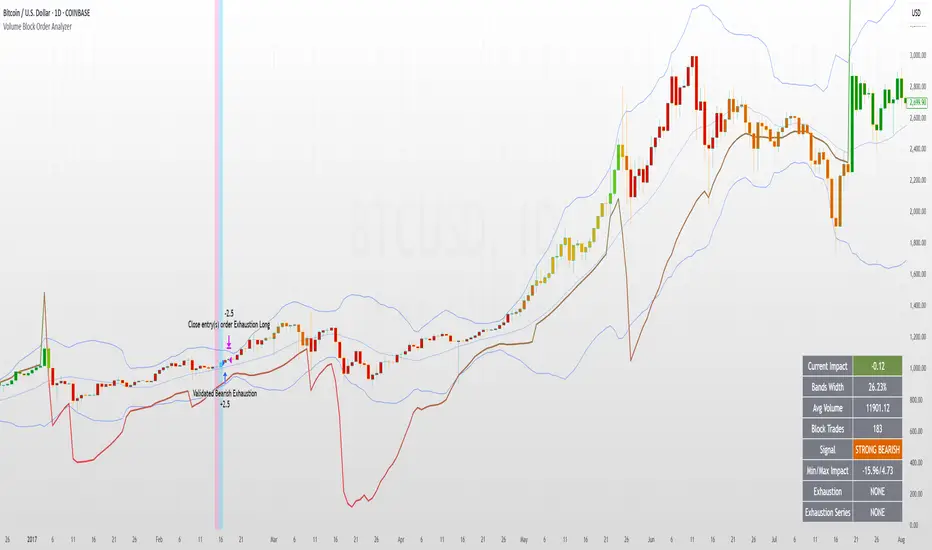
Strategy

Indicator

Options Series - NonOverlay_Technical
⭐ 1. Purpose:
The script is designed to show technical indicators in a non-overlay form using candlestick representations. It combines multiple popular technical analysis tools to gauge the market's bullish or bearish conditions.
⭐ 2. Indicators:
The script uses several indicators across different timeframes: Exponential Moving Averages (EMA) for 5, 20, 50 periods. Simple Moving Average (SMA) for 200 periods. RSI (Relative Strength Index) for momentum. VWAP (Volume Weighted Average Price) for average price evaluation. PSAR (Parabolic SAR) for trend direction. Daily and multi-day (2-day and 3-day) data for broader market context.
⭐ 3. Candlestick Representation:
The script uses color-coded candlesticks to visually represent various indicators and their bullish/bearish states: Green candlesticks for bullish conditions. Red candlesticks for bearish conditions. Neutral/transparent for non-significant conditions.
⭐ 4. Important Conditions:
It calculates bullish and bearish conditions for each indicator: MA20: When the price is above or below the 20-period EMA. RSI: When RSI is above or below 50. VWAP: When the price is above or below the VWAP. PSAR: When the price is above or below the PSAR. 2-day and 3-day Moving Averages: Evaluating the broader trend.
⭐ 5. Bullish vs. Bearish Calculation:
The script sums up bullish and bearish signals to determine the overall market condition: Current_logical_bull: Counts the number of bullish indicators. Current_logical_bear: Counts the number of bearish indicators. The script compares these values to conclude whether the market is more bullish or bearish.
⭐ 6. Visual Plotting:
The script uses plotcandle to display the non-overlay signals at different levels for each condition, stacked vertically from MA20 to PSAR. Additionally, a master candle combines all indicators to show an overall market trend.
⭐ 7. Neon Effect on MA20:
It adds a neon-like effect to the MA20 line, making it visually prominent: A standard plot line with the base color. Two additional neon layers with increasing transparency to enhance the effect.
⭐ 8. Daily Timeframes and Lookahead:
The script fetches daily data using the lookahead feature to get a broader view of the market trend. It tracks the previous day’s and two days' data for comparison.
⭐ 9. Labels and Customization:
The script dynamically adds labels to the chart for the different plotted indicators at the last bar, making it easier to identify which indicator is being represented.
🚀 Conclusion:
The script combines multiple technical indicators, such as EMA, RSI, VWAP, PSAR, and multi-day moving averages, to visually assess bullish and bearish market conditions. It uses color-coded candlesticks to represent each indicator and sums up the signals to determine the overall trend. Indicator

Indicator

Fisher Transform on RSIOverview
The Fisher Transform on RSI indicator combines the Relative Strength Index (RSI) with the Fisher Transform to offer a refined tool for identifying market turning points and trends. By applying the Fisher Transform to the RSI, this indicator converts RSI values into a Gaussian normal distribution, enhancing the precision of detecting overbought and oversold conditions. This method provides a clearer and more accurate identification of potential market reversals than the standard RSI.
Key/Unique Features
Fisher Transform Applied to RSI : Transforms RSI values into a Gaussian normal distribution, improving the detection of overbought and oversold conditions.
Smoothing : Applies additional smoothing to the Fisher Transform, reducing noise and providing clearer signals.
Signal Line : Includes a signal line to identify crossover points, indicating potential buy or sell signals.
Custom Alerts : Built-in alert conditions for bullish and bearish crossovers, keeping traders informed of significant market movements.
Visual Enhancements : Background color changes based on crossover conditions, offering immediate visual cues for potential trading opportunities.
How It Works
RSI Calculation : The indicator calculates the Relative Strength Index (RSI) based on the selected source and period length.
Normalization : The RSI values are normalized to fit within a range of -1 to 1, which is essential for the Fisher Transform.
Fisher Transform : The normalized RSI values undergo the Fisher Transform, converting them into a Gaussian normal distribution.
Smoothing : The transformed values are smoothed using a simple moving average to reduce noise and provide more reliable signals.
Signal Line : A signal line, which is a simple moving average of the smoothed Fisher Transform, is plotted to identify crossover points.
Alerts and Visuals : Custom alert conditions are set for bullish and bearish crossovers, and the background color changes to indicate these conditions.
Usage Instructions
Trend Identification : Use the Fisher Transform on RSI to identify overbought and oversold conditions with enhanced precision, aiding in spotting potential trend reversals.
Trade Signals : Monitor the crossovers between the smoothed Fisher Transform and the signal line. A bullish crossover suggests a potential buying opportunity, while a bearish crossover indicates a potential selling opportunity.
Alerts : Set custom alerts based on the built-in conditions to receive notifications when important crossover events occur, ensuring you never miss a trading opportunity.
Visual Cues : Utilize the background color changes to quickly identify bullish (green) and bearish (red) conditions, providing immediate visual feedback on market sentiment.
Complementary Analysis : Combine this indicator with other technical analysis tools and indicators to enhance your overall trading strategy and make more informed decisions.
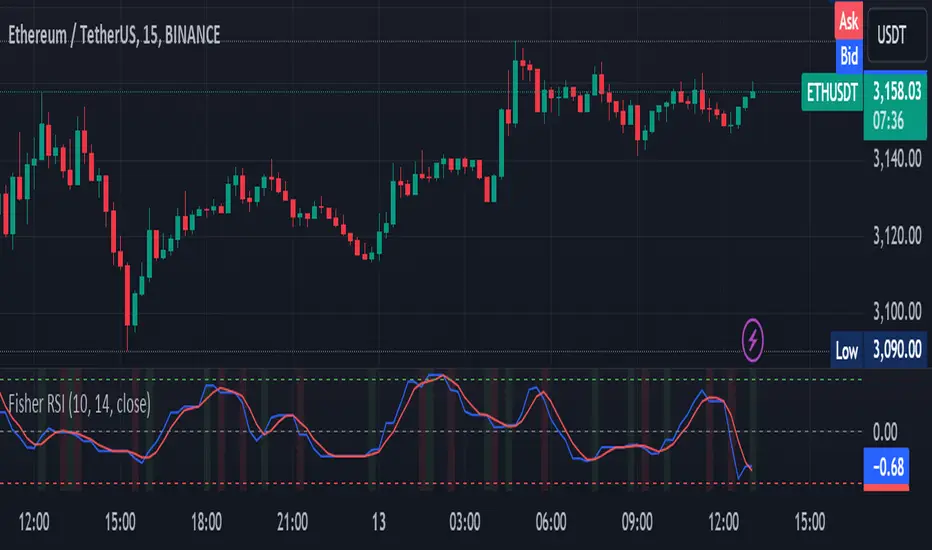
Indicator

Indicator