log.info() - 5 Exampleslog.info() is one of the most powerful tools in Pine Script that no one knows about. Whenever you code, you want to be able to debug, or find out why something isn’t working. The log.info() command will help you do that. Without it, creating more complex Pine Scripts becomes exponentially more difficult.
The first thing to note is that log.info() only displays strings. So, if you have a variable that is not a string, you must turn it into a string in order for log.info() to work. The way you do that is with the str.tostring() command. And remember, it's all lower case! You can throw in any numeric value (float, int, timestamp) into str.string() and it should work.
Next, in order to make your output intelligible, you may want to identify whatever value you are logging. For example, if an RSI value is 50, you don’t want a bunch of lines that just say “50”. You may want it to say “RSI = 50”.
To do that, you’ll have to use the concatenation operator. For example, if you have a variable called “rsi”, and its value is 50, then you would use the “+” concatenation symbol.
EXAMPLE 1
━━━━━━━━━━━━━━━━━━━━━━━━━━━━━━━━━
//@version=6
indicator("log.info()")
rsi = ta.rsi(close,14)
log.info(“RSI= ” + str.tostring(rsi))
Example Output =>
RSI= 50
Here, we use double quotes to create a string that contains the name of the variable, in this case “RSI = “, then we concatenate it with a stringified version of the variable, rsi.
Now that you know how to write a log, where do you view them? There isn’t a lot of documentation on it, and the link is not conveniently located.
Open up the “Pine Editor” tab at the bottom of any chart view, and you’ll see a “3 dot” button at the top right of the pane. Click that, and right above the “Help” menu item you’ll see “Pine logs”. Clicking that will open that to open a pane on the right of your browser - replacing whatever was in the right pane area before. This is where your log output will show up.
But, because you’re dealing with time series data, using the log.info() command without some type of condition will give you a fast moving stream of numbers that will be difficult to interpret. So, you may only want the output to show up once per bar, or only under specific conditions.
To have the output show up only after all computations have completed, you’ll need to use the barState.islast command. Remember, barState is camelCase, but islast is not!
EXAMPLE 2
━━━━━━━━━━━━━━━━━━━━━━━━━━━━━━━━━
//@version=6
indicator("log.info()")
rsi = ta.rsi(close,14)
if barState.islast
log.info("RSI=" + str.tostring(rsi))
plot(rsi)
However, this can be less than ideal, because you may want the value of the rsi variable on a particular bar, at a particular time, or under a specific chart condition. Let’s hit these one at a time.
In each of these cases, the built-in bar_index variable will come in handy. When debugging, I typically like to assign a variable “bix” to represent bar_index, and include it in the output.
So, if I want to see the rsi value when RSI crosses above 0.5, then I would have something like
EXAMPLE 3
━━━━━━━━━━━━━━━━━━━━━━━━━━━━━━━━━
//@version=6
indicator("log.info()")
rsi = ta.rsi(close,14)
bix = bar_index
rsiCrossedOver = ta.crossover(rsi,0.5)
if rsiCrossedOver
log.info("bix=" + str.tostring(bix) + " - RSI=" + str.tostring(rsi))
plot(rsi)
Example Output =>
bix=19964 - RSI=51.8449459867
bix=19972 - RSI=50.0975830828
bix=19983 - RSI=53.3529808079
bix=19985 - RSI=53.1595745146
bix=19999 - RSI=66.6466337654
bix=20001 - RSI=52.2191767466
Here, we see that the output only appears when the condition is met.
A useful thing to know is that if you want to limit the number of decimal places, then you would use the command str.tostring(rsi,”#.##”), which tells the interpreter that the format of the number should only be 2 decimal places. Or you could round the rsi variable with a command like rsi2 = math.round(rsi*100)/100 . In either case you’re output would look like:
bix=19964 - RSI=51.84
bix=19972 - RSI=50.1
bix=19983 - RSI=53.35
bix=19985 - RSI=53.16
bix=19999 - RSI=66.65
bix=20001 - RSI=52.22
This would decrease the amount of memory that’s being used to display your variable’s values, which can become a limitation for the log.info() command. It only allows 4096 characters per line, so when you get to trying to output arrays (which is another cool feature), you’ll have to keep that in mind.
Another thing to note is that log output is always preceded by a timestamp, but for the sake of brevity, I’m not including those in the output examples.
If you wanted to only output a value after the chart was fully loaded, that’s when barState.islast command comes in. Under this condition, only one line of output is created per tick update — AFTER the chart has finished loading. For example, if you only want to see what the the current bar_index and rsi values are, without filling up your log window with everything that happens before, then you could use the following code:
EXAMPLE 4
━━━━━━━━━━━━━━━━━━━━━━━━━━━━━━━━━
//@version=6
indicator("log.info()")
rsi = ta.rsi(close,14)
bix = bar_index
if barstate.islast
log.info("bix=" + str.tostring(bix) + " - RSI=" + str.tostring(rsi))
Example Output =>
bix=20203 - RSI=53.1103309071
This value would keep updating after every new bar tick.
The log.info() command is a huge help in creating new scripts, however, it does have its limitations. As mentioned earlier, only 4096 characters are allowed per line. So, although you can use log.info() to output arrays, you have to be aware of how many characters that array will use.
The following code DOES NOT WORK! And, the only way you can find out why will be the red exclamation point next to the name of the indicator. That, and nothing will show up on the chart, or in the logs.
// CODE DOESN’T WORK
//@version=6
indicator("MW - log.info()")
var array rsi_arr = array.new()
rsi = ta.rsi(close,14)
bix = bar_index
rsiCrossedOver = ta.crossover(rsi,50)
if rsiCrossedOver
array.push(rsi_arr, rsi)
if barstate.islast
log.info("rsi_arr:" + str.tostring(rsi_arr))
log.info("bix=" + str.tostring(bix) + " - RSI=" + str.tostring(rsi))
plot(rsi)
// No code errors, but will not compile because too much is being written to the logs.
However, after putting some time restrictions in with the i_startTime and i_endTime user input variables, and creating a dateFilter variable to use in the conditions, I can limit the size of the final array. So, the following code does work.
EXAMPLE 5
━━━━━━━━━━━━━━━━━━━━━━━━━━━━━━━━━
// CODE DOES WORK
//@version=6
indicator("MW - log.info()")
i_startTime = input.time(title="Start", defval=timestamp("01 Jan 2025 13:30 +0000"))
i_endTime = input.time(title="End", defval=timestamp("1 Jan 2099 19:30 +0000"))
var array rsi_arr = array.new()
dateFilter = time >= i_startTime and time <= i_endTime
rsi = ta.rsi(close,14)
bix = bar_index
rsiCrossedOver = ta.crossover(rsi,50) and dateFilter // <== The dateFilter condition keeps the array from getting too big
if rsiCrossedOver
array.push(rsi_arr, rsi)
if barstate.islast
log.info("rsi_arr:" + str.tostring(rsi_arr))
log.info("bix=" + str.tostring(bix) + " - RSI=" + str.tostring(rsi))
plot(rsi)
Example Output =>
rsi_arr:
bix=20210 - RSI=56.9030578034
Of course, if you restrict the decimal places by using the rounding the rsi value with something like rsiRounded = math.round(rsi * 100) / 100 , then you can further reduce the size of your array. In this case the output may look something like:
Example Output =>
rsi_arr:
bix=20210 - RSI=55.6947486019
This will give your code a little breathing room.
In a nutshell, I was coding for over a year trying to debug by pushing output to labels, tables, and using libraries that cluttered up my code. Once I was able to debug with log.info() it was a game changer. I was able to start building much more advanced scripts. Hopefully, this will help you on your journey as well.
Tutorial

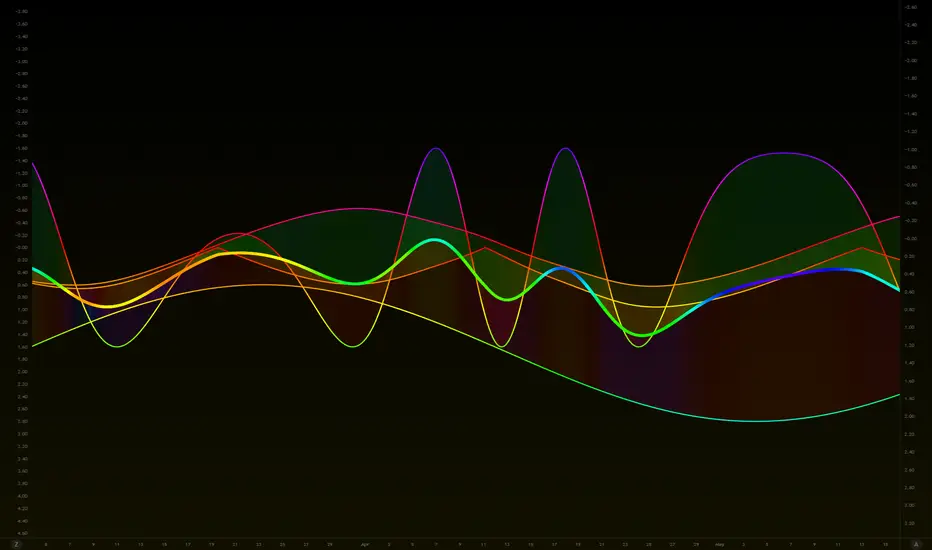
Wave Modulation Demo█ OVERVIEW
This script demonstrates Stacked Wave Modulation by visualizing four interconnected waves. Wave 1 is the base wave, influencing Wave 2's frequency, which in turn modulates Wave 3's amplitude, and finally, Wave 3 modulates Wave 4's phase. Explore the fascinating effects of wave modulation by adjusting the inputs for each wave and their modulation scales.
══════════════════════════════════════════════════
█ CONCEPTS
This script visualizes a cascade of wave modulations:
1 — Base Wave (Wave 1): This is the foundational wave. Its parameters (type, frequency, amplitude, phase, vertical shift) are directly controlled and serve as the basis for subsequent modulations.
2 — Frequency Modulation (Wave 2): Wave 2's frequency is modulated by Wave 1 . As Wave 1 oscillates, it dynamically changes the frequency of Wave 2 , creating interesting frequency variations. The Frequency Mod Scale input controls the intensity of this modulation.
3 — Amplitude Modulation (Wave 3): Building upon the cascade, Wave 3 's amplitude is modulated by Wave 2 . The peaks and troughs of Wave 2 influence the amplitude of Wave 3 , resulting in amplitude variations. The Amplitude Mod Scale input adjusts the strength of this amplitude modulation.
4 — Phase Modulation (Wave 4): Finally, Wave 4 's phase is modulated by Wave 3 . Wave 3 's oscillations shift the phase of Wave 4 , leading to phase-related distortions and dynamic wave patterns. The Phase Mod Scale input determines the extent of phase modulation.
5 — Stacked Wave (Average): The script calculates and plots the average of all four waves, providing a composite view of the combined modulation effects.
══════════════════════════════════════════════════
█ FEATURES
The script is organized into input groups for each wave, allowing for detailed customization:
1 — Wave 1: Base Wave
• Type : Select the waveform type for Wave 1 (Sine, Cosine, Triangle, Square).
• Frequency (Hz) : Sets the base frequency of Wave 1 in Hertz (cycles per second).
• Amplitude : Controls the vertical amplitude or height of Wave 1.
• Phase Shift (deg) : Adjusts the phase shift of Wave 1 in degrees, shifting the wave horizontally.
• Vertical Shift : Sets the vertical position of Wave 1 on the chart.
2 — Wave 2: Frequency Modulation
• Type : Select the waveform type for Wave 2.
• Base Frequency (Hz) : Sets the base frequency of Wave 2, before modulation.
• Amplitude : Controls the amplitude of Wave 2.
• Phase Shift (deg) : Adjusts the phase shift of Wave 2.
• Vertical Shift : Sets the vertical position of Wave 2.
• Frequency Mod Scale : Determines the degree to which Wave 1 modulates Wave 2's frequency. Higher values increase the modulation effect.
3 — Wave 3: Amplitude Modulation
• Type : Select the waveform type for Wave 3.
• Base Frequency (Hz) : Sets the base frequency of Wave 3.
• Amplitude : Controls the base amplitude of Wave 3, before modulation.
• Phase Shift (deg) : Adjusts the phase shift of Wave 3.
• Vertical Shift : Sets the vertical position of Wave 3.
• Amplitude Mod Scale : Determines the degree to which Wave 2 modulates Wave 3's amplitude. Higher values increase the modulation effect.
4 — Wave 4: Phase Modulation
• Type : Select the waveform type for Wave 4.
• Base Frequency (Hz) : Sets the base frequency of Wave 4.
• Amplitude : Controls the amplitude of Wave 4.
• Phase Shift (deg) : Sets the base phase shift of Wave 4, before modulation.
• Vertical Shift : Sets the vertical position of Wave 4.
• Phase Mod Scale : Determines the degree to which Wave 3 modulates Wave 4's phase. Higher values increase the modulation effect.
══════════════════════════════════════════════════
█ HOW TO USE
1. Add the "Stacked Wave Modulation Demo" script to your TradingView chart.
2. Explore the input settings. Each wave has its own group of customizable parameters.
3. Adjust the Type , Frequency , Amplitude , Phase Shift , and Vertical Shift for each wave to define their base characteristics.
4. Experiment with the modulation scales ( Frequency Mod Scale , Amplitude Mod Scale , Phase Mod Scale ) to control the intensity of the modulation effects between the waves.
5. Observe how the waves interact and how the modulations shape their forms and the final stacked wave (average).
══════════════════════════════════════════════════
█ NOTES
* This script utilizes the `waves` and `hsvColor` libraries. Look for other scripts on my profile.
* The frequencies are set in Hertz (cycles per second), which relate to bars on the chart. A frequency of 0.5 Hz means 0.5 cycles per bar, or 1 cycle every 2 bars.
* Adjusting the modulation scales allows you to fine-tune the visual impact of the modulation effects.
* The color of each wave plot is dynamically generated based on its value using the HSV color model for visual distinction.
* Feel free to modify and experiment with the script to create different modulation schemes or stacking methods.
Let me know if you have any other questions or would like further refinements!
Tutorial - Adding sessions to strategiesA simple script to illustrate how to add sessions to trading strategies.
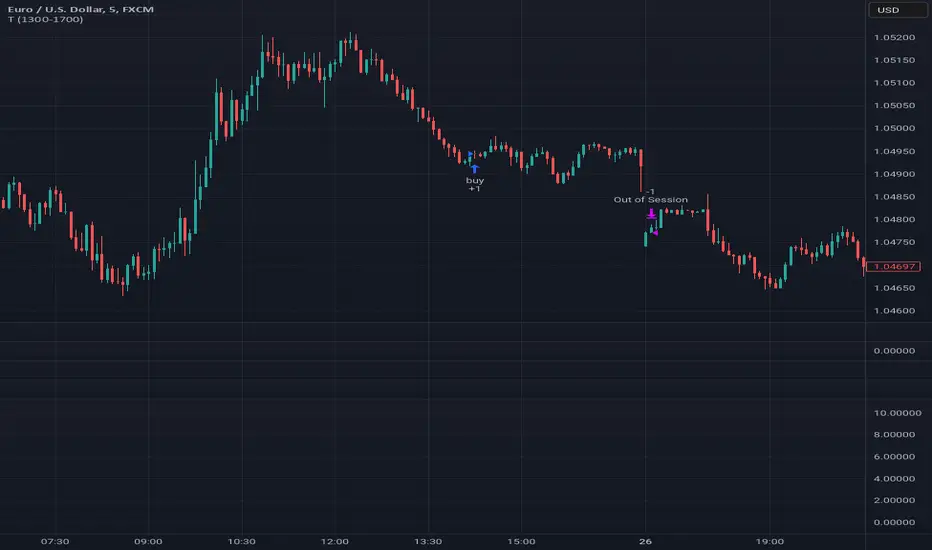
In this interactive tutorial, you'll learn how to add trading sessions to your strategies using Pine Script. By the end of this session (pun intended!), you'll be able to create custom trading windows that adapt to changing market conditions.
What You'll Learn:
Defining Trading Sessions: Understand how to set up specific time frames for buying and selling, tailored to your unique trading style.
RSI-Based Entry Signals: Discover how to use the Relative Strength Index (RSI) as a trigger for buy and sell signals, helping you capitalize on market trends.
Combining Session Logic with Trading Decisions: Learn how to integrate session-based logic into your strategy, ensuring that trades are executed only during designated times.
By combining these elements, we create an interactive strategy that:
1. Generates buy and sell signals based on RSI levels.
2. Checks if the market is open during a specific trading session (e.g., 1300-1700).
3. Executes trades only when both conditions are met.
**Tips & Variations:**
* Experiment with different RSI periods, thresholds, and sessions to optimize your strategy for various markets and time frames.
* Consider adding more advanced logic, such as stop-losses or position sizing, to further refine your trading approach.
Get ready to take your Pine Script skills to the next level!
~Description partially generated with Llama3_8B
How To Color Prior BarsExample how to color the trigger bar of the condition and n-1 prior bars using only 1 barcolor() function.
Currently when offsets are used in barcolor(), bgcolor(), plot(), plotarrow(), plotchar(), or plotshape(), the offset only works with a simple (static) integer. If series (dynamic) integers are used instead, there is not an error, but the series values are ignored. Because of this limitation of offset being constrained to using only fixed offsets, the normal way to paint 3 Black Crows would be to use 3 barcolor() functions. Since there are a known number of bars to be painted in that scenario, this can be easily accomplished.
If a condition encompassed a variable length of n bars, then the number of barcolor() functions needed to use would be unknown. How to color the trigger bar of the condition and n-1 prior bars using only 1 barcolor() function? Dual examples below solves issue but requires n "future" bars, because of this it will not paint the most recent condition in realtime and may not be applicable for use in certain realtime situations. It paints similar in behavior to how a pivot does. Special thanks to LucF and RicardoSantos for illumination!
NOTICE: This is an example script and not meant to be used as an actual strategy. By using this script or any portion thereof, you acknowledge that you have read and understood that this is for research purposes only and I am not responsible for any financial losses you may incur by using this script!

How To Input CSV List Of Symbol Data Used For ScreenerExample of how to input multiple symbols at once using a CSV list of ticker IDs. The input list is extracted into individual ticker IDs which are then each used within an example screener function that calculates their rate of change. The results for each of the rate of changes are then plotted.
For code brevity this example only demonstrates using up to 4 symbols, but the logic is annotated to show how it can easily be expanded for use with up to 40 ticker IDs.
The CSV list used for input may contain spaces or no spaces after each comma separator, but whichever format (space or no space) is used must be used consistently throughout the list. If the list contains any invalid symbols the script will display a red exclamation mark that when clicked will display those invalid symbols.
If more than 4 ticker IDs are input then only the first 4 are used. If less than 4 ticker IDs are used then the unused screener calls will return `float(na)`. In the published chart the input list is using only 3 ticker IDs so there are only 3 plots shown instead of 4.
NOTICE: This is an example script and not meant to be used as an actual strategy. By using this script or any portion thereof, you acknowledge that you have read and understood that this is for research purposes only and I am not responsible for any financial losses you may incur by using this script!

How To Limit Repeating SignalsAn example of how to limit the input number of allowed signals using a function containing a condition counter with a reset.

Light or Dark Mode Tutorial - Luminance DetectionAs a colorblind trader, I think accessibility is a big deal. This script auto detects the chart background color and optimizes text color based on luminance.
Luminance detection is based on pine script new chart.bg_color feature, allowing lines, tables, etc to be optimized. Thanks to TV team for releasing this in the latest update/blog post today! This makes it simple to optimize scripts based off the knowledge that max luminance = 765 (rgb 255 + 255 + 255), thus we know that lum <= 383 is "dark mode" and lum > 383 is "light mode".
Try changing the chart background color and see how this script changes the table printed on the chart. I hope more script authors will begin to utilize this concept and that even better contrast detection may be built future pine script iterations.

Invisible FriendLooking into a question from user Alex100, i realized many people do want some kind of values displayed on chart when they hover the mouse over different bars.
As pinescript does not have any feature like pop up box, the only way is to plot a line and than see indicator values at top left. So when mouse is moved around the value displayed changes. As we just need the value, we do not want to clutter the chart with another line.
Using display.none will hide the value from indicator value also
Using color.white will also color the indicator value to white, making it invisible
So the solution is very simple, and requires a bit of creativity. We create an invisible line, in any color we like :)
This indicator is a tutorial on how to display indicator values without the line showing up and also this can be implemented as displaying data for each bar on mouse hover.
-----
Check My Public Creations In The Meantime:
Buy Monday Exit Tuesday with StopLoss and TakeProfit
Close Combination Lock Style Visual Appeal Indicator
High-Low Box between Earnings with ability to Add Custom Boxes

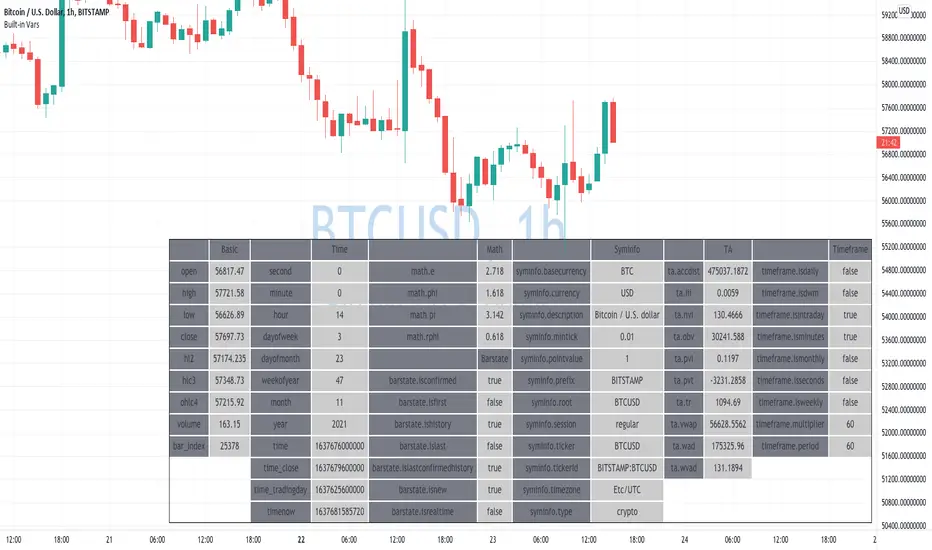
Learning Built-in VarsI'm currently working on v5 of my Pine Script Programming Course.
As a part of it, I'm building a few tools/widgets to help students get the content easier.
Here is one of the tools. It's quite basic with it you can select a bar and see all the build-in variables for this bar (Except strategy variables)
I hope it will help you in learning Pine Script!
Disclaimer
Please remember that past performance may not be indicative of future results.
Due to various factors, including changing market conditions, the strategy may no longer perform as well as in historical backtesting.
This post and the script don’t provide any financial advice.
Example - MA-Cross Retracement DetectionThe retracement tracker function(s) in this script outline how to:
Track conditions using "toggle" booleans.
Use multiple coinciding conditions to trigger an event just once.
What is a retracement?
"Retracements are temporary price reversals that take place within a
larger trend. The key here is that these price reversals are temporary
and do not indicate a change in the larger trend."
Quote Source: www.investopedia.com

Example - HTF Values Without 'Security()'This is an example of how to reference higher timeframe data without the
need for a 'security()' call.
I have attempted to create the function example:
f_insecurity()
with the purpose of wrapping up and pumping out all common relevent HTF
price data that's needed for your everyday indicators in a reliable fashion.

EMA Crossover Strategy ExampleThis is a script written as an example of how to build a simple strategy with user-defined inputs based on a simple Moving Average crossover.
--
This indicator is used for backtesting Moving Average crossover strategies (only for long trades).
A "short" and "long" moving average period and calculation method (the "smoothing type") are user-adjustable. The trade is triggered when the "short" moving average crosses over the "long" moving average.
A third customizable moving average is provided which is used as a trigger to exit the trade when the *close* of a candle crosses below this "exit" moving average. Again the period and smoothing type are user-adjustable.

CC - Array-meta Consolidated Interval Display (ACID)This script extends my other two Array examples (which I've also provided to you open source):
The Ticker-centric 5m,15m,45m,1h,4h,1d resolution labels using arrays:
And the more Macro VIX,GLD,TLT,QQQ,SPY,IWM 1d resolution labels using arrays:
This script aims to show how to use min/max/avg with Arrays easily. My next example after this will be exploring the usage of variance versus covariance ratios over different periodic interval resolutions. Currently, this is using the following intervals: 5m,15m,45m,1h,4h,1d. It takes these intervals, calculates the values at those resolutions and puts the absolute min and max from the 5 minute to the 1 day resolutions.
It's more of an example of the power that arrays can hold, as all this truly is right now is a min/max bound calculator. The real gem lies in the avg calculators for multiple resoltuions tied into a single label with readable data. Check out the code and let me know what you think. If you need more examples, the other two scripts I mentioned before are also open source.
Using this on intervals of less than 1D sometimes times out, the way I wrote it is memory intensive, may not work for non-pro users.
Thanks!
NONE OF THIS IS FOREWARD LOOKING STATEMENTS, THIS IS NOT A PREDECTIVE ANALYSIS TOOL. THIS IS A RESEARCH ATTEMPT AT A NOVEL INDICATOR. I am not responsible for outcomes using it.
Please use and give criticisms freely. I am experimenting with combining resolutions and comparing covariance values at different levels right now, so let me know your thoughts! The last indicator will likely not be open source, but may be depending on how complex I get.

CC - Macro Consolidated Interval Display (MCID)Ever wish you didn't have to rapidly flip between 6 different tickers to get the full picture?
Yeah, me too. Do you also wish that you kind of understood how the shift / unshift function works for arrays?
Yeah, I did too. Both of those birds are taken care of with one stone!
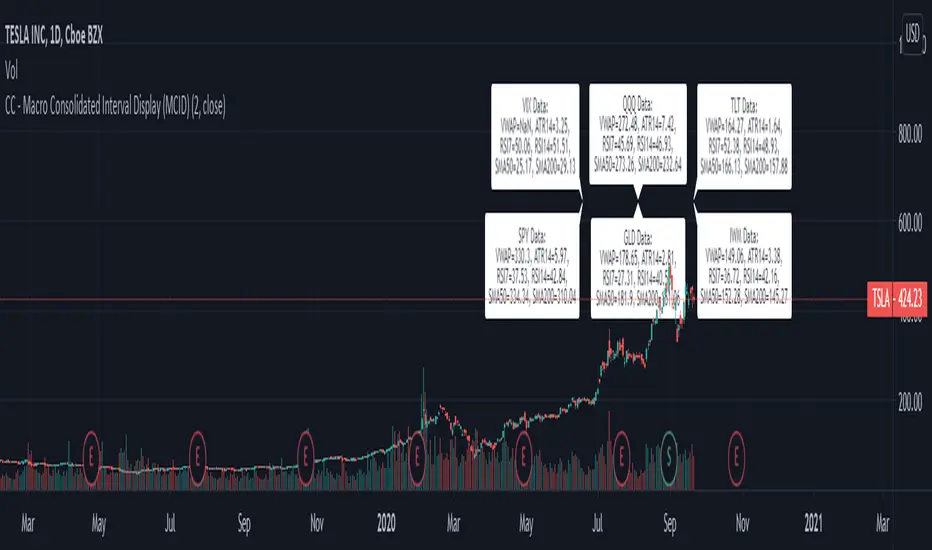
The Macro Consolidated Interval Display uses the new Array structure and security to display data for VIX, GLD, TLT, QQQ, SPY and IWM (at a 1D interval) SIMUTANEOUSLY! Regardless of which ticker you're looking at you can get the full picture of macro futures data without flipping around to get it.
This is my first script trying to use arrays. It basically shows the following a 1d interval:
ATR14, RSI7, RSI14, SMA50, SMA200 and VWAP for VIX.
ATR14, RSI7, RSI14, SMA50, SMA200 and VWAP for GLD.
ATR14, RSI7, RSI14, SMA50, SMA200 and VWAP for TLT.
ATR14, RSI7, RSI14, SMA50, SMA200 and VWAP for QQQ.
ATR14, RSI7, RSI14, SMA50, SMA200 and VWAP for SPY.
ATR14, RSI7, RSI14, SMA50, SMA200 and VWAP for IWM
To make it more or less busy, I've allowed you to toggle off any of the levels you wish. I've also chosen to leave this as open source, as it's nothing too experimental, and I hope that it can gain some traction as an Array example that the public can use! If you don't like the different values that are shown, use this source code example as a spring-board to put values that you do care about onto the labels.
If this code has helped you at all please drop me a like or some constructive criticism if you do not think it's worth a like.
Good luck and happy trading friends. This should be compatible with my CID as well:
If this gets traction, I will post something similar for a dynamic combination of tickers and intervals that you can set yourself.
CC - Consolidated Interval Display (CID)Ever wish you didn't have to rapidly flip between 6 different intervals to get the full picture?
Yeah, me too. Do you also wish that you kind of understood how the shift / unshift function works for arrays?
Yeah, I did too. Both of those birds are taken care of with one stone!
The Consolidated Interval Display uses the new Array structure and security to display data for 5m, 15m, 45m, 1h, 4h and 1d intervals SIMUTANEOUSLY! Regardless of which interval you're looking at you can get the full picture of numerical data without flipping around to get it.
This is my first script trying to use arrays. It basically shows the following for the given ticker:
ATR14, RSI7, RSI14, SMA50, SMA200 and VWAP at the 5 minute level.
ATR14, RSI7, RSI14, SMA50, SMA200 and VWAP at the 15 minute level.
ATR14, RSI7, RSI14, SMA50, SMA200 and VWAP at the 45 minute level.
ATR14, RSI7, RSI14, SMA50, SMA200 and VWAP at the 1 hour level.
ATR14, RSI7, RSI14, SMA50, SMA200 and VWAP at the 4 hour level.
ATR14, RSI7, RSI14, SMA50, SMA200 and VWAP at the 1 day level.
To make it more or less busy, I've allowed you to toggle off any of the levels you wish. I've also chosen to leave this as open source, as it's nothing too experimental, and I hope that it can gain some traction as an Array example that the public can use! If you don't like the different values that are shown, use this source code example as a spring-board to put values that you do care about onto the labels.
If this code has helped you at all please drop me a like or some constructive criticism if you do not think it's worth a like.
Good luck and happy trading friends.
If this gets traction, I will post something similar for a combination of SPY, VIX, GOLD, QQQ, IWM and TLT.

Simple Study for Sean (threshold-triggered alert)This script illustrates how to create simple alerts, triggered by a share price moving above (or below) an arbitrary threshold.

Heikin-Ashi Source Function HTFHigher TimeFrame using custom source function for toggling traditional Candle sources or Heikin-Ashi sources on a traditional Candles chart.
Thanks to PineCoders for rounding method: www.pinecoders.com
Thanks to @LucF and @RicardoSantos for their advice and enlightenment as always.
NOTICE: This is an example script and not meant to be used as an actual strategy. By using this script or any portion thereof, you acknowledge that you have read and understood that this is for research purposes only and I am not responsible for any financial losses you may incur by using this script!
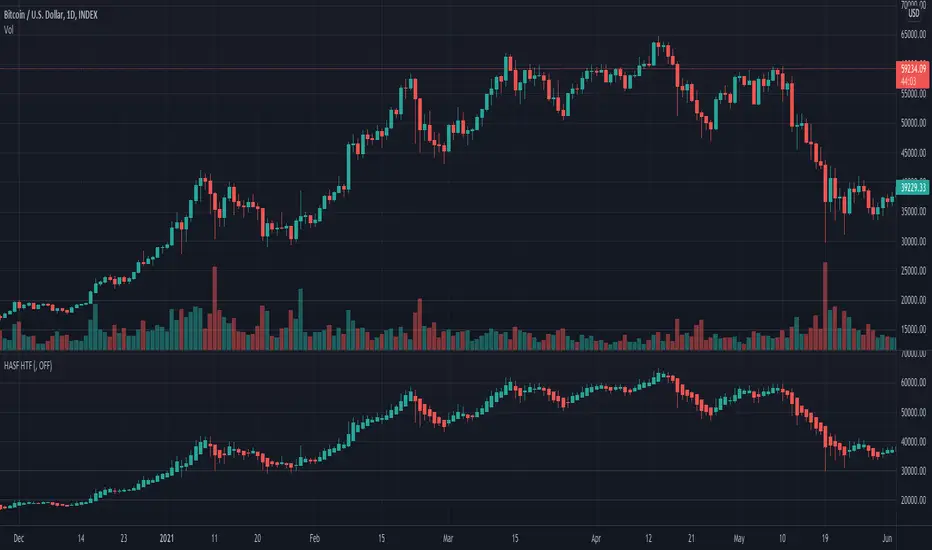
How To Show Vertical LinesExample of various methods to show dashed or solid vertical lines on chart based on using either session or time.
Credit for line method goes to midtownsk8rguy ->
Credit for plot method goes to PineCoders -> www.pinecoders.com
Special thanks to LucF, midtownsk8rguy, and PineCoders for permission to use their work.
NOTICE: This is an example script and not meant to be used as an actual strategy. By using this script or any portion thereof, you acknowledge that you have read and understood that this is for research purposes only and I am not responsible for any financial losses you may incur by using this script!

How To Limit n Round Trips Per Day [Alerts]Example how to limit the number of round trips per day. If entry condition is never met logic will force a round trip at end of day. Set chart to a timeframe that is lower than 1 Day period.
NOTICE: This is an example script and not meant to be used as an actual strategy. By using this script or any portion thereof, you acknowledge that you have read and understood that this is for research purposes only and I am not responsible for any financial losses you may incur by using this script!

Heikin-Ashi Source FunctionCustom source function for toggling traditional Candle sources or Heikin-Ashi sources on a traditional Candles chart.
Thanks to PineCoders for rounding method: www.pinecoders.com
Thanks to @LucF and @RicardoSantos for their advice and enlightenment as always.
NOTICE: This is an example script and not meant to be used as an actual strategy. By using this script or any portion thereof, you acknowledge that you have read and understood that this is for research purposes only and I am not responsible for any financial losses you may incur by using this script!
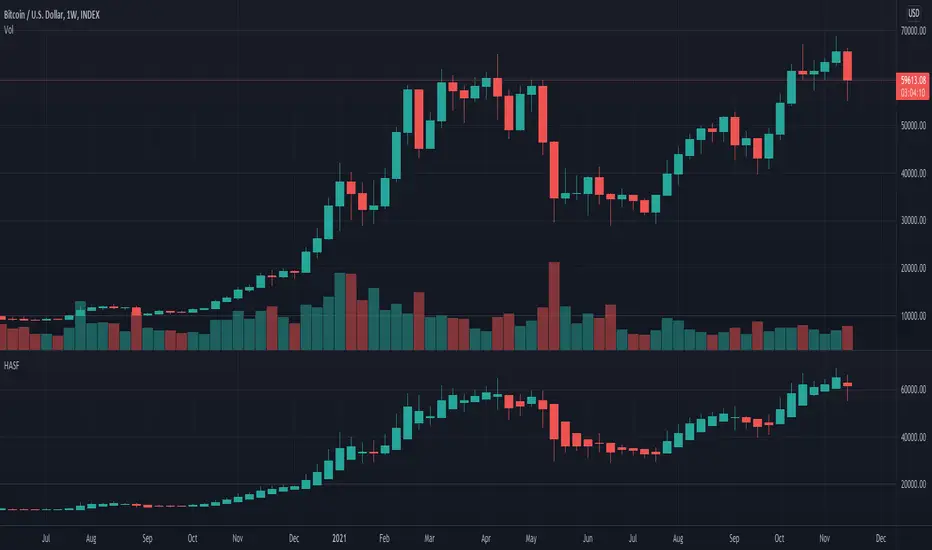
How to Overlay First LTF Bar of DayExample how to overlay the first lower timeframe bar of the day across the entire day. Set chart to a timeframe that is lower than 1 Day period. Also included option for coloring wick pressure of that bar.
NOTICE: This is an example script and not meant to be used as an actual strategy. By using this script or any portion thereof, you acknowledge that you have read and understood that this is for research purposes only and I am not responsible for any financial losses you may incur by using this script!
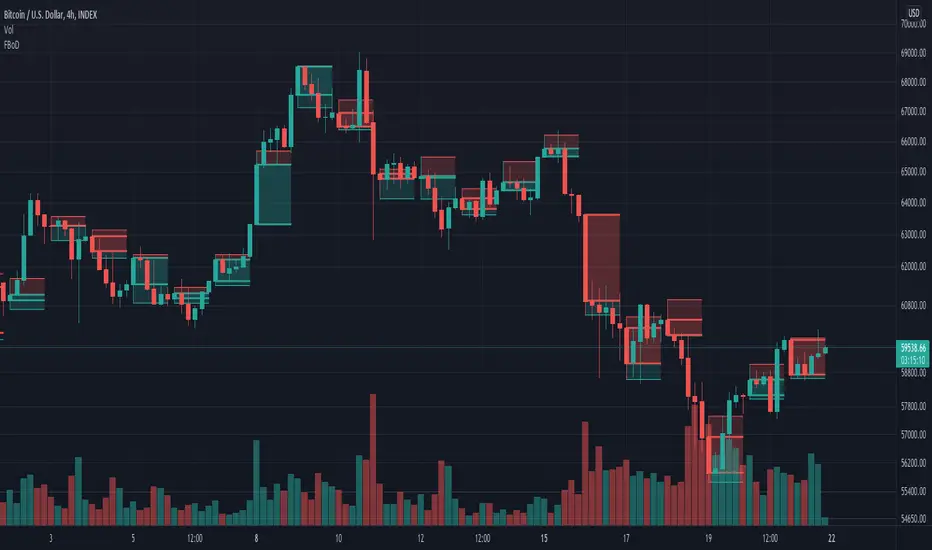
Growing or Waning Patterns [Alerts]Example how to color patterns of 3 bodies growing or waning by percentage with or without trend. Also included option for alert triggers. The yellow triangles on the chart denote where the alert triggers will fire.
• Choose Pattern Of Filter: shows bodies growing or waning or both.
• Sample Lengths Of AvgBar: number of recent bars to use for average size.
• BigBar Is Min% Of AvgBar: the minimum percent of average the big bar must be.
• MedBar Is Max% Of BigBar: the maximum percent of big bar the medium bar can be.
• SmlBar Is Max% Of MedBar: the maximum percent of medium bar the small bar can be.
• Repeat Pattern If n Bars: the number of bars to ignore repeat patterns, 1 allows all.
• Trending: on requires the growing or waning patterns to also be trending.
• GrayBars: colors non pattern bodies gray.
NOTICE: This is an example script and not meant to be used as an actual strategy. By using this script or any portion thereof, you acknowledge that you have read and understood that this is for research purposes only and I am not responsible for any financial losses you may incur by using this script!

How To Set Backtest Time Ranges
Example how to set the time range window to be backtested for both entries and exits. Additional examples are also included showing how to set the date range and toggle plot visibility.
By incorporating this code with your own strategy's logic, it will allow you to backtest various time windows.
Much gratitude to @LucF and @a.tesla2018 for help with including ':1234567' for time ranges on weekends. Thank you both!
NOTICE: This is an example script and not meant to be used as an actual strategy. By using this script or any portion thereof, you acknowledge that you have read and understood that this is for research purposes only and I am not responsible for any financial losses you may incur by using this script!


Scoring Development Sample [BigBitsIO]This script shows a sample of how to do confidence weighted scoring indicators and for loops with Pine. This indicator may or may not be found useful, it's intent is to provide a sample on how to create such an indicator and use certain Pine features.
Features:
- Defined points based on the confidence of RSI and Stochastic indicator
- Defined points based on candle color and sma trend direction
- For loops used to calculate bonus points for "extended periods" of confidence.
*** DISCLAIMER: For educational and entertainment purposes only. Nothing in this content should be interpreted as financial advice or a recommendation to buy or sell any sort of security or investment including all types of crypto. DYOR, TYOB. ***
