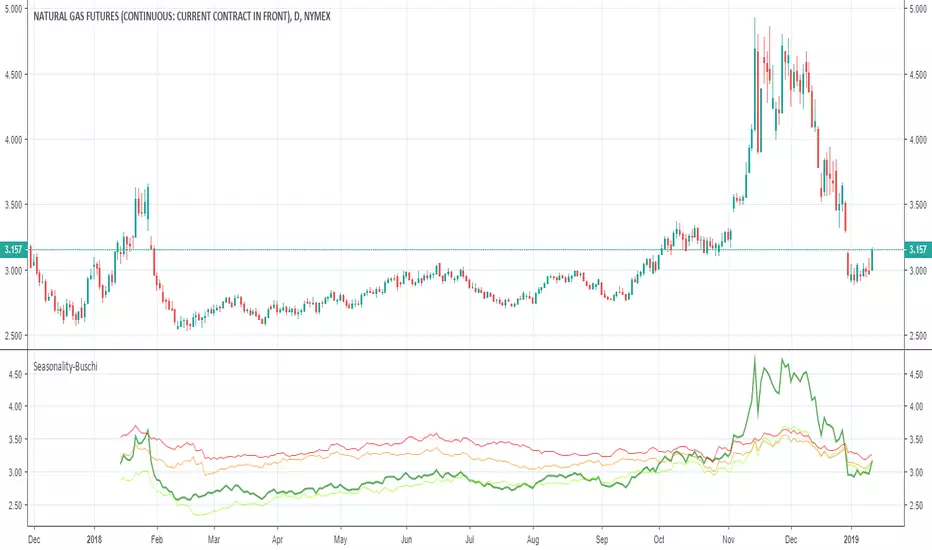
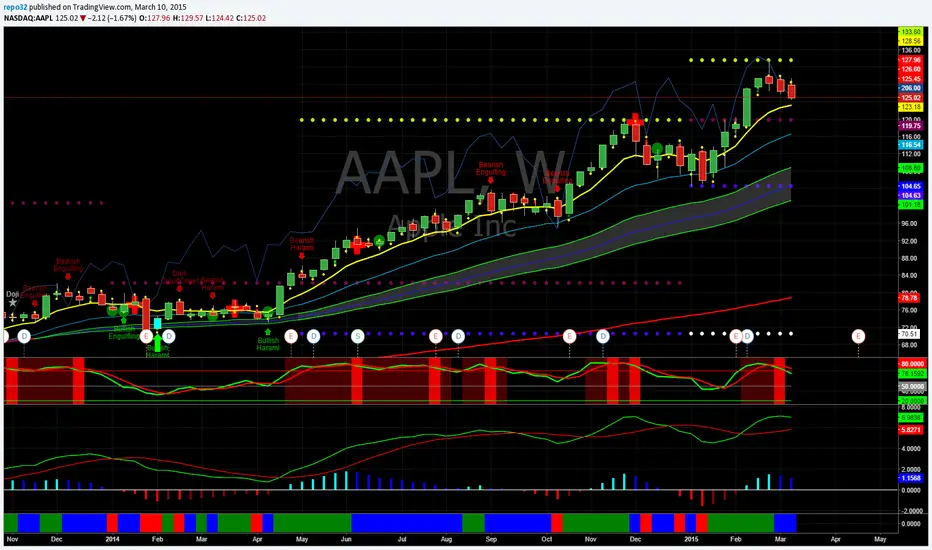
2-Year Moving Average Multiplier
2-Year Moving Average Multiplier is a long-term trend and valuation overlay for your chart.
It plots a 2-year (730-day) SMA as a lower band and a multiplier line as an upper band to form a reference channel. Price inside the band is normal. Price above the upper band triggers a red fill (overextended). Price below the lower band triggers a green fill (potentially undervalued).
───────────────────
HOW IT WORKS
Three lines are drawn on your chart:
Lower Band (green) is a 730-day Simple
Indicator