Periodic Volume Profile
Definition
Periodic Volume Profile (PVP) indicator calculates a sequence of volume profiles that provide an indication of the distribution of volume across various price levels within specific periods. The periods are dictated by the indicator's inputs.
Note: you can read more about traits shared by all Volume Profile indicators in the Volume Profile Indicators: basic concepts Help Center article. The text below describes features unique to this particular Volume Profile indicator.Calculation
To calculate Periodic Volume Profile, the indicator uses a table that selects a lower timeframe based on the timeframe currently selected on the chart:
Chart resolution | Lower timeframe used for the VP calculation | Depth ratio |
1S, 5S, 10S | 1S | 1 |
15S | 5S | 3 |
30S | 15S | 2 |
1 - 4 | 1 | 1 |
5 - 15 | 1 | 3 |
16 - 30 | 5 | 3 |
31 - 60 | 10 | 3 |
61 - 120 | 15 | 4 |
121 - 240 | 30 | 4 |
241 and more | 60 | 4 |
The following logic is used to calculate how far in the past the volume profiles will be drawn:
1. From the table above, select the lower timeframe based on the timeframe on the chart. Data from this lower timeframe will be used to calculate Volume Profile.
2. Use the number of historical bars available for calculation based on your subscription level and multiply it by the appropriate depth ratio.
3. The resulting number shows you how many lower timeframe bars will be available for the indicator.
For example, a Premium user has a limit of historical 20000 bars shown on the chart at the same time. If the chart is open on a "60" timeframe, the indicator will load 20000 * 3 (depth ratio) = 60000 10-minute bars. As there are six 10-minute bars in one 60-m bar, the indicator will be able to build volume profiles for the last 10000 bars on the 60m chart. As you go deeper into the past of the symbol, you might eventually hit a point where there are no more lower timeframe bars, and the indicator will stop calculating.
Note that:
- The total limit of histogram rows is always under 6,000. So if each profile has 100 rows, the indicator will not draw more than 60 of these, even if there is still data available on lower timeframes.
- Profiles are aligned by the beginning of the year. Each Volume Profile will stop calculating at the end of the year, and will start over again from the new year, even if the Period setting is set to work otherwise. This is necessary to maintain consistency when building profiles on different timeframes.
Inputs
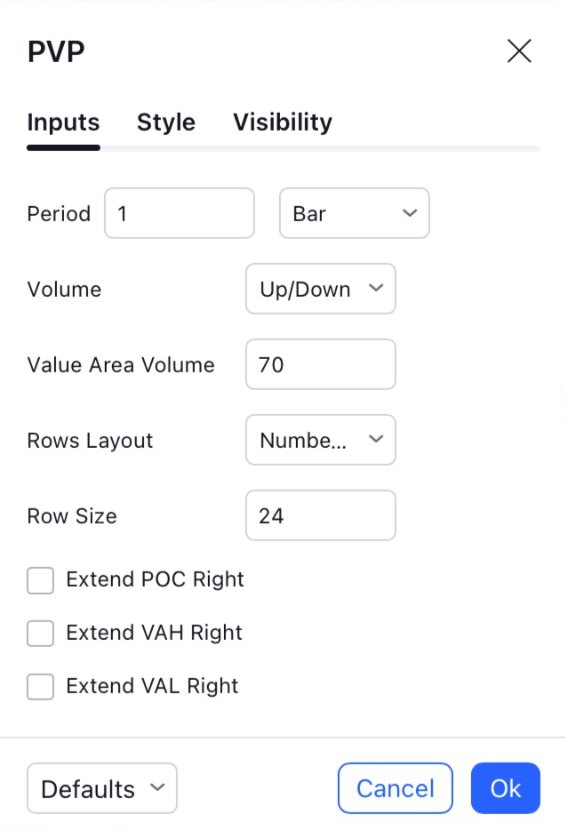
Period
Sets the period for which the indicator builds the volume profile, one profile for each new period. The period multiplier is set in the first field, and the period itself, which can take the values "Bar", "Minute", "Hour", "Day", "Week" or "Month", is set in the second field.
Volume
Toggles between showing total volume for each row (Total), splitting each row into up/down (Up/Down), or showing their difference (Delta).
Value Area Volume
Specifies what percentage of all volume for the trading session should be highlighted by Value Area.
Rows Layout / Row Size
These two inputs specify the way the indicator calculates how many rows each histogram will have.
If Rows Layout is set to “Number of Rows”, Row Size sets the total number of rows in the histogram: for example, with Row Size of 25 the histogram, top to bottom, will have 25 rows. The height of each row will be calculated automatically; in the example above, a Volume Profile histogram spanning the price from 200 to 300 will have (300 - 200) / 25 = 4 points per each row.
If this input is set to “Ticks Per Row”, Row Size indicates the number of ticks in each single row (1 tick being the minimal move the price for this symbol can make: for example, for NASDAQ:AAPL, 1 tick is 0.01 because the price needs to move at least 0.01 USD, i.e. 1 cent). E.g., setting it to 25 will mean that each row has the height of 25 ticks. In that case, the number of rows will be calculated automatically, and the Volume Profile histogram spanning the price from 200 to 300 for a symbol with a mintick of 0.01 will have (300 - 200) / 0.01 / 25 = 400 rows per each histogram.
Extend POC Right
Extends the Point of Control line until it crosses any bar.
Extend VAH Right
Extends the Value Area High line until it crosses any bar.
Extend VAL Right
Extends the Value Area Low line until it crosses any bar.