Auto Anchored Volume Profile
Definition
Auto Anchored Volume Profile (AAVP) indicator automatically determines the most important price points and volume levels depending on the current chart timeframe and calculates a volume profile for these points. This can help traders simply identify significant support and resistance levels as well as areas of high liquidity.
Note: you can read more about traits shared by all Volume Profile indicators in the Volume Profile Indicators: basic concepts Help Center article. The text below describes features unique to this particular Volume Profile indicator.Calculation
When calculating Auto Anchored Volume Profile, we check a list of timeframes in a sequence until the number of bars in the time interval for which VP is calculated will be fewer than 5000. The sequence of timeframes is: 1, 5, 15, 30, 60, 240, 1D.
Note: On Futures and Spread charts, Volume Profiles is calculated not by requesting a timeframe with fewer than 5000 bars, but by using a timeframe one step lower than the current one based on the timeframe list above. The exception is all second-based timeframes, which always use 1S data.Consider the following example. The AAVP indicator is set to reset the calculation once per week on a symbol that is traded 24x7 (for the sake of the experiment, let's assume there are no gaps where no trades were happening and each minute of every week has a bar associated with it).
- First, the indicator first checks the "1" timeframe, sees that the 1m chart for this symbol has 7D * 1440m = 10080 bars of 1m data, which is above the 5000 bar limit. It selects the next timeframe in the sequence.
- Next, the indicator does the same with the "3" timeframe. The 3m chart for the symbol has 7D * (1440 / 3) = 3360 bars of data. This is below the 5000 bar limit, so the 3m bars will be used in the AAVP calculation.
Inputs
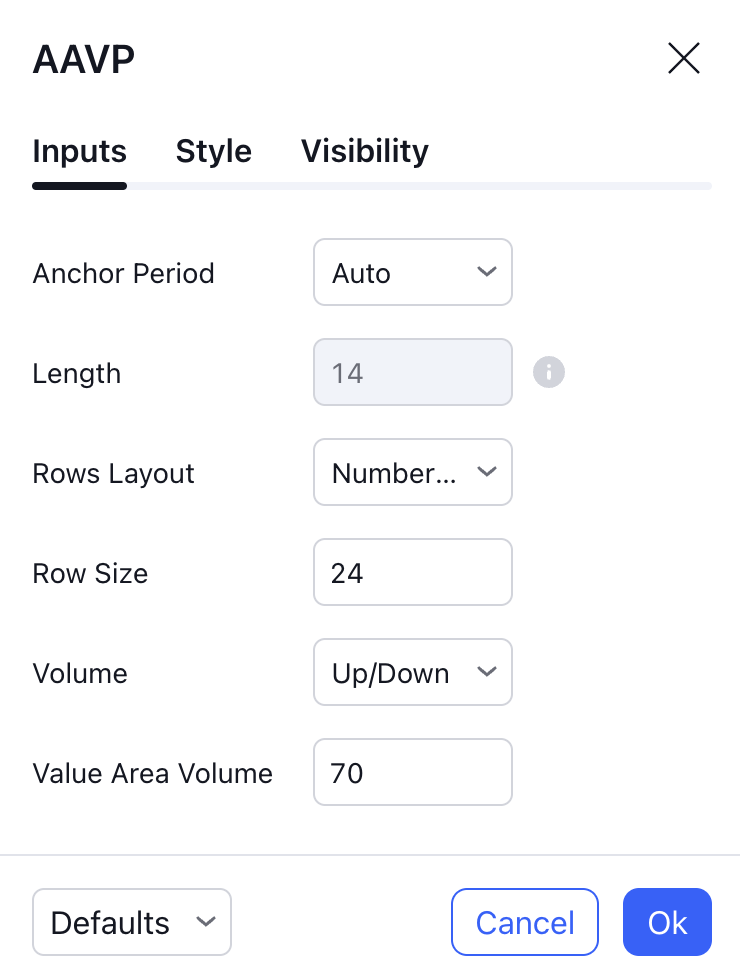
Anchor Period
Anchor Period specifies the anchor of the Volume Profile calculation, i.e. how often Volume Profile recalculates and where it starts. The available options are:
Auto - The starting point of the Volume Profile calculation depends on the timeframe on the chart:
- "Session" on all intraday timeframes
- "Month" on the 1D timeframe
- "Quarter" on all timeframes between 2D and 10D
- "Year" on all timeframes between 11D and 60D
- "Decade" on all timeframes above 61D
Highest High - Volume Profile starts on the bar with the highest high among the last X bars, where X is specified in the Length argument.
Lowest Low - Volume Profile starts on the bar with the lowest low among the last X bars, where X is specified in the Length argument.
Highest Volume - Volume Profile starts on the bar with the highest volume among the last X bars, where X is specified in the Length argument.
Session - Volume Profile starts at the beginning of the last daily session.
Week - Volume Profile starts at the beginning of the last week.
Month - Volume Profile starts at the beginning of the last month.
Year - Volume Profile starts at the beginning of the last year.
Quarter - Volume Profile starts at the beginning of the last quarter (three-month period: Jan-Mar, Apr-Jun, Jul-Sep, Oct-Dec).
Decade - Volume Profile starts at the beginning of the last decade.
Century - Volume Profile starts at the beginning of the last century.
Earnings - Volume Profile starts at the bar with the last earnings report for the current symbol.
Dividends - Volume Profile starts at the bar with the last dividends report for the current symbol.
Splits - Volume Profile starts at the bar with the last split for the current symbol.
Length
A rolling window that specifies the number of bars that the indicator analyzes when searching for the anchor. Applies only to Highest High, Lowest Low, and Highest Volume anchor periods. E.g. with the Highest High anchor period and the length of 100, the indicator will search the last 100 bars for the bar with the highest ‘high’ value to start the Volume Profile calculation on.
Rows Layout / Row Size
These two inputs specify the way the indicator calculates how many rows each histogram will have.
If Rows Layout is set to “Number of Rows”, Row Size sets the total number of rows in the histogram: for example, with Row Size of 25 the histogram, top to bottom, will have 25 rows. The height of each row will be calculated automatically; in the example above, a Volume Profile histogram spanning the price from 200 to 300 will have (300 - 200) / 25 = 4 points per each row.
If this input is set to “Ticks Per Row”, Row Size indicates the number of ticks in each single row (1 tick being the minimal move the price for this symbol can make: for example, for NASDAQ:AAPL, 1 tick is 0.01 because the price needs to move at least 0.01 USD, i.e. 1 cent). E.g., setting it to 25 will mean that each row has the height of 25 ticks. In that case, the number of rows will be calculated automatically, and the Volume Profile histogram spanning the price from 200 to 300 for a symbol with a mintick of 0.01 will have (300 - 200) / 0.01 / 25 = 400 rows per each histogram.
Volume
Toggles between showing total volume for each row (Total), splitting each row into up/down (Up/Down), or showing their difference (Delta).
Value Area Volume
Specifies what percentage of all volume for the trading session should be highlighted by Value Area.