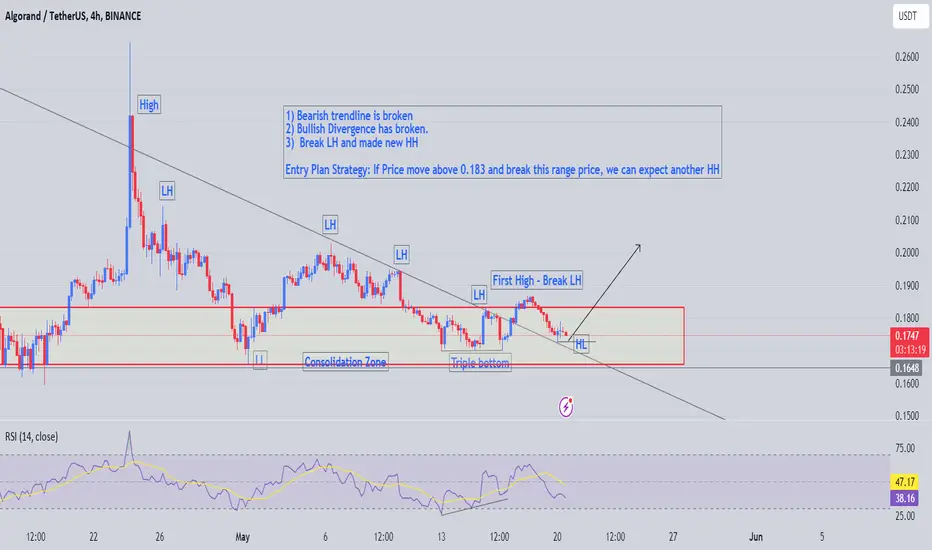
ALGOUSDT - Looks for Reversal and Entry Plan Stretegy
1) Bearish trendline is broken
2) Bullish Divergence has broken.
3) Break LH and made new HH
Entry Plan Strategy : If Price move above 0.183 and break this range price, we can expect another HH
ALGOUSDT trade ideas
ALGOUSDT 1WAccumulate some #ALGO. The inverse Head & Shoulder pattern is still valid on the weekly chart. Targets are:
$0.2689
$0.2920
$0.3271
$0.4752
$0.5949
$0.7145

Higher lowPossible Higher low in the making on weekly, atleast a dump,
Now we need news, somekind of war story

ALGO/USDT Gathering Momentum to Breach Descending Resistance👀🚀💎Paradisers, a golden opportunity is knocking with #Algorand! Currently, there's a significant chance for a bullish reversal from the pivotal support at $0.1563. If #ALGO can hold steady at this level, it may signal the beginning of a bullish surge, potentially breaking through the descending resistance to reach our projected strong resistance area.
💎If #Algorand fails to rise from the $0.1563 support and instead dips below, we could be seeing the start of a more extended downtrend. The next essential demand zone at $0.145 has historically triggered notable bullish reactions due to substantial trading volume and liquidity.
💎If #ALGO tests this demand zone once more, it’s imperative that it recovers. Failure to do so could amplify bearish trends and sour market sentiment, potentially pushing prices down even further.
💎Stay sharp and agile, Paradisers. The current market conditions for #ALGO demand our attention and readiness to pivot strategies swiftly.

ALGO can grow more after the triangle breakoutALGO can grow more after the triangle breakout
From our previous analysis ALGO reached two of the targets.
SO far the price completed a bullish triangle and already broke out during the BTC bullish wave.
The pattern looks really good and this breakout is showing for the presence of the bulls joining the market.
ALGO may rise up to 0.200 and 0.2100 as shown in the chart.
You may find more details in the chart!
Thank you and Good Luck!
❤️PS: Please support with a like or comment if you find this analysis useful for your trading day❤️
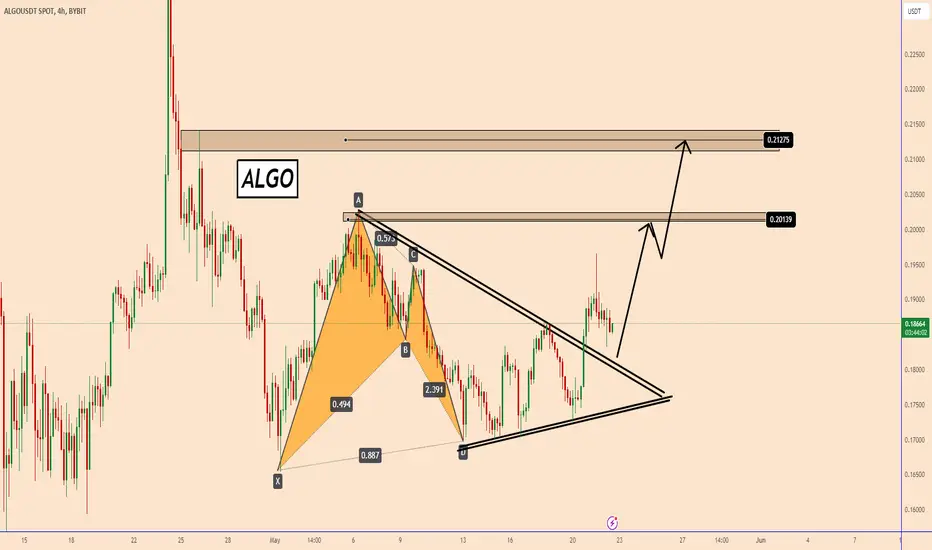
ALGO: Bullish Bat PatternALGO: Bullish Bat Pattern
Algo completed a bullish BAT pattern signaling a possible correction or a change in trend.
What is important is that in both ways the pattern is signaling for a possible bullish wave.
Considering that the price reacted perfectly after the pattern was completed this is adding the chances for a clear bullish movement.
You may find more details in the chart!
Thank you and Good Luck!
❤️PS: Please support with a like or comment if you find this analysis useful for your trading day❤️

ALGOUSDT - harmonic patternhi Traders,
ALGOUSDT looks similar to many altcoins.
Potential harmonic pattern forming. Bearish bat pattern.
Price is in the low-risk area so it's still a good time to buy ALGO now.
Target: 0.30$ - 0,31$
Expecting this move to occur within the next couple of weeks.
Good luck

ALGO/USDTI am very bullish based on the chart and the news that will come about algos during the European Championship

ALGOUSDT IDEAHello Trading view Family / Fellow Traders.
I hope you have used and benifited from the previous analysis .
In today trading session we are monitoring ALGOUSDT for a buying opportunity,
ALGOUSDT UPDATE
#Algo is ready to break the Bearish pennant pattern in 1D time frame ✴️
Successful Breakout may lead 30-35% increase in price💸✅

Algorand on its way to challenge the last overhead resistanceAlgo is is gearing up to challenge its overhead resistance; the last one remaining in this cycle. I believe this will happen sometime in June/July. Things will ramp up suddenly after that.

ALGO: Approaching ResistanceTrade setup : Trends are mixed to down. Price has broken out of a Channel Down pattern but it’s now approaching a stiff resistance area: horizontal resistance of $0.20 and 200-day Moving Average. If it breaks above that, it would signal resumption of uptrend and upside potential to $0.25.
Trend : Downtrend across all time horizons (Short- Medium- and Long-Term).
Momentum is Mixed as MACD Line is above MACD Signal Line (Bullish) but RSI ~ 50 (Neutral).
Support and Resistance : Nearest Support Zone is $0.15, then $0.12. The nearest Resistance Zone is $0.20, then $0.25 and $0.30.

Algousdt Buy opportunityAlgousdt is currently exhibiting a potential cup and handle reversal pattern following a significant drop.
This pattern suggests a forthcoming bullish trend for the coin. The designated buyback zone presents an attractive opportunity for purchasing, with expected targets highlighted on the chart.
It is advisable to set the stop loss below the handle area to mitigate risks.
We invite you to share your thoughts and comments on this analysis.
Your input is valued.

ALGOUSD 1WALGO ~ 1W
#ALGO Forming a H&S Pattern on a 1W Time Frame. It's quite interesting to place small purchases here, with a target of at least 20%+

ALGOUSDT1. Profit taking strategy on ALGO.
2. Important to increase your selling as price gets more aggressive on the trend.
3. Note this just my initial plan. You can have more aggressive or conservative approach.
4. This plan is subject to change depending how alt season goes this just what I see for now.

ALGORAND/USDT Possible trend reversalIt looks like Algorand will go up after a long sideways trend. This is evidenced by the volumes and consolidation after recent major purchases. Without further ado, a breakout of the lower line means greater downside potential, and a breakout of the upper line means potential upside. Algorand is currently at a great price to risk a larger purchase, I don't expect it to fall much lower, and you can also hold it and multiply it using stacking. In my opinion, 0.17 is a great price for this coin, and we have the potential to increase up to $1 in a short period of time.

ALGO: Channel Down BreakoutTrade setup : Trends are mixed to down. Price has broken out of a Channel Down pattern but it’s now retesting that breakout level. If successful, price could revisit $0.22. Stop Loss (SL) level at $0.175.
Pattern : Price was trading in a Channel Down pattern. With complete patterns (i.e. a breakout) – initiate a trade when the price breaks through the channel’s trendlines, either on the upper or lower side. When this happens, the price can move rapidly in the direction of that breakout. Learn to trade chart patterns in Lesson 8.
Trend : Downtrend across all time horizons (Short- Medium- and Long-Term).
Momentum is Bearish (MACD Line is below MACD Signal Line, and RSI is below 45).
Support and Resistance : Nearest Support Zone is $0.15, then $0.12. The nearest Resistance Zone is $0.20, then $0.25 and $0.30.

Algorand testing the 4 Hour Resistance at USDT0.1043, breakout?Take noted the below is not an investment advise, bet at your own risk. I am solely not responsible for any of your loses in money or assets.
The Current Algorand price is USDT0.1004 as of 8 October 2023.
The Algorand have potential to breakout from USDT0.1004 to USDT0.2185 range in the coming 1 to 2 months before the Fed's FOMC in November 2023. This is because the US court has ruled that SEC need to approved Bitcoin ETF from Grayscale. This is a very strong tailwind for the entire cryptocurrency market.
The price will hover between USDT0.1004 to about USDT0.2185 within this period.
The other Potential strong tailwind is the pause of US Fed's rate hike this coming November 2023. This along with the Bitcoin ETF approval will drive and test the resistance level at USDT0.2185. If there is a breakout then the next level of stronger resistance based on the dynamic resistance will be at USDT1.4052.
Currently there is no potential strong headwind in the cryptocurrency space. The only potential strong headwind is the S&P market falling to around 3900 to 3850 because of higher rate for longer by Fed's US. If next 1.5 months down the road if there is other or fews strong headwinds appears then the price might breakout from USDT0.0778 and head much lower maybe even USDT0.01 is possible. This is highly unlikely to happen since everyone is anticipating a positive news of strong tailwind from the Grayscale Bitcoin ETF win over SEC. Currently don't see any much potential of future strong headwind.
USDT0.0778 is not a strong support level based on the 4 hour chart of Algorand. I would only start buying a little at USDT0.0778 and reassess for 2 to 3 weeks before buying more. If by the time Algorand reach USDT0.0778 and the S&P most likely have no reach 3900. The buying scenario above might not happen in this month October 2023 cause everyone will not be selling because of a very potential Bitcoin ETF in the market soon but don't know when only.
Based on current market condition it is highly unlikely to get a low that surpasses last year bottom.

ALGO Stuck in the rangeALGORAND is stuck in this range after a weak break abive the main bearish trendline. Range can be good, because usually is an accumulation zone. We just need to wait for a break above this range to see a pump till the local top that is the first resistance zone

ALGO: Channel Down BreakoutTrade setup : Trends are mixed to down. Price has broken out of a Channel Down pattern but it’s now retesting that breakout level. If successful, price could revisit $0.22. Stop Loss (SL) level at $0.175.
Pattern : Price was trading in a Channel Down pattern. With complete patterns (i.e. a breakout) – initiate a trade when the price breaks through the channel’s trendlines, either on the upper or lower side. When this happens, the price can move rapidly in the direction of that breakout. Learn to trade chart patterns in Lesson 8.
Trend : Downtrend across all time horizons (Short- Medium- and Long-Term).
Momentum is Mixed as MACD Line is above MACD Signal Line (Bullish) but RSI < 45 (Bearish). MACD Histogram bars are declining, which suggests that momentum is weakening.
Support and Resistance : Nearest Support Zone is $0.15, then $0.12. The nearest Resistance Zone is $0.20, then $0.25 and $0.30.


ALGO USDT - Bearish Sentiments and chart is not looking goodALGO is forming a bearish flag and also if we use ABCD pattern, I can see that this pair is in downward trend.
Key levels are defined and the price is in downward trend.

ALGO: Channel Down BreakoutTrade setup : Trends are mixed to down. Price has broken out of a Channel Down pattern and back above that 200-day MA to signal trend reversal to Uptrend. Near-term upside potential to $0.22. Stop Loss (SL) level at $0.175.
Pattern : Price was trading in a Channel Down pattern. With complete patterns (i.e. a breakout) – initiate a trade when the price breaks through the channel’s trendlines, either on the upper or lower side. When this happens, the price can move rapidly in the direction of that breakout. Learn to trade chart patterns in Lesson 8.
Trend : Downtrend on Medium-Term basis and Uptrend on Short- and Long-Term basis.
Momentum is Mixed as MACD Line is above MACD Signal Line (Bullish) but RSI ~ 50 (Neutral).
Support and Resistance : Nearest Support Zone is $0.15, then $0.12. The nearest Resistance Zone is $0.20, then $0.25 and $0.30.

ALGOUSDT - Inverse Head and Shoulders in the Making on WeeklyEnter on 3D close above 0.3 $. (Inverse H&S Breakout)
Invalidation at 3D close below 0.15 $
Take profit 1 & 2 on chart @ marked Fib-levels.
Trade safely and with a proper risk management.
