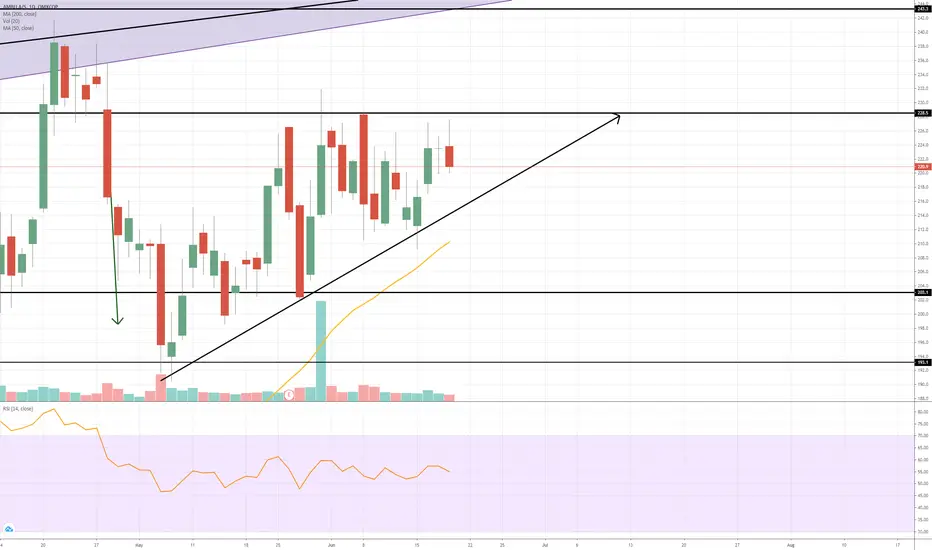
AMBU still going sown.Just wanted to make a fast update, but like 98 % of the rest of the market we are
in an downtrend.
They positive can be that its starting or started to look good on some signal on the lower timeframes, but the last couple of days have ruied that.
So as i see it , its still just a hold IF your hol
Next report date
—
Report period
—
EPS estimate
—
Revenue estimate
—
0.21 USD
35.07 M USD
804.52 M USD
140.81 M
About Ambu A/S Class B
Sector
Industry
CEO
Britt Meelby Jensen
Website
Headquarters
Ballerup
Founded
1956
ISIN
DK0060946788
FIGI
BBG00GD70Z06
Ambu A/S engages in the development, production, and marketing of diagnostic and life-supporting devices for hospitals and rescue services. It operates through the following segments: Anaesthesia; Patient Monitoring & Diagnostics; and Visualisation. The Anaesthesia segment offers products from resuscitators, face masks, and laryngeal masks to the single use flexible intubation scope. The Patient Monitoring & Diagnostics segmet provides electrodes for cardiology, neurophysiology, and polysomnography. The Visualisation segment includes single-use visualisation devices, which are used in single lung ventilation procedure, or a bedside bronchoscopy procedure in the intensive care unit . The company was founded by Holger Hesse in 1937 and is headquartered in Ballerup, Denmark.
Related stocks

AMBU Technical Analysis AMBU is very low right now and it seems like it could go very high with the OMX C25 Index . It is at the lowest for almost 2 years and with the interest rates going down it could lift the shares a lot. There is a very strong support level under it and a good resistance goal.

AUBU close to support area! where to next? 👇☝️Just an picture og the stock AMBU and how i see it and where i might be heading.
remember to do your own analysis and never trade out from others.
Stay humble
Marttin

Great pullback, time for reversal?I'm expecting reversal on neckline of big head and shoulders pattern, great upside, might try this.

AMBU - Bullish long termAmbu har fået sin længe ventet reversal og bevæger sig i den rigtige retning. Jeg tror vi skal op omkring kurs 200 stille og roligt.

AMBU close to downtrendBuy/Sell oppitunities = Orange
MA 200 line = Blue
Are AMBU going to turn into a downtrend ?
Are MA 200 gonna hold ?
There is only one small resistance left befor we go bearish.
Disclaimer: Im not in AMBU

Breakout of wedge - AMBU looks bullishAMBU has broken this slightly bearish wedge in a stron bullish uptrend during corona. One could wait to see that this week closes over the indicated wedge.

Last chance at reaching going higher short term?I see the current weeks movement as a ascending triangle, hopefully it makes it our upwards, but be aware of a breakdown, it is still frying quite high, about 50% over 200MA daily.
Take care, happy trading.
Watch for break of resistance level at 230 DKK in AMBU AMBU has taken a break since april 2020 after a very nice rally in 2020 due to hospitals mass buy of AMBU's respiratory equipment. The trend is still up and if it can break 230 DKK the next days/weeks, it would signal further increase in the stock price. Maybe all the way to the top of the trend cha


See all ideas
Summarizing what the indicators are suggesting.
Neutral
SellBuy
Strong sellStrong buy
Strong sellSellNeutralBuyStrong buy
Neutral
SellBuy
Strong sellStrong buy
Strong sellSellNeutralBuyStrong buy
Neutral
SellBuy
Strong sellStrong buy
Strong sellSellNeutralBuyStrong buy
An aggregate view of professional's ratings.
Neutral
SellBuy
Strong sellStrong buy
Strong sellSellNeutralBuyStrong buy
Neutral
SellBuy
Strong sellStrong buy
Strong sellSellNeutralBuyStrong buy
Neutral
SellBuy
Strong sellStrong buy
Strong sellSellNeutralBuyStrong buy
Displays a symbol's price movements over previous years to identify recurring trends.
MEUH
Amundi Core Stoxx Europe 600 -UCITS ETF HEDGED- CapitalisationWeight
0.02%
Market value
2.97 M
USD
STXH
Amundi Index Solutions SICAV - Amundi Core Stoxx Europe 600 UCITS ETF Monthly Hedged to EUR - Dist- DistributionWeight
0.02%
Market value
2.97 M
USD
Explore more ETFs
Frequently Asked Questions
The current price of AMBFF is 14.56 USD — it has decreased by −5.48% in the past 24 hours. Watch Ambu A/S stock price performance more closely on the chart.
Depending on the exchange, the stock ticker may vary. For instance, on OTC exchange Ambu A/S stocks are traded under the ticker AMBFF.
AMBFF stock has fallen by −5.52% compared to the previous week, the month change is a −5.52% fall, over the last year Ambu A/S has showed a −26.85% decrease.
We've gathered analysts' opinions on Ambu A/S future price: according to them, AMBFF price has a max estimate of 23.33 USD and a min estimate of 13.82 USD. Watch AMBFF chart and read a more detailed Ambu A/S stock forecast: see what analysts think of Ambu A/S and suggest that you do with its stocks.
AMBFF reached its all-time high on Nov 7, 2017 with the price of 90.37 USD, and its all-time low was 9.26 USD and was reached on Oct 11, 2022. View more price dynamics on AMBFF chart.
See other stocks reaching their highest and lowest prices.
See other stocks reaching their highest and lowest prices.
AMBFF stock is 5.80% volatile and has beta coefficient of 0.37. Track Ambu A/S stock price on the chart and check out the list of the most volatile stocks — is Ambu A/S there?
Today Ambu A/S has the market capitalization of 3.42 B, it has increased by 3.80% over the last week.
Yes, you can track Ambu A/S financials in yearly and quarterly reports right on TradingView.
Ambu A/S is going to release the next earnings report on Feb 4, 2026. Keep track of upcoming events with our Earnings Calendar.
AMBFF earnings for the last quarter are 0.07 USD per share, whereas the estimation was 0.08 USD resulting in a −18.02% surprise. The estimated earnings for the next quarter are 0.07 USD per share. See more details about Ambu A/S earnings.
Ambu A/S revenue for the last quarter amounts to 229.87 M USD, despite the estimated figure of 236.00 M USD. In the next quarter, revenue is expected to reach 241.32 M USD.
AMBFF net income for the last quarter is 19.38 M USD, while the quarter before that showed 27.24 M USD of net income which accounts for −28.87% change. Track more Ambu A/S financial stats to get the full picture.
Yes, AMBFF dividends are paid annually. The last dividend per share was 0.05 USD. As of today, Dividend Yield (TTM)% is 0.46%. Tracking Ambu A/S dividends might help you take more informed decisions.
Ambu A/S dividend yield was 0.29% in 2024, and payout ratio reached 43.06%. The year before the numbers were 0.00% and 0.00% correspondingly. See high-dividend stocks and find more opportunities for your portfolio.
As of Nov 7, 2025, the company has 5.2 K employees. See our rating of the largest employees — is Ambu A/S on this list?
EBITDA measures a company's operating performance, its growth signifies an improvement in the efficiency of a company. Ambu A/S EBITDA is 181.79 M USD, and current EBITDA margin is 18.66%. See more stats in Ambu A/S financial statements.
Like other stocks, AMBFF shares are traded on stock exchanges, e.g. Nasdaq, Nyse, Euronext, and the easiest way to buy them is through an online stock broker. To do this, you need to open an account and follow a broker's procedures, then start trading. You can trade Ambu A/S stock right from TradingView charts — choose your broker and connect to your account.
Investing in stocks requires a comprehensive research: you should carefully study all the available data, e.g. company's financials, related news, and its technical analysis. So Ambu A/S technincal analysis shows the strong sell today, and its 1 week rating is strong sell. Since market conditions are prone to changes, it's worth looking a bit further into the future — according to the 1 month rating Ambu A/S stock shows the sell signal. See more of Ambu A/S technicals for a more comprehensive analysis.
If you're still not sure, try looking for inspiration in our curated watchlists.
If you're still not sure, try looking for inspiration in our curated watchlists.