IYT trade ideas

IYT bearish – Potential to test August’s 128.26 lowIYT 139.46 bearish – Potential to test August’s 128.26 low
IYT has been consolidating within the wide range between August’s 128.26 low (August 24, 2015) and the recovery high at 149.86 (September 14, 2015). Given the strong bearish momentum, there is potential to see a retest of the 128.26 low near 38.2% of the 70.82/167.80 (October 2011 low/November 2014 high) rise. Below lies the 200 week moving average currently at 123.69. The 142.72/146.97 resistance zone (July 6 low/September 21 high, 2015) which houses the 50 day moving average currently at 144.76 should cap bounces. Bulls must reclaim the area to stabilize the structure and improve the outlook for 149.86.
Outlook:
Daily: bearish
Weekly: neutral

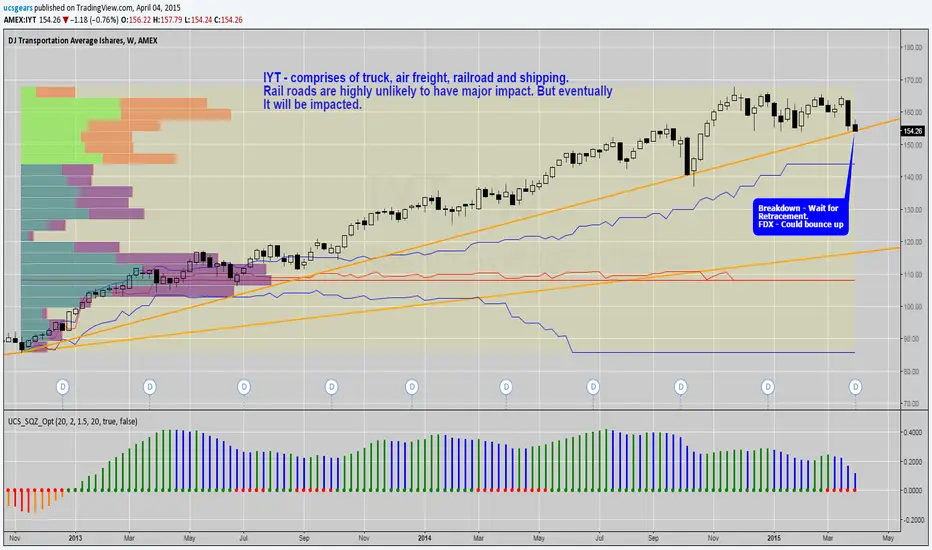
IYT LONGIYT is setting up for a long again. I am going
to wait for it to clear the cloud but if one is
aggressive you could enter in this area


IYT finally over the 49 M.A.IYT was a great short every time it was overbought when it was under the 49 M.A.. Now overbought readings can't be trusted for short initiations.

IYTJust updating this. IYT/DIA didn't hold the level, but it's still in the range. One problem with this idea is airlines are performing far better now than they have in years and this is likely holding up (if you can believe it) the trannies somewhat.


IYT and oil means everything right nowIf oil bounces here, off its new support, IYT will NOT like it, and break through to the downside the long term trend line, and the link between DOWI and IYT will see the DOWI fail to bring up the IYT to it, and it will be the IYT dragging the DOWI down to it, resulting in a multi year double top. This green triangle is a multi year event.


IYT leads SPY Tilted double top formations looking leftThe big picture says a lot here. Titled double top formations in the past..... and what happened next. We broke long term trend channel support in IYT, and if oil rises, it will hurt them even more, even if the dollar slumps, will not be enough to offset higher fuel costs, and economic contraction hurts ticket sales.

IYT (transports) rolling over ahead of SPY (soon)IYT downturn always leads 4 to 8 months ahead of a general equities market downturn. We are at 5 months now from the top of IYT. MACD and RSI indicating this trend continues. If oil continues up, and dollar down, only puts more down pressure on equities, although XLE might like it, however, today, even XLE down (with oil up)? Things that I notice for good reason.

IYT at 2015 low, will SPY follow?IYT better have a huge rally, or the DOW theory pundits will be calling for a huge correction in the SPY.

IYT $155.87: Consolidates near critical support zoneIYT rebounded off 152.03 (April 6, 2015) back above the 154.02/154.02 3-1/2 month range support area to rally to 160.29 (April 23, 2015) before ranging. While the 153.39/154.02 support zone holds dips, there is scope for further upside. A clean break back above the 157.39/158.48 moving average resistance levels would signal return of strength and open 160.29. Clearing the latter would confirm extension of the 4-week upleg to open 165.00 (March 20, 2015 high) near the range ceiling. Only a decisive breakdown below 150.23 would signal topping.
Outlook:
Short term: neutral
Long term: bullish while above 153.39/154.02

IYTPossible IHS - target aligns with descending trend line. I'm not looking all that close, but CSX has been nuts lately and could be the bulk of this move.

IYT $156.89: Consolidates within a 5-month falling channel
IYT has been consolidating within a 5- month falling channel as shown on the weekly chart. While the 155.68 weekly low (April 20, 2015) holds dips, strength back above 157.93 (April 20, 2015 weekly high) would signal a 5-week range break on the upside and trigger further gains towards 165.69 (March 16, 2015 weekly high) near the channel upper bounds. A sustained break above the latter is needed to confirm channel breakout for a move towards 167.80 (November 24, 2014 record high). However, a push below 155.68 would delay bulls and shift the focus towards the 152.03 (April 6, 2015) near the channel support which should hold.
Outlook:
Short term: neutral
Long term: bullish

IYT lower from here to ????Even if the transports like lower oil, the dollar relentless up turn is hurting their bottom line with their international flights, so at some point here they cancel out, and their bottom lines go lower, regardless of how low oil goes. the only winner here in really low oil is the individual consumer, and most people are just adding to their savings with the savings from oil, not spending it.

IYT - Reaction to the Stable Crude PricesTransportation Index might start breaking down. Provided the Crude Oil Prices are stabilizing.
- Crude chart -
Watch out for the NYA and NASX as well.
NYSE Composite still getting rejected at the high. NYSE could sell off another 1000 points if it cracks. Along with that the other sectors and industry group will be followed.
IYTNotes on chart. Gartley tgt hit. Lots of support in this zone. Below this area look to Crab. Rails are weak, USO is going up which could hurt airlines.

Transport- 5* short ahead - Best Short ever if spikes to 175
That would be a 10% rally over 5 weeks.
if that happens, you have a 5* short.
Monitor very closely as this could be the opportunity of the year.

$IYT & $TRAN Bearish Setup$IYT - DJ Trasnportation Average Ishares is in bearish slope, the crown top formation on Dec'14 and broke of 160.60 key level rang me for changing behaviour from Bulls to Bear.

Transport Index - Nowhere to go - Short Cone getting narrow.
22.63% up on the last leg
95% up since Nov 2012.
Just mechanics here suggest short.
Clearly the Transport sector has benefited from the recent crude oil falling. This may be well priced now.
A 2 week breather seems in order then maybe (maybe only) higher.

If you must pick a top, start with the IYT. IYT at an all-time high, and at the top of it's bollinger band.
