LABU trade ideas


LABU: This is tricky. While the NDX bottomed on March 4, Biotechdid not. It printed a WXY three weeks later. Today is likely the bottom of Y.
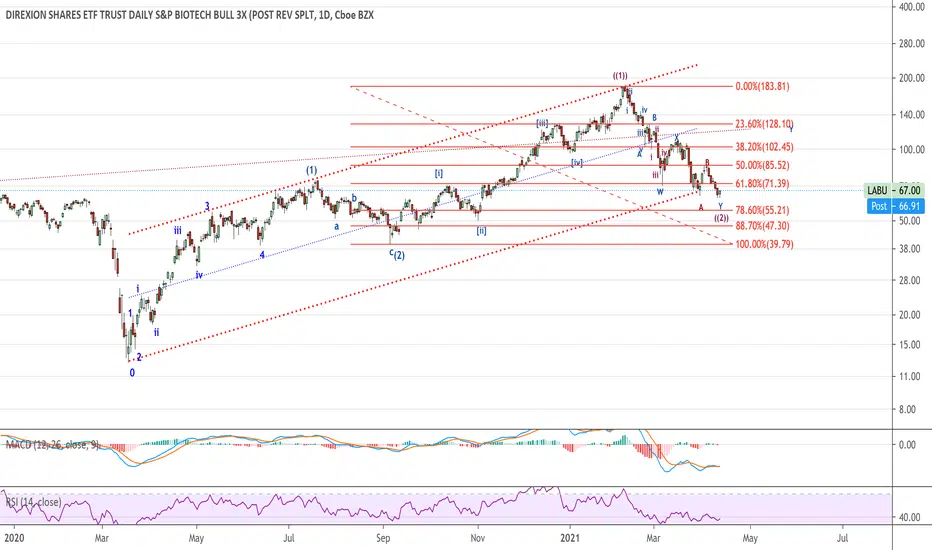


LABU: Bottom Channel and Long term trend line provides supportFib 38.2 reached.Target is major fib extension of A=C


Looking readyLooking for a nice long to the PT. I will wait for open and see where we go. This should be a nice play next week if not we will wait for a bigger pullback to the red.
stonks


LABU Long (Monthly)LABU Long analysis on the monthly. Looks like a lot of accumulation looking to breakout biggins.

LABU - daily chart SELL around 66.20
T1 56.55
T2 50.15
SL closing up 70.55
70.55 This is the highest of the candlestick pattern called bearish engulfing

Buying opportunity here below 55. Looking for reversal.Long here 54.4. Looking for a reversal today and a continued breakout of this channel.

Biotech Bounce and Breakout?LABU is showing really good support. It's currently in a decline but should hold at $48.95 ish with a bounce and possible triangular breakout.


LABU (XBI) LONG - Price Target: $70. Moving average convergence/divergence crossover on multiple timeframes, RSI rising quickly out of overbought area, price bounced off of a long term price support/resistance line.
Target $70 : Tight stop loss

In here 51.69 on a triple bottom. Target 55+Looking for a quick trade back to the 55/57 range early this week.


Biotech's Lookin' Good (for a bit at least)Bull flag that looked for a short while like it was pulling a head-fake and retreating but in the last hour of trading (as always) my instincts are rewarded and it continues to climb up. I've put in a prospective overhead resistance but remember to trail your stops because anything can happen! Other ETF's are looking bullish too like DRN, SOXL and TECL.

LABU MACD Histogram just turned positiveThis is a Bullish indicator signaling LABU's price could rise from here. Traders may explore going long the stock or buying call options. I identified 41 similar cases where LABU's MACD histogram became positive, and 39 of them led to successful outcomes. Odds of Success: 90%.

LABU's 50-day MA moved above its 200-day MA on June 19, 2020This price move may be construed as a buy signal, as it indicates the trend is shifting higher.

Bullish LABU 100% Per Month This instrument currently has very strong, positive sentiment due to correlation with SARS-CoV-2.
RSI shows that the ETF is not overbought.
Index Top Ten Holdings (%):
Regeneron Pharmaceuticals 2.77
Moderna 2.65
Gilead Sciences 2.43
Vertex Pharmaceuticals 2.32
Biogen 2.27
United Therapeutics 2.26
Biomarin Pharmaceutical 2.25
Seattle Genetics 2.16
Exelixis 2.06
Acadia Pharmaceuticals 2.03

Looking for a bounce off of the 0.5 fib retracement at $46.18Keeping an eye on the biotech sector as we see the markets skip due to reactionary virus fears. The weekly may indicate a bullish wedge pattern as it the price swings converge closer and closer together. Short-term bearish. Mid to long term, bullish.
