Key stats
About Invesco S&P 500 Low Volatility ETF
Expense ratio
0.25%
Home page
Inception date
May 5, 2011
SPLV offers a straightforward low-volatility take on the S&P 500. It selects about 100 S&P 500 stocks with the lowest daily volatility over the past year. Least volatile stocks receive the highest weight in the portfolio. SPLV does not consider correlation among stocks, so it produces a basket of low-volatility stocks, not a minimum volatility portfolio, in contrast with iShares' USMV. The largely unconstrained fund makes sizable sector bets at times, which can change dramatically over successive quarterly rebalances. Volatility-based selection and weighting typically drive SPLV's market-cap and beta lower than its neutral benchmark.
Classification
What's in the fund
Exposure type
Consumer Non-Durables
Finance
Utilities
Stock breakdown by region

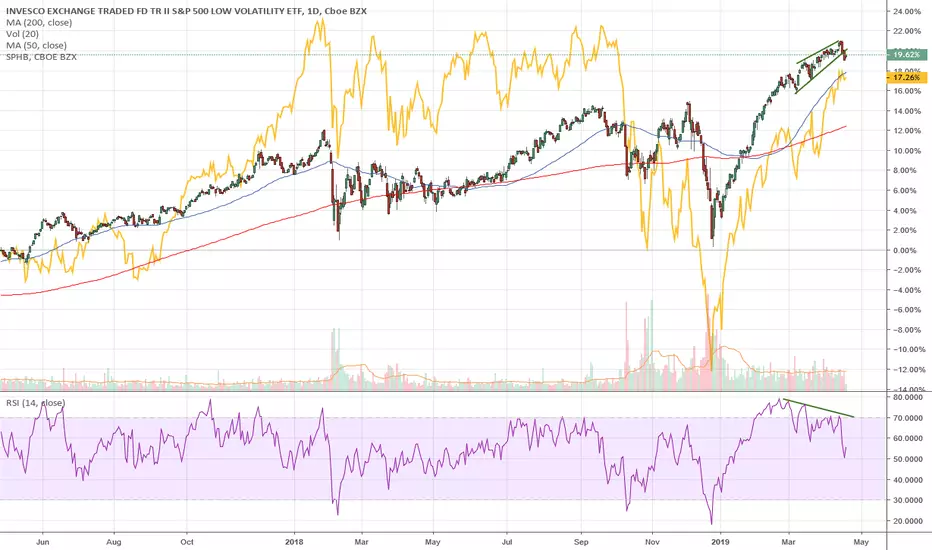
SPLV: MARKETS : At this point I'm a day Trading BEARSPLV helps to take out the noise. At this point we could be BULL or we could be BEAR. Leaning toward BEAR but you can't rule out BULL. IN this kind of situations its always good IDEA to Keep you eye on the LOW volatility stocks (ETF) IT usually prints waves the clearest.
>What we see is a clear down

SPLV vs SPHB - Low Vol vs High BetaThe attached chart highlights the S&P 500 Low Volatility ETF Relative To the S&P 500 High Beta ETF where we note the ratio/price emerging from a 12-month base formation following a downward trend that was in place from the March 2020 lows.
Why is this chart important? The ratio helps investors ide

SPLV BUY OR LONG . TARGET UP TO $58SPLV has completely confirmed the rising triangle, I bought SPLV
Buy : $52.5
Target : $58 , max $62
Stop loss : 6%
Wish you good deals!


How did the Low Vol strategy do this month? Low vol is supposed to be better in times of high vol. (At least that is how a financial advisor explained it to me).
So let's see. This March was quite volatile. How did LOW vol do compared to your vanilla $SPY?
Turns out this month it did 2% worse.


$spy $splv Exhuberant? yepJust sold this out of LT portfolio as well as all individual stocks associated with it. not rational or sustainable at this level.

See all ideas